

Key Insights
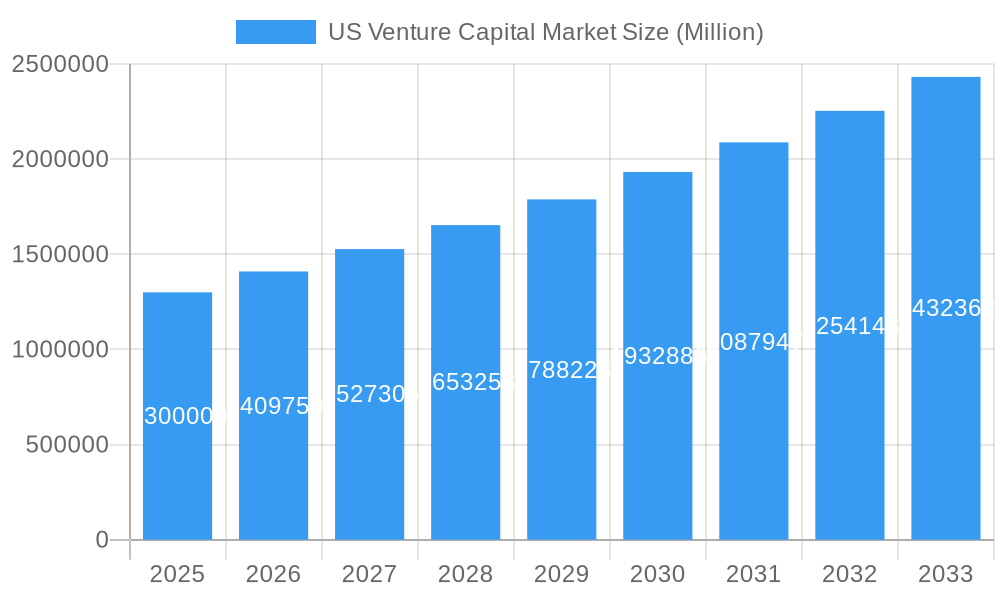
The US venture capital (VC) market, currently valued at $1.30 trillion in 2025, is experiencing robust growth, projected to expand at a compound annual growth rate (CAGR) of 8.25% from 2025 to 2033. This surge is driven by several factors. Firstly, the increasing number of high-growth startups across sectors like technology, biotechnology, and renewable energy, attracting significant VC investment. Secondly, low interest rates and abundant liquidity in the global financial system have fueled investor appetite for higher-risk, higher-reward ventures. Thirdly, the rise of sophisticated venture capital firms, including prominent players like Intel Capital, Tiger Global Management, Bessemer Venture Partners, Kleiner Perkins, NEA, Accel Partners, Sequoia Capital, and Khosla Ventures, contributes to a more mature and efficient market facilitating deal flow and providing expertise to portfolio companies. While geopolitical uncertainty and potential economic downturns pose risks, the long-term outlook for the US VC market remains positive, fueled by continuous technological innovation and a vibrant entrepreneurial ecosystem.
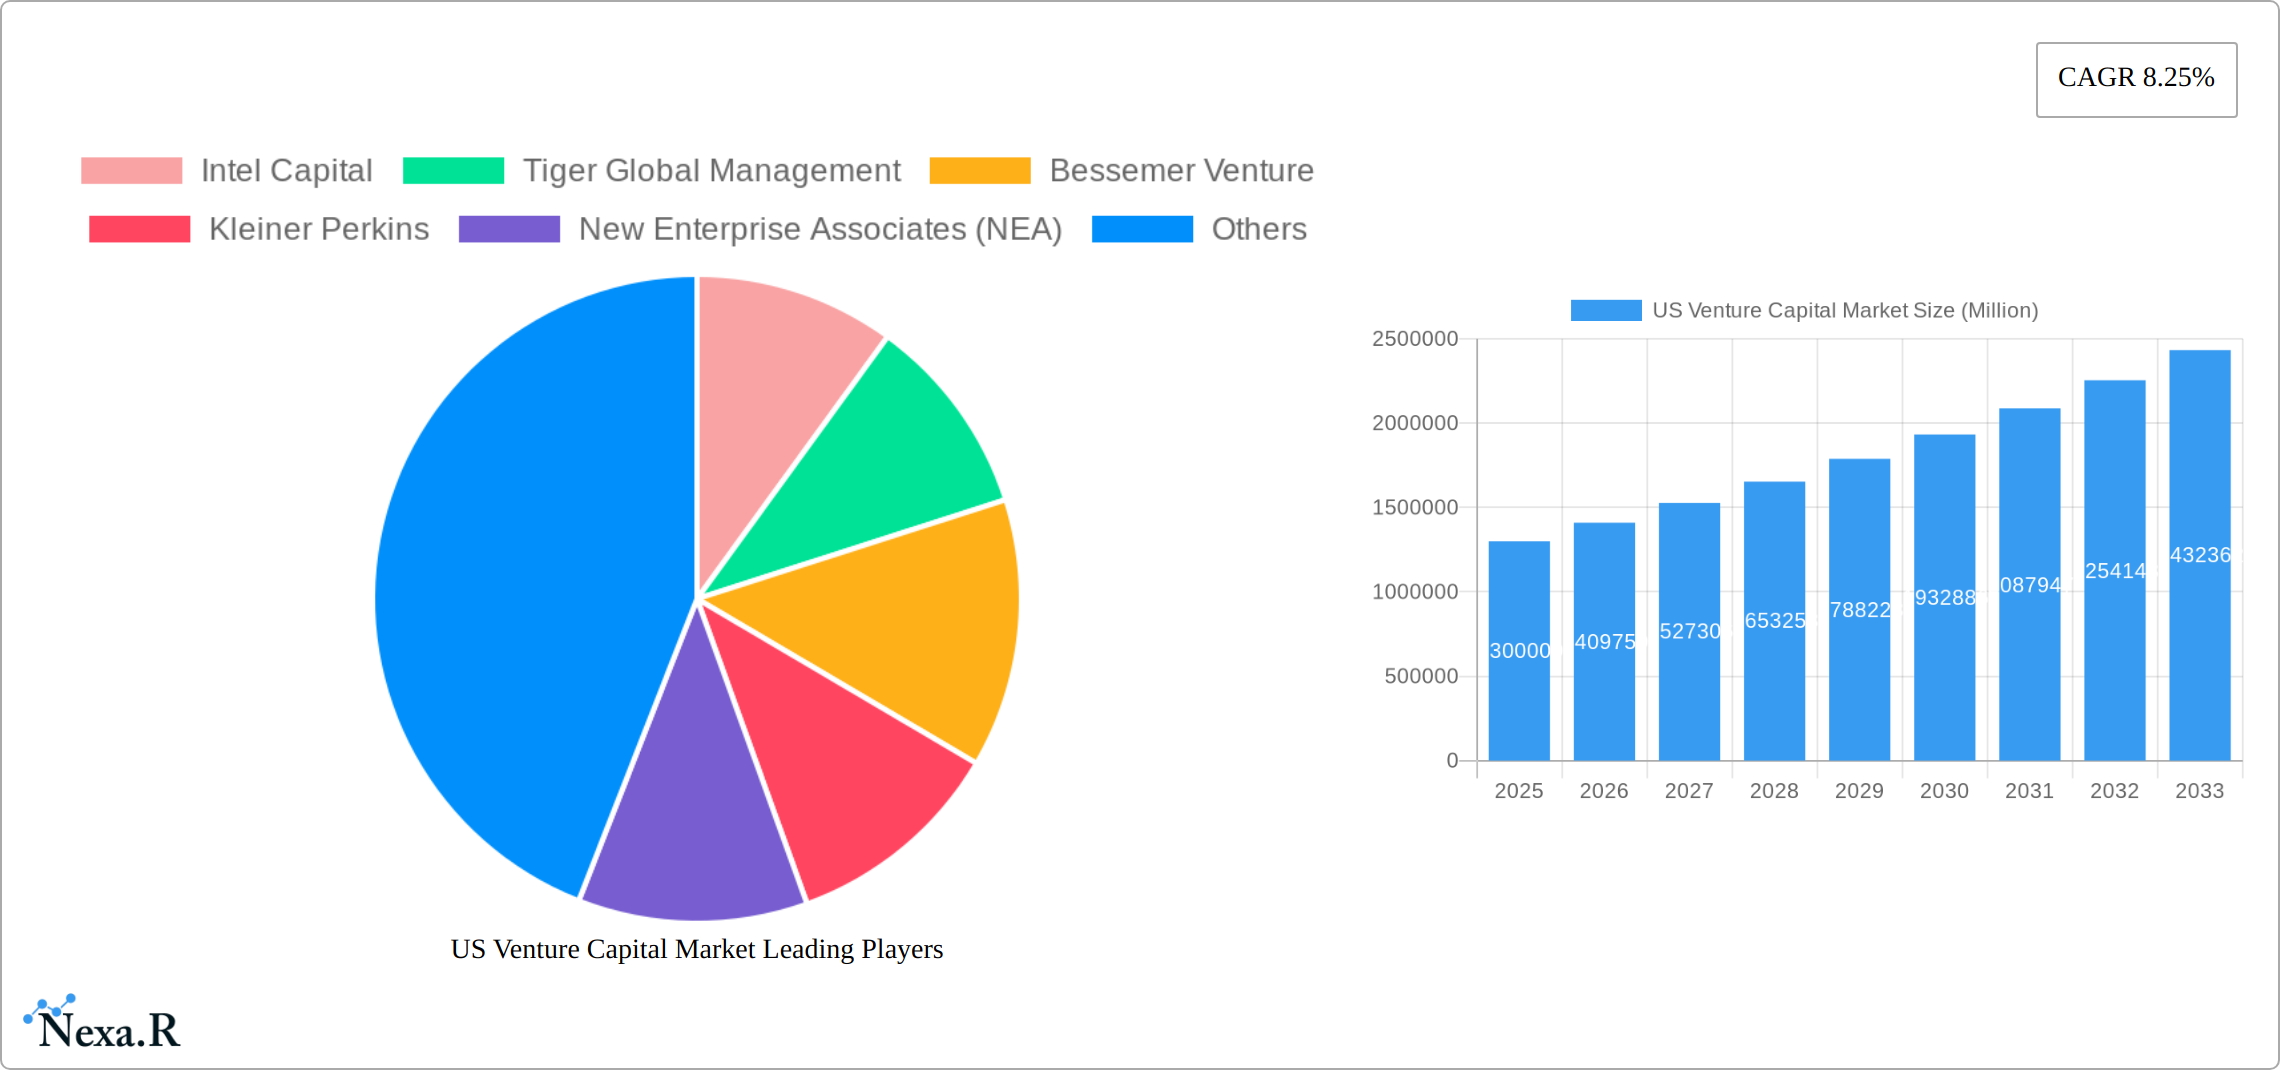
US Venture Capital Market Market Size (In Million)
The historical period (2019-2024) likely witnessed fluctuations reflecting broader economic cycles and specific industry trends. However, the consistent 8.25% CAGR projection indicates a sustained growth trajectory. Segment-specific analysis (e.g., by industry vertical or investment stage) would provide further granularity, revealing potential opportunities and challenges within the market. Regional variations within the US also warrant further investigation, as certain hubs (like Silicon Valley, New York, and Boston) consistently attract a disproportionate share of investment. Understanding these nuances is crucial for both investors and entrepreneurs navigating this dynamic market. The competitive landscape, characterized by established giants alongside emerging players, suggests increasing competition for promising startups, potentially leading to higher valuations and more selective investment strategies.
US Venture Capital Market Company Market Share
US Venture Capital Market: A Comprehensive Report (2019-2033)
This in-depth report provides a comprehensive analysis of the US Venture Capital market, encompassing market dynamics, growth trends, key players, and future outlook. With a study period spanning 2019-2033, a base year of 2025, and a forecast period of 2025-2033, this report offers invaluable insights for investors, entrepreneurs, and industry professionals. The report analyzes parent markets (e.g., Private Equity) and child markets (e.g., Seed Funding, Series A Funding etc.) to provide a holistic understanding of this dynamic sector. The total market size in 2025 is estimated at xx Million.
US Venture Capital Market Dynamics & Structure
The US Venture Capital market is characterized by high dynamism, with significant influence from technological innovation, regulatory changes, and intense competition. Market concentration is relatively high, with a few large firms commanding substantial market share. However, the landscape is also fragmented, with numerous smaller firms specializing in niche sectors.
- Market Concentration: Top 10 firms hold an estimated xx% market share in 2025.
- Technological Innovation: AI, Biotech, and Fintech are key drivers of investment, fueling rapid innovation and substantial capital inflows.
- Regulatory Frameworks: SEC regulations and compliance requirements influence investment strategies and deal structuring.
- Competitive Product Substitutes: Private debt and angel investing offer alternative funding options for startups.
- End-User Demographics: Startups across diverse industries, including SaaS, Healthcare, and E-commerce, attract VC funding.
- M&A Trends: Strategic acquisitions by larger corporations and consolidation amongst VC firms are prevalent, driving market evolution. The number of M&A deals in 2024 was approximately xx, contributing to xx% market growth. Innovation barriers include access to talent and regulatory hurdles, impacting the speed of technological advancements.
US Venture Capital Market Growth Trends & Insights
The US Venture Capital market has demonstrated exceptional resilience and robust expansion throughout the historical period (2019-2024). The market size surged from an estimated [Insert 2019 Market Size in Millions] Million in 2019 to a projected [Insert 2024 Market Size in Millions] Million in 2024, reflecting a Compound Annual Growth Rate (CAGR) of [Insert CAGR %]%. This impressive trajectory is underpinned by a confluence of potent growth drivers. A significant increase in the availability of capital, fueled by both institutional and individual investors, has been a primary catalyst. Concurrently, the nation's vibrant startup ecosystem continues to flourish, nurtured by incubators, accelerators, and a culture of innovation. The relentless advancement and widespread adoption of disruptive technologies across diverse sectors have further amplified investment interest and market valuation. We are observing a pronounced trend of increased VC funding adoption across a spectrum of industries, underscoring a burgeoning confidence in the transformative potential of innovative ventures. Technological disruptions are not only spurring substantial investment but are also instrumental in the emergence of entirely new market segments, thereby creating a virtuous cycle of growth. Furthermore, evolving consumer behaviors, characterized by an accelerated embrace of digital technologies and on-demand services, have unlocked novel avenues for VC-backed companies, leading to a sustained surge in investment. Looking ahead, the forecast period (2025-2033) is anticipated to witness continued, albeit potentially moderated, growth, with a projected CAGR of [Insert Forecast CAGR %]%. Market penetration is expected to reach an impressive [Insert Market Penetration %]% by 2033, signifying a maturing yet dynamic market landscape.
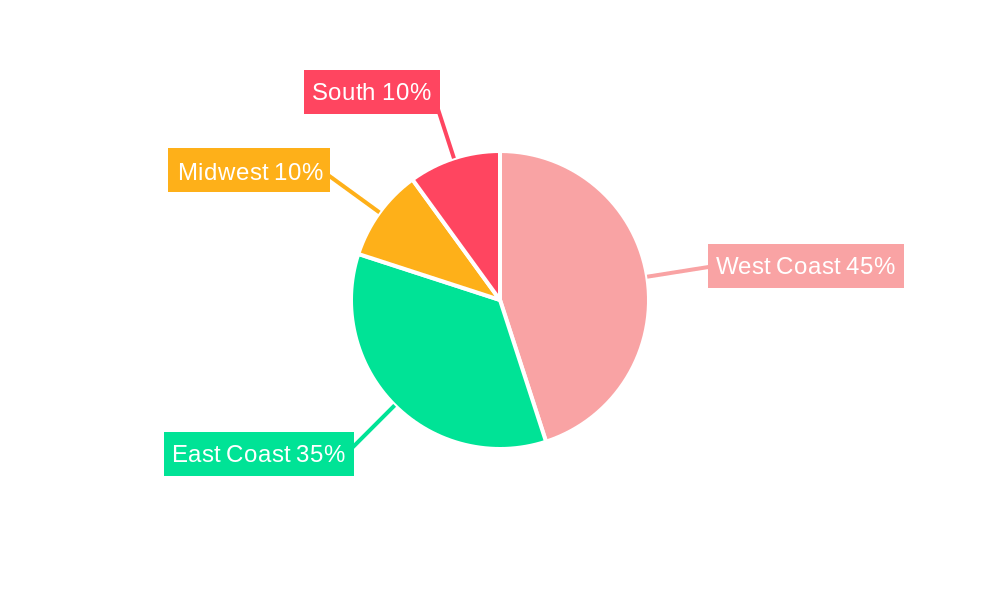
Dominant Regions, Countries, or Segments in US Venture Capital Market
California, New York, and Massachusetts remain the dominant regions for VC investment, driven by established tech hubs, strong talent pools, and supportive entrepreneurial ecosystems. These regions boast well-developed infrastructure, including access to capital, mentorship networks, and regulatory support.
- California: Benefits from a high concentration of technology companies and a thriving startup culture. It holds an estimated xx% of the total market share.
- New York: Attracts significant investment in Fintech and other financial technology sectors. Holds an estimated xx% of the total market share.
- Massachusetts: A strong presence in the biotechnology and life sciences sectors. Holds an estimated xx% of the total market share.
Economic policies promoting innovation, robust venture capital networks and skilled labor pools further reinforce these regions' dominance.
US Venture Capital Market Product Landscape
The US Venture Capital market offers a diverse range of products, primarily focusing on funding stages from seed to late-stage investments. These products are tailored to the specific needs and stages of development for startups. Investment vehicles include equity financing, convertible notes, and debt financing. Technological advancements in areas such as AI-powered due diligence and portfolio management tools are enhancing efficiency and investment decision-making within the industry. Unique selling propositions include specialized expertise in niche sectors, strong network connections, and mentorship programs offered to portfolio companies.
Key Drivers, Barriers & Challenges in US Venture Capital Market
Key Drivers: Technological advancements across various sectors, supportive government policies encouraging entrepreneurship, and abundant capital from both domestic and international investors are driving market growth. The increasing availability of data and analytics tools further enables efficient investment decisions.
Key Barriers & Challenges: Economic downturns can significantly impact VC investment, leading to decreased funding rounds and tighter valuations. Regulatory uncertainties and compliance costs pose challenges. Intense competition amongst VC firms can limit returns for certain investments. Supply chain disruptions can negatively impact startups seeking funding, leading to decreased investment.
Emerging Opportunities in US Venture Capital Market
The US Venture Capital landscape is ripe with untapped potential, particularly within nascent and rapidly evolving technological frontiers. Emerging technologies such as quantum computing, which promises to revolutionize complex problem-solving, and sustainable energy solutions, addressing critical global environmental concerns, represent significant investment frontiers. The transformative power of Artificial Intelligence (AI) and machine learning continues to drive innovation, with novel applications emerging across critical sectors like healthcare (e.g., personalized medicine, drug discovery) and finance (e.g., fraud detection, algorithmic trading), attracting substantial interest from forward-thinking VC firms. Moreover, a pronounced societal shift towards sustainability and ethical consumption is creating fertile ground for startups championing environmentally friendly products, circular economy models, and socially responsible business practices. These evolving consumer preferences are directly translating into investment opportunities for ventures aligned with these values.
Growth Accelerators in the US Venture Capital Market Industry
Several key factors are acting as powerful accelerators for the US Venture Capital market industry. Significant technological breakthroughs across pivotal sectors such as AI, biotechnology, advanced materials, and renewable energy are not only fostering groundbreaking innovation but are also concurrently creating novel and lucrative investment opportunities. The strategic formation of partnerships between established VC firms and corporate entities is proving instrumental in facilitating market access, accelerating product development, and enabling crucial resource sharing, thereby de-risking investments and expediting growth. Furthermore, VC firms are increasingly adopting sophisticated expansion strategies, including the exploration of international markets to tap into global innovation hubs and diversification across various investment stages – from seed funding to later-stage growth capital – which collectively contribute to the industry's overall dynamism and accelerated growth trajectory.
Key Players Shaping the US Venture Capital Market Market
- Intel Capital
- Tiger Global Management
- Bessemer Venture Partners
- Kleiner Perkins
- New Enterprise Associates (NEA)
- Accel Partners
- Sequoia Capital
- Khosla Ventures
- List Not Exhaustive – The landscape is constantly evolving with new and prominent firms emerging.
Notable Milestones in US Venture Capital Market Sector
- January 2023: NEA closed on approximately USD 6.2 billion across two funds, significantly increasing its assets under management.
- March 2022: Intel Corporation's acquisition of Granulate Cloud Solutions highlights the strategic importance of acquisitions in the VC-backed tech landscape.
In-Depth US Venture Capital Market Market Outlook
The outlook for the US Venture Capital market remains exceptionally bright and is poised for sustained, significant growth. This optimism is primarily driven by the continuous wave of groundbreaking technological advancements across numerous sectors, a progressively supportive regulatory environment that encourages innovation and investment, and the unabated availability of capital from a diverse range of investors. Strategic opportunities are abundant, particularly in high-growth emerging technologies and sectors poised for disruption, presenting immense potential for both ambitious entrepreneurs seeking to scale their ventures and discerning investors aiming for substantial returns. The long-term trajectory for the US Venture Capital market is decidedly positive, with considerable untapped growth potential anticipated across a wide array of market segments, promising a dynamic and rewarding future for the ecosystem.
US Venture Capital Market Segmentation
-
1. Industry Type
- 1.1. Banking & Financial Services
- 1.2. Healthcare
- 1.3. Telecommunications
- 1.4. Government Agencies
- 1.5. Other Industries
-
2. Startup Stage
- 2.1. Seed Stage
- 2.2. First Stage
- 2.3. Expansion Stage
- 2.4. Bridge Stage
-
3. Major States
- 3.1. California
- 3.2. New York
- 3.3. Massachusettes
- 3.4. Washington
- 3.5. Others
US Venture Capital Market Segmentation By Geography
-
1. North America
- 1.1. United States
- 1.2. Canada
- 1.3. Mexico
-
2. South America
- 2.1. Brazil
- 2.2. Argentina
- 2.3. Rest of South America
-
3. Europe
- 3.1. United Kingdom
- 3.2. Germany
- 3.3. France
- 3.4. Italy
- 3.5. Spain
- 3.6. Russia
- 3.7. Benelux
- 3.8. Nordics
- 3.9. Rest of Europe
-
4. Middle East & Africa
- 4.1. Turkey
- 4.2. Israel
- 4.3. GCC
- 4.4. North Africa
- 4.5. South Africa
- 4.6. Rest of Middle East & Africa
-
5. Asia Pacific
- 5.1. China
- 5.2. India
- 5.3. Japan
- 5.4. South Korea
- 5.5. ASEAN
- 5.6. Oceania
- 5.7. Rest of Asia Pacific
US Venture Capital Market Regional Market Share
Geographic Coverage of US Venture Capital Market
US Venture Capital Market REPORT HIGHLIGHTS
| Aspects | Details |
|---|---|
| Study Period | 2020-2034 |
| Base Year | 2025 |
| Estimated Year | 2026 |
| Forecast Period | 2026-2034 |
| Historical Period | 2020-2025 |
| Growth Rate | CAGR of 8.25% from 2020-2034 |
| Segmentation |
|
Table of Contents
- 1. Introduction
- 1.1. Research Scope
- 1.2. Market Segmentation
- 1.3. Research Objective
- 1.4. Definitions and Assumptions
- 2. Executive Summary
- 2.1. Market Snapshot
- 3. Market Dynamics
- 3.1. Market Drivers
- 3.2. Market Restrains
- 3.3. Market Trends
- 3.4. Market Opportunities
- 4. Market Factor Analysis
- 4.1. Porters Five Forces
- 4.1.1. Bargaining Power of Suppliers
- 4.1.2. Bargaining Power of Buyers
- 4.1.3. Threat of New Entrants
- 4.1.4. Threat of Substitutes
- 4.1.5. Competitive Rivalry
- 4.2. PESTEL analysis
- 4.3. BCG Analysis
- 4.3.1. Stars (High Growth, High Market Share)
- 4.3.2. Cash Cows (Low Growth, High Market Share)
- 4.3.3. Question Mark (High Growth, Low Market Share)
- 4.3.4. Dogs (Low Growth, Low Market Share)
- 4.4. Ansoff Matrix Analysis
- 4.5. Supply Chain Analysis
- 4.6. Regulatory Landscape
- 4.7. Current Market Potential and Opportunity Assessment (TAM–SAM–SOM Framework)
- 4.8. NRP Analyst Note
- 4.1. Porters Five Forces
- 5. Market Analysis, Insights and Forecast 2021-2033
- 5.1. Market Analysis, Insights and Forecast - by Industry Type
- 5.1.1. Banking & Financial Services
- 5.1.2. Healthcare
- 5.1.3. Telecommunications
- 5.1.4. Government Agencies
- 5.1.5. Other Industries
- 5.2. Market Analysis, Insights and Forecast - by Startup Stage
- 5.2.1. Seed Stage
- 5.2.2. First Stage
- 5.2.3. Expansion Stage
- 5.2.4. Bridge Stage
- 5.3. Market Analysis, Insights and Forecast - by Major States
- 5.3.1. California
- 5.3.2. New York
- 5.3.3. Massachusettes
- 5.3.4. Washington
- 5.3.5. Others
- 5.4. Market Analysis, Insights and Forecast - by Region
- 5.4.1. North America
- 5.4.2. South America
- 5.4.3. Europe
- 5.4.4. Middle East & Africa
- 5.4.5. Asia Pacific
- 5.1. Market Analysis, Insights and Forecast - by Industry Type
- 6. Global US Venture Capital Market Analysis, Insights and Forecast, 2021-2033
- 6.1. Market Analysis, Insights and Forecast - by Industry Type
- 6.1.1. Banking & Financial Services
- 6.1.2. Healthcare
- 6.1.3. Telecommunications
- 6.1.4. Government Agencies
- 6.1.5. Other Industries
- 6.2. Market Analysis, Insights and Forecast - by Startup Stage
- 6.2.1. Seed Stage
- 6.2.2. First Stage
- 6.2.3. Expansion Stage
- 6.2.4. Bridge Stage
- 6.3. Market Analysis, Insights and Forecast - by Major States
- 6.3.1. California
- 6.3.2. New York
- 6.3.3. Massachusettes
- 6.3.4. Washington
- 6.3.5. Others
- 6.1. Market Analysis, Insights and Forecast - by Industry Type
- 7. North America US Venture Capital Market Analysis, Insights and Forecast, 2020-2032
- 7.1. Market Analysis, Insights and Forecast - by Industry Type
- 7.1.1. Banking & Financial Services
- 7.1.2. Healthcare
- 7.1.3. Telecommunications
- 7.1.4. Government Agencies
- 7.1.5. Other Industries
- 7.2. Market Analysis, Insights and Forecast - by Startup Stage
- 7.2.1. Seed Stage
- 7.2.2. First Stage
- 7.2.3. Expansion Stage
- 7.2.4. Bridge Stage
- 7.3. Market Analysis, Insights and Forecast - by Major States
- 7.3.1. California
- 7.3.2. New York
- 7.3.3. Massachusettes
- 7.3.4. Washington
- 7.3.5. Others
- 7.1. Market Analysis, Insights and Forecast - by Industry Type
- 8. South America US Venture Capital Market Analysis, Insights and Forecast, 2020-2032
- 8.1. Market Analysis, Insights and Forecast - by Industry Type
- 8.1.1. Banking & Financial Services
- 8.1.2. Healthcare
- 8.1.3. Telecommunications
- 8.1.4. Government Agencies
- 8.1.5. Other Industries
- 8.2. Market Analysis, Insights and Forecast - by Startup Stage
- 8.2.1. Seed Stage
- 8.2.2. First Stage
- 8.2.3. Expansion Stage
- 8.2.4. Bridge Stage
- 8.3. Market Analysis, Insights and Forecast - by Major States
- 8.3.1. California
- 8.3.2. New York
- 8.3.3. Massachusettes
- 8.3.4. Washington
- 8.3.5. Others
- 8.1. Market Analysis, Insights and Forecast - by Industry Type
- 9. Europe US Venture Capital Market Analysis, Insights and Forecast, 2020-2032
- 9.1. Market Analysis, Insights and Forecast - by Industry Type
- 9.1.1. Banking & Financial Services
- 9.1.2. Healthcare
- 9.1.3. Telecommunications
- 9.1.4. Government Agencies
- 9.1.5. Other Industries
- 9.2. Market Analysis, Insights and Forecast - by Startup Stage
- 9.2.1. Seed Stage
- 9.2.2. First Stage
- 9.2.3. Expansion Stage
- 9.2.4. Bridge Stage
- 9.3. Market Analysis, Insights and Forecast - by Major States
- 9.3.1. California
- 9.3.2. New York
- 9.3.3. Massachusettes
- 9.3.4. Washington
- 9.3.5. Others
- 9.1. Market Analysis, Insights and Forecast - by Industry Type
- 10. Middle East & Africa US Venture Capital Market Analysis, Insights and Forecast, 2020-2032
- 10.1. Market Analysis, Insights and Forecast - by Industry Type
- 10.1.1. Banking & Financial Services
- 10.1.2. Healthcare
- 10.1.3. Telecommunications
- 10.1.4. Government Agencies
- 10.1.5. Other Industries
- 10.2. Market Analysis, Insights and Forecast - by Startup Stage
- 10.2.1. Seed Stage
- 10.2.2. First Stage
- 10.2.3. Expansion Stage
- 10.2.4. Bridge Stage
- 10.3. Market Analysis, Insights and Forecast - by Major States
- 10.3.1. California
- 10.3.2. New York
- 10.3.3. Massachusettes
- 10.3.4. Washington
- 10.3.5. Others
- 10.1. Market Analysis, Insights and Forecast - by Industry Type
- 11. Asia Pacific US Venture Capital Market Analysis, Insights and Forecast, 2020-2032
- 11.1. Market Analysis, Insights and Forecast - by Industry Type
- 11.1.1. Banking & Financial Services
- 11.1.2. Healthcare
- 11.1.3. Telecommunications
- 11.1.4. Government Agencies
- 11.1.5. Other Industries
- 11.2. Market Analysis, Insights and Forecast - by Startup Stage
- 11.2.1. Seed Stage
- 11.2.2. First Stage
- 11.2.3. Expansion Stage
- 11.2.4. Bridge Stage
- 11.3. Market Analysis, Insights and Forecast - by Major States
- 11.3.1. California
- 11.3.2. New York
- 11.3.3. Massachusettes
- 11.3.4. Washington
- 11.3.5. Others
- 11.1. Market Analysis, Insights and Forecast - by Industry Type
- 12. Competitive Analysis
- 12.1. Company Profiles
- 12.1.1 Intel Capital
- 12.1.1.1. Company Overview
- 12.1.1.2. Products
- 12.1.1.3. Company Financials
- 12.1.1.4. SWOT Analysis
- 12.1.2 Tiger Global Management
- 12.1.2.1. Company Overview
- 12.1.2.2. Products
- 12.1.2.3. Company Financials
- 12.1.2.4. SWOT Analysis
- 12.1.3 Bessemer Venture
- 12.1.3.1. Company Overview
- 12.1.3.2. Products
- 12.1.3.3. Company Financials
- 12.1.3.4. SWOT Analysis
- 12.1.4 Kleiner Perkins
- 12.1.4.1. Company Overview
- 12.1.4.2. Products
- 12.1.4.3. Company Financials
- 12.1.4.4. SWOT Analysis
- 12.1.5 New Enterprise Associates (NEA)
- 12.1.5.1. Company Overview
- 12.1.5.2. Products
- 12.1.5.3. Company Financials
- 12.1.5.4. SWOT Analysis
- 12.1.6 Accel Partners
- 12.1.6.1. Company Overview
- 12.1.6.2. Products
- 12.1.6.3. Company Financials
- 12.1.6.4. SWOT Analysis
- 12.1.7 Sequoia Capital
- 12.1.7.1. Company Overview
- 12.1.7.2. Products
- 12.1.7.3. Company Financials
- 12.1.7.4. SWOT Analysis
- 12.1.8 Khosla Ventures**List Not Exhaustive
- 12.1.8.1. Company Overview
- 12.1.8.2. Products
- 12.1.8.3. Company Financials
- 12.1.8.4. SWOT Analysis
- 12.1.1 Intel Capital
- 12.2. Market Entropy
- 12.2.1 Company's Key Areas Served
- 12.2.2 Recent Developments
- 12.3. Company Market Share Analysis 2025
- 12.3.1 Top 5 Companies Market Share Analysis
- 12.3.2 Top 3 Companies Market Share Analysis
- 12.4. List of Potential Customers
- 13. Research Methodology
List of Figures
- Figure 1: Global US Venture Capital Market Revenue Breakdown (Million, %) by Region 2025 & 2033
- Figure 2: Global US Venture Capital Market Volume Breakdown (Trillion, %) by Region 2025 & 2033
- Figure 3: North America US Venture Capital Market Revenue (Million), by Industry Type 2025 & 2033
- Figure 4: North America US Venture Capital Market Volume (Trillion), by Industry Type 2025 & 2033
- Figure 5: North America US Venture Capital Market Revenue Share (%), by Industry Type 2025 & 2033
- Figure 6: North America US Venture Capital Market Volume Share (%), by Industry Type 2025 & 2033
- Figure 7: North America US Venture Capital Market Revenue (Million), by Startup Stage 2025 & 2033
- Figure 8: North America US Venture Capital Market Volume (Trillion), by Startup Stage 2025 & 2033
- Figure 9: North America US Venture Capital Market Revenue Share (%), by Startup Stage 2025 & 2033
- Figure 10: North America US Venture Capital Market Volume Share (%), by Startup Stage 2025 & 2033
- Figure 11: North America US Venture Capital Market Revenue (Million), by Major States 2025 & 2033
- Figure 12: North America US Venture Capital Market Volume (Trillion), by Major States 2025 & 2033
- Figure 13: North America US Venture Capital Market Revenue Share (%), by Major States 2025 & 2033
- Figure 14: North America US Venture Capital Market Volume Share (%), by Major States 2025 & 2033
- Figure 15: North America US Venture Capital Market Revenue (Million), by Country 2025 & 2033
- Figure 16: North America US Venture Capital Market Volume (Trillion), by Country 2025 & 2033
- Figure 17: North America US Venture Capital Market Revenue Share (%), by Country 2025 & 2033
- Figure 18: North America US Venture Capital Market Volume Share (%), by Country 2025 & 2033
- Figure 19: South America US Venture Capital Market Revenue (Million), by Industry Type 2025 & 2033
- Figure 20: South America US Venture Capital Market Volume (Trillion), by Industry Type 2025 & 2033
- Figure 21: South America US Venture Capital Market Revenue Share (%), by Industry Type 2025 & 2033
- Figure 22: South America US Venture Capital Market Volume Share (%), by Industry Type 2025 & 2033
- Figure 23: South America US Venture Capital Market Revenue (Million), by Startup Stage 2025 & 2033
- Figure 24: South America US Venture Capital Market Volume (Trillion), by Startup Stage 2025 & 2033
- Figure 25: South America US Venture Capital Market Revenue Share (%), by Startup Stage 2025 & 2033
- Figure 26: South America US Venture Capital Market Volume Share (%), by Startup Stage 2025 & 2033
- Figure 27: South America US Venture Capital Market Revenue (Million), by Major States 2025 & 2033
- Figure 28: South America US Venture Capital Market Volume (Trillion), by Major States 2025 & 2033
- Figure 29: South America US Venture Capital Market Revenue Share (%), by Major States 2025 & 2033
- Figure 30: South America US Venture Capital Market Volume Share (%), by Major States 2025 & 2033
- Figure 31: South America US Venture Capital Market Revenue (Million), by Country 2025 & 2033
- Figure 32: South America US Venture Capital Market Volume (Trillion), by Country 2025 & 2033
- Figure 33: South America US Venture Capital Market Revenue Share (%), by Country 2025 & 2033
- Figure 34: South America US Venture Capital Market Volume Share (%), by Country 2025 & 2033
- Figure 35: Europe US Venture Capital Market Revenue (Million), by Industry Type 2025 & 2033
- Figure 36: Europe US Venture Capital Market Volume (Trillion), by Industry Type 2025 & 2033
- Figure 37: Europe US Venture Capital Market Revenue Share (%), by Industry Type 2025 & 2033
- Figure 38: Europe US Venture Capital Market Volume Share (%), by Industry Type 2025 & 2033
- Figure 39: Europe US Venture Capital Market Revenue (Million), by Startup Stage 2025 & 2033
- Figure 40: Europe US Venture Capital Market Volume (Trillion), by Startup Stage 2025 & 2033
- Figure 41: Europe US Venture Capital Market Revenue Share (%), by Startup Stage 2025 & 2033
- Figure 42: Europe US Venture Capital Market Volume Share (%), by Startup Stage 2025 & 2033
- Figure 43: Europe US Venture Capital Market Revenue (Million), by Major States 2025 & 2033
- Figure 44: Europe US Venture Capital Market Volume (Trillion), by Major States 2025 & 2033
- Figure 45: Europe US Venture Capital Market Revenue Share (%), by Major States 2025 & 2033
- Figure 46: Europe US Venture Capital Market Volume Share (%), by Major States 2025 & 2033
- Figure 47: Europe US Venture Capital Market Revenue (Million), by Country 2025 & 2033
- Figure 48: Europe US Venture Capital Market Volume (Trillion), by Country 2025 & 2033
- Figure 49: Europe US Venture Capital Market Revenue Share (%), by Country 2025 & 2033
- Figure 50: Europe US Venture Capital Market Volume Share (%), by Country 2025 & 2033
- Figure 51: Middle East & Africa US Venture Capital Market Revenue (Million), by Industry Type 2025 & 2033
- Figure 52: Middle East & Africa US Venture Capital Market Volume (Trillion), by Industry Type 2025 & 2033
- Figure 53: Middle East & Africa US Venture Capital Market Revenue Share (%), by Industry Type 2025 & 2033
- Figure 54: Middle East & Africa US Venture Capital Market Volume Share (%), by Industry Type 2025 & 2033
- Figure 55: Middle East & Africa US Venture Capital Market Revenue (Million), by Startup Stage 2025 & 2033
- Figure 56: Middle East & Africa US Venture Capital Market Volume (Trillion), by Startup Stage 2025 & 2033
- Figure 57: Middle East & Africa US Venture Capital Market Revenue Share (%), by Startup Stage 2025 & 2033
- Figure 58: Middle East & Africa US Venture Capital Market Volume Share (%), by Startup Stage 2025 & 2033
- Figure 59: Middle East & Africa US Venture Capital Market Revenue (Million), by Major States 2025 & 2033
- Figure 60: Middle East & Africa US Venture Capital Market Volume (Trillion), by Major States 2025 & 2033
- Figure 61: Middle East & Africa US Venture Capital Market Revenue Share (%), by Major States 2025 & 2033
- Figure 62: Middle East & Africa US Venture Capital Market Volume Share (%), by Major States 2025 & 2033
- Figure 63: Middle East & Africa US Venture Capital Market Revenue (Million), by Country 2025 & 2033
- Figure 64: Middle East & Africa US Venture Capital Market Volume (Trillion), by Country 2025 & 2033
- Figure 65: Middle East & Africa US Venture Capital Market Revenue Share (%), by Country 2025 & 2033
- Figure 66: Middle East & Africa US Venture Capital Market Volume Share (%), by Country 2025 & 2033
- Figure 67: Asia Pacific US Venture Capital Market Revenue (Million), by Industry Type 2025 & 2033
- Figure 68: Asia Pacific US Venture Capital Market Volume (Trillion), by Industry Type 2025 & 2033
- Figure 69: Asia Pacific US Venture Capital Market Revenue Share (%), by Industry Type 2025 & 2033
- Figure 70: Asia Pacific US Venture Capital Market Volume Share (%), by Industry Type 2025 & 2033
- Figure 71: Asia Pacific US Venture Capital Market Revenue (Million), by Startup Stage 2025 & 2033
- Figure 72: Asia Pacific US Venture Capital Market Volume (Trillion), by Startup Stage 2025 & 2033
- Figure 73: Asia Pacific US Venture Capital Market Revenue Share (%), by Startup Stage 2025 & 2033
- Figure 74: Asia Pacific US Venture Capital Market Volume Share (%), by Startup Stage 2025 & 2033
- Figure 75: Asia Pacific US Venture Capital Market Revenue (Million), by Major States 2025 & 2033
- Figure 76: Asia Pacific US Venture Capital Market Volume (Trillion), by Major States 2025 & 2033
- Figure 77: Asia Pacific US Venture Capital Market Revenue Share (%), by Major States 2025 & 2033
- Figure 78: Asia Pacific US Venture Capital Market Volume Share (%), by Major States 2025 & 2033
- Figure 79: Asia Pacific US Venture Capital Market Revenue (Million), by Country 2025 & 2033
- Figure 80: Asia Pacific US Venture Capital Market Volume (Trillion), by Country 2025 & 2033
- Figure 81: Asia Pacific US Venture Capital Market Revenue Share (%), by Country 2025 & 2033
- Figure 82: Asia Pacific US Venture Capital Market Volume Share (%), by Country 2025 & 2033
List of Tables
- Table 1: Global US Venture Capital Market Revenue Million Forecast, by Industry Type 2020 & 2033
- Table 2: Global US Venture Capital Market Volume Trillion Forecast, by Industry Type 2020 & 2033
- Table 3: Global US Venture Capital Market Revenue Million Forecast, by Startup Stage 2020 & 2033
- Table 4: Global US Venture Capital Market Volume Trillion Forecast, by Startup Stage 2020 & 2033
- Table 5: Global US Venture Capital Market Revenue Million Forecast, by Major States 2020 & 2033
- Table 6: Global US Venture Capital Market Volume Trillion Forecast, by Major States 2020 & 2033
- Table 7: Global US Venture Capital Market Revenue Million Forecast, by Region 2020 & 2033
- Table 8: Global US Venture Capital Market Volume Trillion Forecast, by Region 2020 & 2033
- Table 9: Global US Venture Capital Market Revenue Million Forecast, by Industry Type 2020 & 2033
- Table 10: Global US Venture Capital Market Volume Trillion Forecast, by Industry Type 2020 & 2033
- Table 11: Global US Venture Capital Market Revenue Million Forecast, by Startup Stage 2020 & 2033
- Table 12: Global US Venture Capital Market Volume Trillion Forecast, by Startup Stage 2020 & 2033
- Table 13: Global US Venture Capital Market Revenue Million Forecast, by Major States 2020 & 2033
- Table 14: Global US Venture Capital Market Volume Trillion Forecast, by Major States 2020 & 2033
- Table 15: Global US Venture Capital Market Revenue Million Forecast, by Country 2020 & 2033
- Table 16: Global US Venture Capital Market Volume Trillion Forecast, by Country 2020 & 2033
- Table 17: United States US Venture Capital Market Revenue (Million) Forecast, by Application 2020 & 2033
- Table 18: United States US Venture Capital Market Volume (Trillion) Forecast, by Application 2020 & 2033
- Table 19: Canada US Venture Capital Market Revenue (Million) Forecast, by Application 2020 & 2033
- Table 20: Canada US Venture Capital Market Volume (Trillion) Forecast, by Application 2020 & 2033
- Table 21: Mexico US Venture Capital Market Revenue (Million) Forecast, by Application 2020 & 2033
- Table 22: Mexico US Venture Capital Market Volume (Trillion) Forecast, by Application 2020 & 2033
- Table 23: Global US Venture Capital Market Revenue Million Forecast, by Industry Type 2020 & 2033
- Table 24: Global US Venture Capital Market Volume Trillion Forecast, by Industry Type 2020 & 2033
- Table 25: Global US Venture Capital Market Revenue Million Forecast, by Startup Stage 2020 & 2033
- Table 26: Global US Venture Capital Market Volume Trillion Forecast, by Startup Stage 2020 & 2033
- Table 27: Global US Venture Capital Market Revenue Million Forecast, by Major States 2020 & 2033
- Table 28: Global US Venture Capital Market Volume Trillion Forecast, by Major States 2020 & 2033
- Table 29: Global US Venture Capital Market Revenue Million Forecast, by Country 2020 & 2033
- Table 30: Global US Venture Capital Market Volume Trillion Forecast, by Country 2020 & 2033
- Table 31: Brazil US Venture Capital Market Revenue (Million) Forecast, by Application 2020 & 2033
- Table 32: Brazil US Venture Capital Market Volume (Trillion) Forecast, by Application 2020 & 2033
- Table 33: Argentina US Venture Capital Market Revenue (Million) Forecast, by Application 2020 & 2033
- Table 34: Argentina US Venture Capital Market Volume (Trillion) Forecast, by Application 2020 & 2033
- Table 35: Rest of South America US Venture Capital Market Revenue (Million) Forecast, by Application 2020 & 2033
- Table 36: Rest of South America US Venture Capital Market Volume (Trillion) Forecast, by Application 2020 & 2033
- Table 37: Global US Venture Capital Market Revenue Million Forecast, by Industry Type 2020 & 2033
- Table 38: Global US Venture Capital Market Volume Trillion Forecast, by Industry Type 2020 & 2033
- Table 39: Global US Venture Capital Market Revenue Million Forecast, by Startup Stage 2020 & 2033
- Table 40: Global US Venture Capital Market Volume Trillion Forecast, by Startup Stage 2020 & 2033
- Table 41: Global US Venture Capital Market Revenue Million Forecast, by Major States 2020 & 2033
- Table 42: Global US Venture Capital Market Volume Trillion Forecast, by Major States 2020 & 2033
- Table 43: Global US Venture Capital Market Revenue Million Forecast, by Country 2020 & 2033
- Table 44: Global US Venture Capital Market Volume Trillion Forecast, by Country 2020 & 2033
- Table 45: United Kingdom US Venture Capital Market Revenue (Million) Forecast, by Application 2020 & 2033
- Table 46: United Kingdom US Venture Capital Market Volume (Trillion) Forecast, by Application 2020 & 2033
- Table 47: Germany US Venture Capital Market Revenue (Million) Forecast, by Application 2020 & 2033
- Table 48: Germany US Venture Capital Market Volume (Trillion) Forecast, by Application 2020 & 2033
- Table 49: France US Venture Capital Market Revenue (Million) Forecast, by Application 2020 & 2033
- Table 50: France US Venture Capital Market Volume (Trillion) Forecast, by Application 2020 & 2033
- Table 51: Italy US Venture Capital Market Revenue (Million) Forecast, by Application 2020 & 2033
- Table 52: Italy US Venture Capital Market Volume (Trillion) Forecast, by Application 2020 & 2033
- Table 53: Spain US Venture Capital Market Revenue (Million) Forecast, by Application 2020 & 2033
- Table 54: Spain US Venture Capital Market Volume (Trillion) Forecast, by Application 2020 & 2033
- Table 55: Russia US Venture Capital Market Revenue (Million) Forecast, by Application 2020 & 2033
- Table 56: Russia US Venture Capital Market Volume (Trillion) Forecast, by Application 2020 & 2033
- Table 57: Benelux US Venture Capital Market Revenue (Million) Forecast, by Application 2020 & 2033
- Table 58: Benelux US Venture Capital Market Volume (Trillion) Forecast, by Application 2020 & 2033
- Table 59: Nordics US Venture Capital Market Revenue (Million) Forecast, by Application 2020 & 2033
- Table 60: Nordics US Venture Capital Market Volume (Trillion) Forecast, by Application 2020 & 2033
- Table 61: Rest of Europe US Venture Capital Market Revenue (Million) Forecast, by Application 2020 & 2033
- Table 62: Rest of Europe US Venture Capital Market Volume (Trillion) Forecast, by Application 2020 & 2033
- Table 63: Global US Venture Capital Market Revenue Million Forecast, by Industry Type 2020 & 2033
- Table 64: Global US Venture Capital Market Volume Trillion Forecast, by Industry Type 2020 & 2033
- Table 65: Global US Venture Capital Market Revenue Million Forecast, by Startup Stage 2020 & 2033
- Table 66: Global US Venture Capital Market Volume Trillion Forecast, by Startup Stage 2020 & 2033
- Table 67: Global US Venture Capital Market Revenue Million Forecast, by Major States 2020 & 2033
- Table 68: Global US Venture Capital Market Volume Trillion Forecast, by Major States 2020 & 2033
- Table 69: Global US Venture Capital Market Revenue Million Forecast, by Country 2020 & 2033
- Table 70: Global US Venture Capital Market Volume Trillion Forecast, by Country 2020 & 2033
- Table 71: Turkey US Venture Capital Market Revenue (Million) Forecast, by Application 2020 & 2033
- Table 72: Turkey US Venture Capital Market Volume (Trillion) Forecast, by Application 2020 & 2033
- Table 73: Israel US Venture Capital Market Revenue (Million) Forecast, by Application 2020 & 2033
- Table 74: Israel US Venture Capital Market Volume (Trillion) Forecast, by Application 2020 & 2033
- Table 75: GCC US Venture Capital Market Revenue (Million) Forecast, by Application 2020 & 2033
- Table 76: GCC US Venture Capital Market Volume (Trillion) Forecast, by Application 2020 & 2033
- Table 77: North Africa US Venture Capital Market Revenue (Million) Forecast, by Application 2020 & 2033
- Table 78: North Africa US Venture Capital Market Volume (Trillion) Forecast, by Application 2020 & 2033
- Table 79: South Africa US Venture Capital Market Revenue (Million) Forecast, by Application 2020 & 2033
- Table 80: South Africa US Venture Capital Market Volume (Trillion) Forecast, by Application 2020 & 2033
- Table 81: Rest of Middle East & Africa US Venture Capital Market Revenue (Million) Forecast, by Application 2020 & 2033
- Table 82: Rest of Middle East & Africa US Venture Capital Market Volume (Trillion) Forecast, by Application 2020 & 2033
- Table 83: Global US Venture Capital Market Revenue Million Forecast, by Industry Type 2020 & 2033
- Table 84: Global US Venture Capital Market Volume Trillion Forecast, by Industry Type 2020 & 2033
- Table 85: Global US Venture Capital Market Revenue Million Forecast, by Startup Stage 2020 & 2033
- Table 86: Global US Venture Capital Market Volume Trillion Forecast, by Startup Stage 2020 & 2033
- Table 87: Global US Venture Capital Market Revenue Million Forecast, by Major States 2020 & 2033
- Table 88: Global US Venture Capital Market Volume Trillion Forecast, by Major States 2020 & 2033
- Table 89: Global US Venture Capital Market Revenue Million Forecast, by Country 2020 & 2033
- Table 90: Global US Venture Capital Market Volume Trillion Forecast, by Country 2020 & 2033
- Table 91: China US Venture Capital Market Revenue (Million) Forecast, by Application 2020 & 2033
- Table 92: China US Venture Capital Market Volume (Trillion) Forecast, by Application 2020 & 2033
- Table 93: India US Venture Capital Market Revenue (Million) Forecast, by Application 2020 & 2033
- Table 94: India US Venture Capital Market Volume (Trillion) Forecast, by Application 2020 & 2033
- Table 95: Japan US Venture Capital Market Revenue (Million) Forecast, by Application 2020 & 2033
- Table 96: Japan US Venture Capital Market Volume (Trillion) Forecast, by Application 2020 & 2033
- Table 97: South Korea US Venture Capital Market Revenue (Million) Forecast, by Application 2020 & 2033
- Table 98: South Korea US Venture Capital Market Volume (Trillion) Forecast, by Application 2020 & 2033
- Table 99: ASEAN US Venture Capital Market Revenue (Million) Forecast, by Application 2020 & 2033
- Table 100: ASEAN US Venture Capital Market Volume (Trillion) Forecast, by Application 2020 & 2033
- Table 101: Oceania US Venture Capital Market Revenue (Million) Forecast, by Application 2020 & 2033
- Table 102: Oceania US Venture Capital Market Volume (Trillion) Forecast, by Application 2020 & 2033
- Table 103: Rest of Asia Pacific US Venture Capital Market Revenue (Million) Forecast, by Application 2020 & 2033
- Table 104: Rest of Asia Pacific US Venture Capital Market Volume (Trillion) Forecast, by Application 2020 & 2033
Frequently Asked Questions
1. What is the projected Compound Annual Growth Rate (CAGR) of the US Venture Capital Market?
The projected CAGR is approximately 8.25%.
2. Which companies are prominent players in the US Venture Capital Market?
Key companies in the market include Intel Capital, Tiger Global Management, Bessemer Venture, Kleiner Perkins, New Enterprise Associates (NEA), Accel Partners, Sequoia Capital, Khosla Ventures**List Not Exhaustive.
3. What are the main segments of the US Venture Capital Market?
The market segments include Industry Type , Startup Stage , Major States .
4. Can you provide details about the market size?
The market size is estimated to be USD 1.30 Million as of 2022.
5. What are some drivers contributing to market growth?
N/A
6. What are the notable trends driving market growth?
Healthtech trends toward record-breaking year.
7. Are there any restraints impacting market growth?
N/A
8. Can you provide examples of recent developments in the market?
January 2023: NEA (New Enterprise Associates) announced it closed on approximately USD 6.2 billion across two funds, bringing the firm's assets under management to over USD 25 billion as of December 31, 2022. The new pair of funds marks a first for NEA, with one dedicated to early-stage investing and the other to venture growth-stage opportunities. It reflects the 45-year-old firm's continuous evolution of its model over decades.
9. What pricing options are available for accessing the report?
Pricing options include single-user, multi-user, and enterprise licenses priced at USD 3800, USD 4500, and USD 5800 respectively.
10. Is the market size provided in terms of value or volume?
The market size is provided in terms of value, measured in Million and volume, measured in Trillion.
11. Are there any specific market keywords associated with the report?
Yes, the market keyword associated with the report is "US Venture Capital Market," which aids in identifying and referencing the specific market segment covered.
12. How do I determine which pricing option suits my needs best?
The pricing options vary based on user requirements and access needs. Individual users may opt for single-user licenses, while businesses requiring broader access may choose multi-user or enterprise licenses for cost-effective access to the report.
13. Are there any additional resources or data provided in the US Venture Capital Market report?
While the report offers comprehensive insights, it's advisable to review the specific contents or supplementary materials provided to ascertain if additional resources or data are available.
14. How can I stay updated on further developments or reports in the US Venture Capital Market?
To stay informed about further developments, trends, and reports in the US Venture Capital Market, consider subscribing to industry newsletters, following relevant companies and organizations, or regularly checking reputable industry news sources and publications.
Methodology
Step 1 - Identification of Relevant Samples Size from Population Database


Step 2 - Approaches for Defining Global Market Size (Value, Volume* & Price*)

Note*: In applicable scenarios
Step 3 - Data Sources
Primary Research
- Web Analytics
- Survey Reports
- Research Institute
- Latest Research Reports
- Opinion Leaders
Secondary Research
- Annual Reports
- White Paper
- Latest Press Release
- Industry Association
- Paid Database
- Investor Presentations

Step 4 - Data Triangulation
Involves using different sources of information in order to increase the validity of a study
These sources are likely to be stakeholders in a program - participants, other researchers, program staff, other community members, and so on.
Then we put all data in single framework & apply various statistical tools to find out the dynamic on the market.
During the analysis stage, feedback from the stakeholder groups would be compared to determine areas of agreement as well as areas of divergence