

Key Insights
The Androgen Deprivation Therapy (ADT) market is forecast to reach $8.31 billion by 2025, with a projected compound annual growth rate (CAGR) of 6% between 2025 and 2033. This growth is driven by the increasing incidence of prostate cancer, advancements in therapeutic development leading to more effective treatments, and enhanced diagnostic capabilities facilitating earlier intervention. The market is segmented by treatment type, route of administration, and geography, with North America and Europe currently dominating due to robust healthcare infrastructure and expenditure. Key players are actively innovating in ADT therapies, though challenges such as drug resistance, side effects, and treatment costs may impact accessibility.
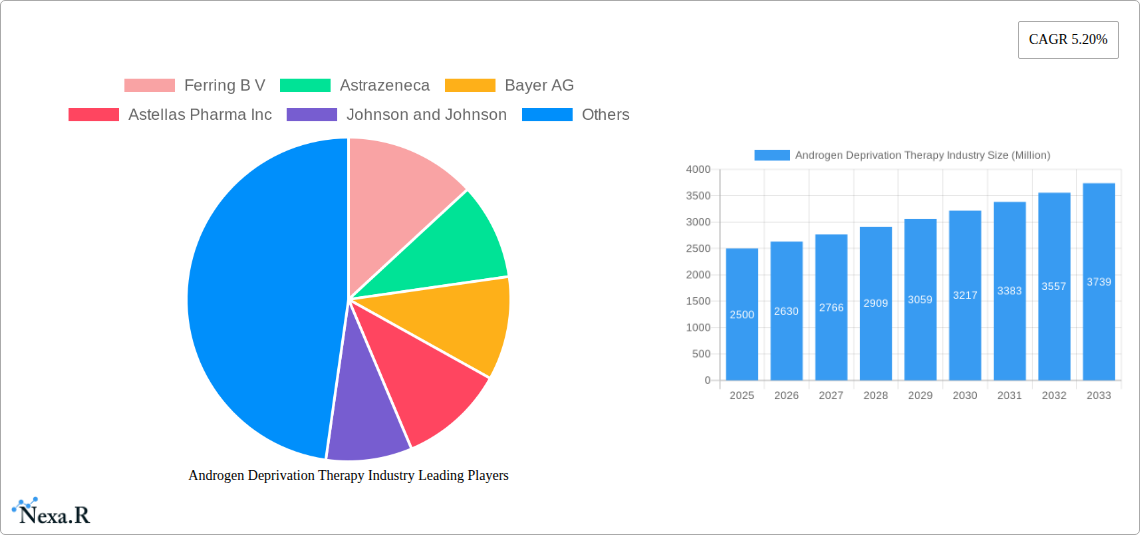
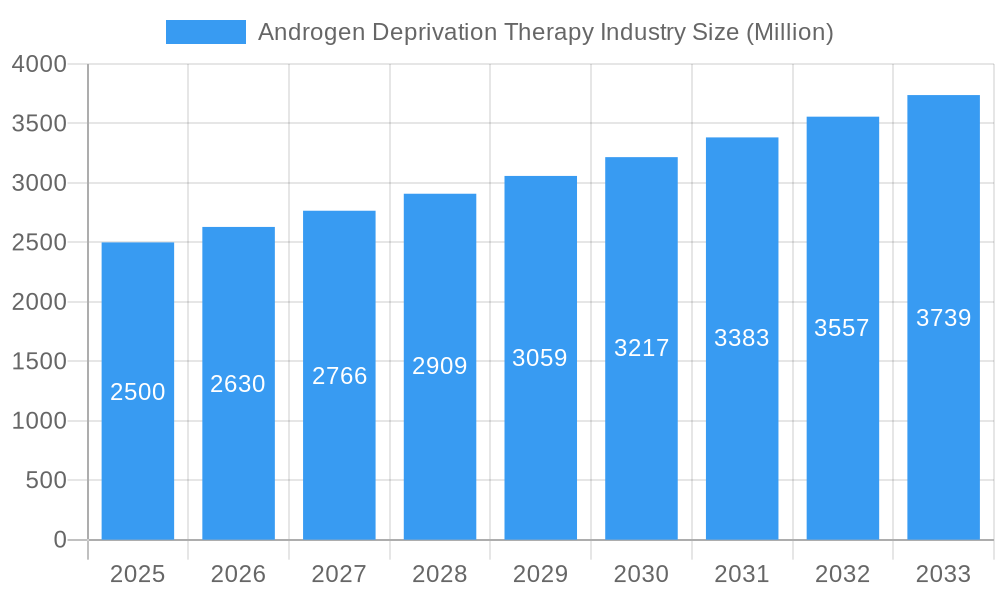
Androgen Deprivation Therapy Industry Market Size (In Billion)
The ADT market outlook remains positive, supported by a pipeline of therapies focused on improved efficacy and reduced side effects. Emerging markets and personalized medicine approaches are expected to further stimulate growth. Ongoing research and development, coupled with the rising prevalence of prostate cancer, indicate sustained market expansion throughout the forecast period. Future growth will be shaped by the success of new therapies, evolving healthcare policies, and updated treatment guidelines.
Androgen Deprivation Therapy Industry Company Market Share
This report offers a comprehensive analysis of the Androgen Deprivation Therapy (ADT) market dynamics, growth trajectories, key segments, and major participants. The study spans from 2019 to 2033, with 2025 designated as the base year for the forecast period ending in 2033. This granular market segmentation, including treatment, drug class, surgery, and route of administration, provides critical insights for stakeholders. The ADT market falls under the broader Oncology sector, specifically within Prostate Cancer Treatment.
Androgen Deprivation Therapy Industry Market Dynamics & Structure
The Androgen Deprivation Therapy (ADT) market is characterized by a moderately concentrated landscape with several multinational pharmaceutical companies holding significant market share. The market size in 2025 is estimated at $XX Billion. Technological innovation, particularly in the development of novel drug classes and targeted therapies, is a key driver. Stringent regulatory frameworks, including those governing clinical trials and drug approvals, significantly influence market dynamics. Competitive pressures from existing and emerging therapies, including those targeting different pathways in hormone-sensitive cancers, add complexity. The increasing prevalence of prostate and other hormone-dependent cancers fuels market growth. M&A activity in the sector remains steady, with approximately XX deals recorded in the historical period (2019-2024).
- Market Concentration: Moderately concentrated, with top 5 players holding approximately XX% market share in 2025.
- Technological Innovation: Focus on targeted therapies, improved drug delivery systems, and combination treatments.
- Regulatory Frameworks: Stringent approval processes influence timelines and market entry.
- Competitive Substitutes: Emerging therapies and alternative treatment approaches create competition.
- End-User Demographics: Primarily driven by an aging population and increasing prevalence of prostate cancer.
- M&A Trends: Consolidation and expansion through strategic acquisitions observed in the historical period.
Androgen Deprivation Therapy Industry Growth Trends & Insights
The ADT market exhibits robust growth, driven by rising cancer incidence rates and expanding treatment options. The historical period (2019-2024) showed a CAGR of XX%, while the forecast period (2025-2033) is projected to exhibit a CAGR of XX%. This growth is fueled by increased awareness and early detection of hormone-sensitive cancers, alongside advancements in drug delivery mechanisms and combination therapies. Technological disruptions, such as the development of novel AR inhibitors and improved delivery systems, accelerate market expansion. Changes in consumer behavior, driven by an increased preference for minimally invasive procedures and improved patient outcomes, further contribute to growth. Market penetration is expected to increase from XX% in 2025 to XX% in 2033.
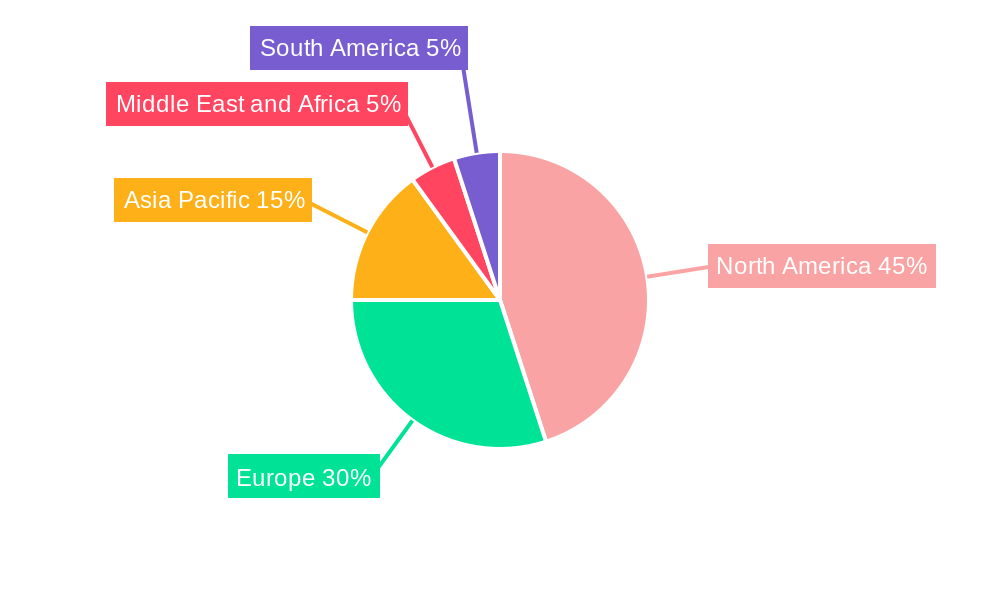
Dominant Regions, Countries, or Segments in Androgen Deprivation Therapy Industry
North America currently dominates the ADT market, followed by Europe. This dominance stems from factors such as high healthcare expenditure, advanced healthcare infrastructure, and strong regulatory frameworks. Within the segment breakdown:
- By Treatment: Hormone therapy remains the dominant treatment modality.
- By Drug Class: Antiandrogens constitute the largest drug class segment.
- By Surgery: Surgical castration maintains a significant market share, although its use is declining in favor of medical castration.
- By Route of Administration: Injectable formulations currently hold a larger market share than oral, but oral formulations are gaining traction due to improved patient convenience and compliance.
Key drivers for regional dominance include:
- North America: High healthcare expenditure, advanced medical infrastructure, and high prevalence of prostate cancer.
- Europe: Well-established healthcare systems, robust regulatory frameworks, and increasing adoption of advanced therapies.
- Asia-Pacific: Rapidly growing economies, rising healthcare spending, and increased awareness of prostate cancer are driving growth, although market penetration remains lower than in North America and Europe.
Androgen Deprivation Therapy Industry Product Landscape
The ADT product landscape encompasses a diverse range of therapies, including hormonal agents, antiandrogens, and surgical interventions. Recent innovations include the development of next-generation androgen receptor inhibitors with improved efficacy and reduced side effects. These newer agents offer superior targeting and minimized off-target effects compared to earlier generations. Companies are focusing on improving drug delivery systems to enhance patient convenience and adherence.
Key Drivers, Barriers & Challenges in Androgen Deprivation Therapy Industry
Key Drivers:
- Rising prevalence of prostate and other hormone-dependent cancers.
- Technological advancements leading to improved efficacy and safety profiles of ADT.
- Growing awareness and early detection initiatives.
Key Challenges:
- Development of drug resistance: The emergence of castration-resistant prostate cancer (CRPC) remains a major hurdle.
- Adverse side effects: ADT is associated with various side effects, limiting patient compliance.
- High cost of treatment: The cost of newer therapies can be prohibitive for some patients.
Emerging Opportunities in Androgen Deprivation Therapy Industry
- Development of novel combination therapies to improve treatment outcomes and overcome drug resistance.
- Expansion into emerging markets with high unmet needs and growing healthcare expenditure.
- Personalized medicine approaches to tailor ADT to individual patient characteristics.
Growth Accelerators in the Androgen Deprivation Therapy Industry Industry
Continued technological advancements, such as improved drug delivery systems and the development of novel drug combinations, are major growth catalysts. Strategic partnerships between pharmaceutical companies and research institutions are also driving innovation. Expansion into underserved markets and the development of personalized treatment strategies will further accelerate market growth.
Key Players Shaping the Androgen Deprivation Therapy Industry Market
- Ferring B V
- AstraZeneca
- Bayer AG
- Astellas Pharma Inc
- Johnson and Johnson
- Foresee Pharmaceuticals Co Ltd
- Myovant Sciences GmbH
- Viatris
- Verity Pharmaceuticals Inc
- AbbVie Inc
- Bristol-Myers Squibb Company
- Tolmar Pharmaceuticals Inc
Notable Milestones in Androgen Deprivation Therapy Industry Sector
- March 2023: The European Commission approved Nubeqa (darolutamide), an oral androgen receptor inhibitor (ARi), plus androgen deprivation therapy (ADT) in combination with docetaxel, for the treatment of patients with metastatic hormone-sensitive prostate cancer (mHSPC). This approval significantly expands treatment options and is expected to boost market growth.
- March 2023: OliX Pharmaceuticals, Inc. announced the initiation of a Phase 1 clinical trial for OLX72021, a potential treatment for androgenic alopecia. While not directly related to cancer treatment, this signifies the potential expansion of AR-targeting therapies into non-oncology applications.
In-Depth Androgen Deprivation Therapy Industry Market Outlook
The Androgen Deprivation Therapy market is poised for significant growth in the coming years, driven by a confluence of factors including the rising prevalence of hormone-sensitive cancers, technological advancements resulting in novel and more effective therapies, and ongoing research into overcoming drug resistance. Strategic partnerships, investments in R&D, and the exploration of personalized medicine approaches will continue to shape the market landscape. The market’s future potential is substantial, presenting numerous strategic opportunities for existing and emerging players.
Androgen Deprivation Therapy Industry Segmentation
-
1. Treatment
-
1.1. By Drug Class
- 1.1.1. Luteiniz
- 1.1.2. Antiandrogens
- 1.2. By Surgery
-
1.1. By Drug Class
-
2. Route of Administration
- 2.1. Injectable
- 2.2. Oral
Androgen Deprivation Therapy Industry Segmentation By Geography
-
1. North America
- 1.1. United States
- 1.2. Canada
- 1.3. Mexico
-
2. Europe
- 2.1. Germany
- 2.2. United Kingdom
- 2.3. France
- 2.4. Italy
- 2.5. Spain
- 2.6. Rest of Europe
-
3. Asia Pacific
- 3.1. China
- 3.2. Japan
- 3.3. India
- 3.4. Australia
- 3.5. South Korea
- 3.6. Rest of Asia Pacific
-
4. Middle East and Africa
- 4.1. GCC
- 4.2. South Africa
- 4.3. Rest of Middle East and Africa
-
5. South America
- 5.1. Brazil
- 5.2. Argentina
- 5.3. Rest of South America
Androgen Deprivation Therapy Industry Regional Market Share
Geographic Coverage of Androgen Deprivation Therapy Industry
Androgen Deprivation Therapy Industry REPORT HIGHLIGHTS
| Aspects | Details |
|---|---|
| Study Period | 2020-2034 |
| Base Year | 2025 |
| Estimated Year | 2026 |
| Forecast Period | 2026-2034 |
| Historical Period | 2020-2025 |
| Growth Rate | CAGR of 6% from 2020-2034 |
| Segmentation |
|
Table of Contents
- 1. Introduction
- 1.1. Research Scope
- 1.2. Market Segmentation
- 1.3. Research Methodology
- 1.4. Definitions and Assumptions
- 2. Executive Summary
- 2.1. Introduction
- 3. Market Dynamics
- 3.1. Introduction
- 3.2. Market Drivers
- 3.2.1. Rising Burden of Prostrate Cancer; Rising Research and Development Activities
- 3.3. Market Restrains
- 3.3.1. Poor Reimbursement and Increasing Side Effects
- 3.4. Market Trends
- 3.4.1. Antiandrogen Sub Segment Within Drug Class Segment is Expected to Witness a Strong Growth Over the Forecast Period
- 4. Market Factor Analysis
- 4.1. Porters Five Forces
- 4.2. Supply/Value Chain
- 4.3. PESTEL analysis
- 4.4. Market Entropy
- 4.5. Patent/Trademark Analysis
- 5. Global Androgen Deprivation Therapy Industry Analysis, Insights and Forecast, 2020-2032
- 5.1. Market Analysis, Insights and Forecast - by Treatment
- 5.1.1. By Drug Class
- 5.1.1.1. Luteiniz
- 5.1.1.2. Antiandrogens
- 5.1.2. By Surgery
- 5.1.1. By Drug Class
- 5.2. Market Analysis, Insights and Forecast - by Route of Administration
- 5.2.1. Injectable
- 5.2.2. Oral
- 5.3. Market Analysis, Insights and Forecast - by Region
- 5.3.1. North America
- 5.3.2. Europe
- 5.3.3. Asia Pacific
- 5.3.4. Middle East and Africa
- 5.3.5. South America
- 5.1. Market Analysis, Insights and Forecast - by Treatment
- 6. North America Androgen Deprivation Therapy Industry Analysis, Insights and Forecast, 2020-2032
- 6.1. Market Analysis, Insights and Forecast - by Treatment
- 6.1.1. By Drug Class
- 6.1.1.1. Luteiniz
- 6.1.1.2. Antiandrogens
- 6.1.2. By Surgery
- 6.1.1. By Drug Class
- 6.2. Market Analysis, Insights and Forecast - by Route of Administration
- 6.2.1. Injectable
- 6.2.2. Oral
- 6.1. Market Analysis, Insights and Forecast - by Treatment
- 7. Europe Androgen Deprivation Therapy Industry Analysis, Insights and Forecast, 2020-2032
- 7.1. Market Analysis, Insights and Forecast - by Treatment
- 7.1.1. By Drug Class
- 7.1.1.1. Luteiniz
- 7.1.1.2. Antiandrogens
- 7.1.2. By Surgery
- 7.1.1. By Drug Class
- 7.2. Market Analysis, Insights and Forecast - by Route of Administration
- 7.2.1. Injectable
- 7.2.2. Oral
- 7.1. Market Analysis, Insights and Forecast - by Treatment
- 8. Asia Pacific Androgen Deprivation Therapy Industry Analysis, Insights and Forecast, 2020-2032
- 8.1. Market Analysis, Insights and Forecast - by Treatment
- 8.1.1. By Drug Class
- 8.1.1.1. Luteiniz
- 8.1.1.2. Antiandrogens
- 8.1.2. By Surgery
- 8.1.1. By Drug Class
- 8.2. Market Analysis, Insights and Forecast - by Route of Administration
- 8.2.1. Injectable
- 8.2.2. Oral
- 8.1. Market Analysis, Insights and Forecast - by Treatment
- 9. Middle East and Africa Androgen Deprivation Therapy Industry Analysis, Insights and Forecast, 2020-2032
- 9.1. Market Analysis, Insights and Forecast - by Treatment
- 9.1.1. By Drug Class
- 9.1.1.1. Luteiniz
- 9.1.1.2. Antiandrogens
- 9.1.2. By Surgery
- 9.1.1. By Drug Class
- 9.2. Market Analysis, Insights and Forecast - by Route of Administration
- 9.2.1. Injectable
- 9.2.2. Oral
- 9.1. Market Analysis, Insights and Forecast - by Treatment
- 10. South America Androgen Deprivation Therapy Industry Analysis, Insights and Forecast, 2020-2032
- 10.1. Market Analysis, Insights and Forecast - by Treatment
- 10.1.1. By Drug Class
- 10.1.1.1. Luteiniz
- 10.1.1.2. Antiandrogens
- 10.1.2. By Surgery
- 10.1.1. By Drug Class
- 10.2. Market Analysis, Insights and Forecast - by Route of Administration
- 10.2.1. Injectable
- 10.2.2. Oral
- 10.1. Market Analysis, Insights and Forecast - by Treatment
- 11. Competitive Analysis
- 11.1. Global Market Share Analysis 2025
- 11.2. Company Profiles
- 11.2.1 Ferring B V
- 11.2.1.1. Overview
- 11.2.1.2. Products
- 11.2.1.3. SWOT Analysis
- 11.2.1.4. Recent Developments
- 11.2.1.5. Financials (Based on Availability)
- 11.2.2 Astrazeneca
- 11.2.2.1. Overview
- 11.2.2.2. Products
- 11.2.2.3. SWOT Analysis
- 11.2.2.4. Recent Developments
- 11.2.2.5. Financials (Based on Availability)
- 11.2.3 Bayer AG
- 11.2.3.1. Overview
- 11.2.3.2. Products
- 11.2.3.3. SWOT Analysis
- 11.2.3.4. Recent Developments
- 11.2.3.5. Financials (Based on Availability)
- 11.2.4 Astellas Pharma Inc
- 11.2.4.1. Overview
- 11.2.4.2. Products
- 11.2.4.3. SWOT Analysis
- 11.2.4.4. Recent Developments
- 11.2.4.5. Financials (Based on Availability)
- 11.2.5 Johnson and Johnson
- 11.2.5.1. Overview
- 11.2.5.2. Products
- 11.2.5.3. SWOT Analysis
- 11.2.5.4. Recent Developments
- 11.2.5.5. Financials (Based on Availability)
- 11.2.6 Foresee Pharmaceuticals Co Ltd
- 11.2.6.1. Overview
- 11.2.6.2. Products
- 11.2.6.3. SWOT Analysis
- 11.2.6.4. Recent Developments
- 11.2.6.5. Financials (Based on Availability)
- 11.2.7 Myovant Sciences GmbH
- 11.2.7.1. Overview
- 11.2.7.2. Products
- 11.2.7.3. SWOT Analysis
- 11.2.7.4. Recent Developments
- 11.2.7.5. Financials (Based on Availability)
- 11.2.8 Viatris
- 11.2.8.1. Overview
- 11.2.8.2. Products
- 11.2.8.3. SWOT Analysis
- 11.2.8.4. Recent Developments
- 11.2.8.5. Financials (Based on Availability)
- 11.2.9 Verity Pharmaceuticals Inc
- 11.2.9.1. Overview
- 11.2.9.2. Products
- 11.2.9.3. SWOT Analysis
- 11.2.9.4. Recent Developments
- 11.2.9.5. Financials (Based on Availability)
- 11.2.10 AbbVie Inc
- 11.2.10.1. Overview
- 11.2.10.2. Products
- 11.2.10.3. SWOT Analysis
- 11.2.10.4. Recent Developments
- 11.2.10.5. Financials (Based on Availability)
- 11.2.11 Bristol-Myers Squibb Company*List Not Exhaustive
- 11.2.11.1. Overview
- 11.2.11.2. Products
- 11.2.11.3. SWOT Analysis
- 11.2.11.4. Recent Developments
- 11.2.11.5. Financials (Based on Availability)
- 11.2.12 Tolmar Pharmaceuticals Inc
- 11.2.12.1. Overview
- 11.2.12.2. Products
- 11.2.12.3. SWOT Analysis
- 11.2.12.4. Recent Developments
- 11.2.12.5. Financials (Based on Availability)
- 11.2.1 Ferring B V
List of Figures
- Figure 1: Global Androgen Deprivation Therapy Industry Revenue Breakdown (billion, %) by Region 2025 & 2033
- Figure 2: North America Androgen Deprivation Therapy Industry Revenue (billion), by Treatment 2025 & 2033
- Figure 3: North America Androgen Deprivation Therapy Industry Revenue Share (%), by Treatment 2025 & 2033
- Figure 4: North America Androgen Deprivation Therapy Industry Revenue (billion), by Route of Administration 2025 & 2033
- Figure 5: North America Androgen Deprivation Therapy Industry Revenue Share (%), by Route of Administration 2025 & 2033
- Figure 6: North America Androgen Deprivation Therapy Industry Revenue (billion), by Country 2025 & 2033
- Figure 7: North America Androgen Deprivation Therapy Industry Revenue Share (%), by Country 2025 & 2033
- Figure 8: Europe Androgen Deprivation Therapy Industry Revenue (billion), by Treatment 2025 & 2033
- Figure 9: Europe Androgen Deprivation Therapy Industry Revenue Share (%), by Treatment 2025 & 2033
- Figure 10: Europe Androgen Deprivation Therapy Industry Revenue (billion), by Route of Administration 2025 & 2033
- Figure 11: Europe Androgen Deprivation Therapy Industry Revenue Share (%), by Route of Administration 2025 & 2033
- Figure 12: Europe Androgen Deprivation Therapy Industry Revenue (billion), by Country 2025 & 2033
- Figure 13: Europe Androgen Deprivation Therapy Industry Revenue Share (%), by Country 2025 & 2033
- Figure 14: Asia Pacific Androgen Deprivation Therapy Industry Revenue (billion), by Treatment 2025 & 2033
- Figure 15: Asia Pacific Androgen Deprivation Therapy Industry Revenue Share (%), by Treatment 2025 & 2033
- Figure 16: Asia Pacific Androgen Deprivation Therapy Industry Revenue (billion), by Route of Administration 2025 & 2033
- Figure 17: Asia Pacific Androgen Deprivation Therapy Industry Revenue Share (%), by Route of Administration 2025 & 2033
- Figure 18: Asia Pacific Androgen Deprivation Therapy Industry Revenue (billion), by Country 2025 & 2033
- Figure 19: Asia Pacific Androgen Deprivation Therapy Industry Revenue Share (%), by Country 2025 & 2033
- Figure 20: Middle East and Africa Androgen Deprivation Therapy Industry Revenue (billion), by Treatment 2025 & 2033
- Figure 21: Middle East and Africa Androgen Deprivation Therapy Industry Revenue Share (%), by Treatment 2025 & 2033
- Figure 22: Middle East and Africa Androgen Deprivation Therapy Industry Revenue (billion), by Route of Administration 2025 & 2033
- Figure 23: Middle East and Africa Androgen Deprivation Therapy Industry Revenue Share (%), by Route of Administration 2025 & 2033
- Figure 24: Middle East and Africa Androgen Deprivation Therapy Industry Revenue (billion), by Country 2025 & 2033
- Figure 25: Middle East and Africa Androgen Deprivation Therapy Industry Revenue Share (%), by Country 2025 & 2033
- Figure 26: South America Androgen Deprivation Therapy Industry Revenue (billion), by Treatment 2025 & 2033
- Figure 27: South America Androgen Deprivation Therapy Industry Revenue Share (%), by Treatment 2025 & 2033
- Figure 28: South America Androgen Deprivation Therapy Industry Revenue (billion), by Route of Administration 2025 & 2033
- Figure 29: South America Androgen Deprivation Therapy Industry Revenue Share (%), by Route of Administration 2025 & 2033
- Figure 30: South America Androgen Deprivation Therapy Industry Revenue (billion), by Country 2025 & 2033
- Figure 31: South America Androgen Deprivation Therapy Industry Revenue Share (%), by Country 2025 & 2033
List of Tables
- Table 1: Global Androgen Deprivation Therapy Industry Revenue billion Forecast, by Treatment 2020 & 2033
- Table 2: Global Androgen Deprivation Therapy Industry Revenue billion Forecast, by Route of Administration 2020 & 2033
- Table 3: Global Androgen Deprivation Therapy Industry Revenue billion Forecast, by Region 2020 & 2033
- Table 4: Global Androgen Deprivation Therapy Industry Revenue billion Forecast, by Treatment 2020 & 2033
- Table 5: Global Androgen Deprivation Therapy Industry Revenue billion Forecast, by Route of Administration 2020 & 2033
- Table 6: Global Androgen Deprivation Therapy Industry Revenue billion Forecast, by Country 2020 & 2033
- Table 7: United States Androgen Deprivation Therapy Industry Revenue (billion) Forecast, by Application 2020 & 2033
- Table 8: Canada Androgen Deprivation Therapy Industry Revenue (billion) Forecast, by Application 2020 & 2033
- Table 9: Mexico Androgen Deprivation Therapy Industry Revenue (billion) Forecast, by Application 2020 & 2033
- Table 10: Global Androgen Deprivation Therapy Industry Revenue billion Forecast, by Treatment 2020 & 2033
- Table 11: Global Androgen Deprivation Therapy Industry Revenue billion Forecast, by Route of Administration 2020 & 2033
- Table 12: Global Androgen Deprivation Therapy Industry Revenue billion Forecast, by Country 2020 & 2033
- Table 13: Germany Androgen Deprivation Therapy Industry Revenue (billion) Forecast, by Application 2020 & 2033
- Table 14: United Kingdom Androgen Deprivation Therapy Industry Revenue (billion) Forecast, by Application 2020 & 2033
- Table 15: France Androgen Deprivation Therapy Industry Revenue (billion) Forecast, by Application 2020 & 2033
- Table 16: Italy Androgen Deprivation Therapy Industry Revenue (billion) Forecast, by Application 2020 & 2033
- Table 17: Spain Androgen Deprivation Therapy Industry Revenue (billion) Forecast, by Application 2020 & 2033
- Table 18: Rest of Europe Androgen Deprivation Therapy Industry Revenue (billion) Forecast, by Application 2020 & 2033
- Table 19: Global Androgen Deprivation Therapy Industry Revenue billion Forecast, by Treatment 2020 & 2033
- Table 20: Global Androgen Deprivation Therapy Industry Revenue billion Forecast, by Route of Administration 2020 & 2033
- Table 21: Global Androgen Deprivation Therapy Industry Revenue billion Forecast, by Country 2020 & 2033
- Table 22: China Androgen Deprivation Therapy Industry Revenue (billion) Forecast, by Application 2020 & 2033
- Table 23: Japan Androgen Deprivation Therapy Industry Revenue (billion) Forecast, by Application 2020 & 2033
- Table 24: India Androgen Deprivation Therapy Industry Revenue (billion) Forecast, by Application 2020 & 2033
- Table 25: Australia Androgen Deprivation Therapy Industry Revenue (billion) Forecast, by Application 2020 & 2033
- Table 26: South Korea Androgen Deprivation Therapy Industry Revenue (billion) Forecast, by Application 2020 & 2033
- Table 27: Rest of Asia Pacific Androgen Deprivation Therapy Industry Revenue (billion) Forecast, by Application 2020 & 2033
- Table 28: Global Androgen Deprivation Therapy Industry Revenue billion Forecast, by Treatment 2020 & 2033
- Table 29: Global Androgen Deprivation Therapy Industry Revenue billion Forecast, by Route of Administration 2020 & 2033
- Table 30: Global Androgen Deprivation Therapy Industry Revenue billion Forecast, by Country 2020 & 2033
- Table 31: GCC Androgen Deprivation Therapy Industry Revenue (billion) Forecast, by Application 2020 & 2033
- Table 32: South Africa Androgen Deprivation Therapy Industry Revenue (billion) Forecast, by Application 2020 & 2033
- Table 33: Rest of Middle East and Africa Androgen Deprivation Therapy Industry Revenue (billion) Forecast, by Application 2020 & 2033
- Table 34: Global Androgen Deprivation Therapy Industry Revenue billion Forecast, by Treatment 2020 & 2033
- Table 35: Global Androgen Deprivation Therapy Industry Revenue billion Forecast, by Route of Administration 2020 & 2033
- Table 36: Global Androgen Deprivation Therapy Industry Revenue billion Forecast, by Country 2020 & 2033
- Table 37: Brazil Androgen Deprivation Therapy Industry Revenue (billion) Forecast, by Application 2020 & 2033
- Table 38: Argentina Androgen Deprivation Therapy Industry Revenue (billion) Forecast, by Application 2020 & 2033
- Table 39: Rest of South America Androgen Deprivation Therapy Industry Revenue (billion) Forecast, by Application 2020 & 2033
Frequently Asked Questions
1. What is the projected Compound Annual Growth Rate (CAGR) of the Androgen Deprivation Therapy Industry?
The projected CAGR is approximately 6%.
2. Which companies are prominent players in the Androgen Deprivation Therapy Industry?
Key companies in the market include Ferring B V, Astrazeneca, Bayer AG, Astellas Pharma Inc, Johnson and Johnson, Foresee Pharmaceuticals Co Ltd, Myovant Sciences GmbH, Viatris, Verity Pharmaceuticals Inc, AbbVie Inc, Bristol-Myers Squibb Company*List Not Exhaustive, Tolmar Pharmaceuticals Inc.
3. What are the main segments of the Androgen Deprivation Therapy Industry?
The market segments include Treatment, Route of Administration.
4. Can you provide details about the market size?
The market size is estimated to be USD 8.31 billion as of 2022.
5. What are some drivers contributing to market growth?
Rising Burden of Prostrate Cancer; Rising Research and Development Activities.
6. What are the notable trends driving market growth?
Antiandrogen Sub Segment Within Drug Class Segment is Expected to Witness a Strong Growth Over the Forecast Period.
7. Are there any restraints impacting market growth?
Poor Reimbursement and Increasing Side Effects.
8. Can you provide examples of recent developments in the market?
March 2023: The European Commission approved Nubeqa (darolutamide), an oral androgen receptor inhibitor (ARi), plus androgen deprivation therapy (ADT) in combination with docetaxel, for the treatment of patients with metastatic hormone-sensitive prostate cancer (mHSPC).
9. What pricing options are available for accessing the report?
Pricing options include single-user, multi-user, and enterprise licenses priced at USD 4750, USD 5250, and USD 8750 respectively.
10. Is the market size provided in terms of value or volume?
The market size is provided in terms of value, measured in billion.
11. Are there any specific market keywords associated with the report?
Yes, the market keyword associated with the report is "Androgen Deprivation Therapy Industry," which aids in identifying and referencing the specific market segment covered.
12. How do I determine which pricing option suits my needs best?
The pricing options vary based on user requirements and access needs. Individual users may opt for single-user licenses, while businesses requiring broader access may choose multi-user or enterprise licenses for cost-effective access to the report.
13. Are there any additional resources or data provided in the Androgen Deprivation Therapy Industry report?
While the report offers comprehensive insights, it's advisable to review the specific contents or supplementary materials provided to ascertain if additional resources or data are available.
14. How can I stay updated on further developments or reports in the Androgen Deprivation Therapy Industry?
To stay informed about further developments, trends, and reports in the Androgen Deprivation Therapy Industry, consider subscribing to industry newsletters, following relevant companies and organizations, or regularly checking reputable industry news sources and publications.
Methodology
Step 1 - Identification of Relevant Samples Size from Population Database


Step 2 - Approaches for Defining Global Market Size (Value, Volume* & Price*)

Note*: In applicable scenarios
Step 3 - Data Sources
Primary Research
- Web Analytics
- Survey Reports
- Research Institute
- Latest Research Reports
- Opinion Leaders
Secondary Research
- Annual Reports
- White Paper
- Latest Press Release
- Industry Association
- Paid Database
- Investor Presentations

Step 4 - Data Triangulation
Involves using different sources of information in order to increase the validity of a study
These sources are likely to be stakeholders in a program - participants, other researchers, program staff, other community members, and so on.
Then we put all data in single framework & apply various statistical tools to find out the dynamic on the market.
During the analysis stage, feedback from the stakeholder groups would be compared to determine areas of agreement as well as areas of divergence