

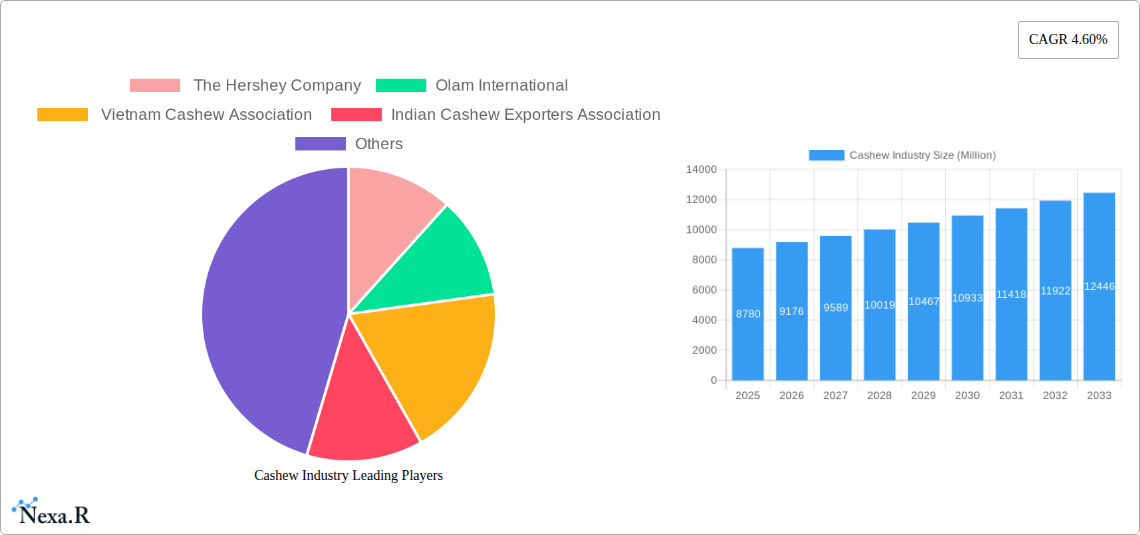
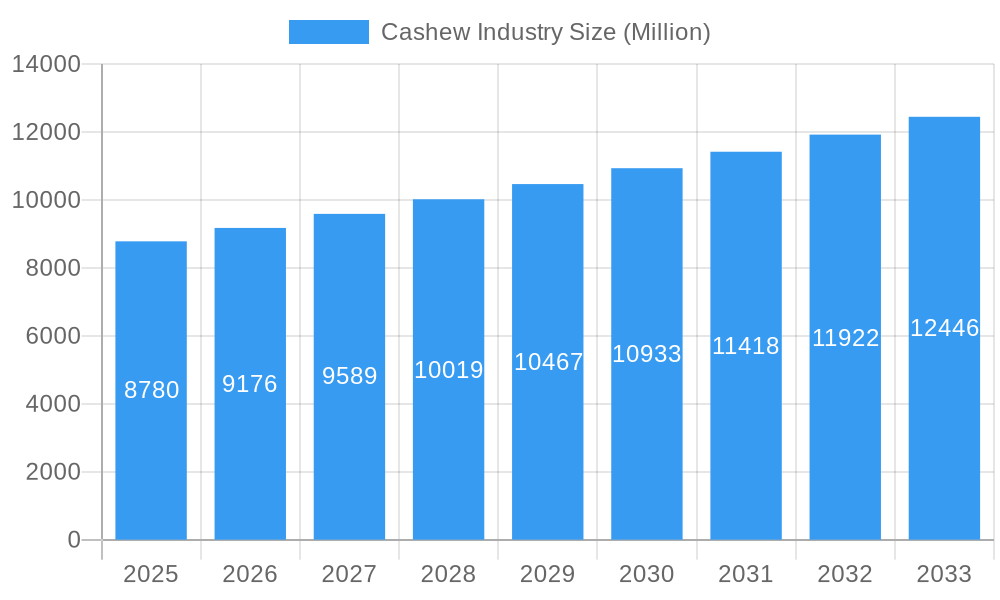
Key Insights
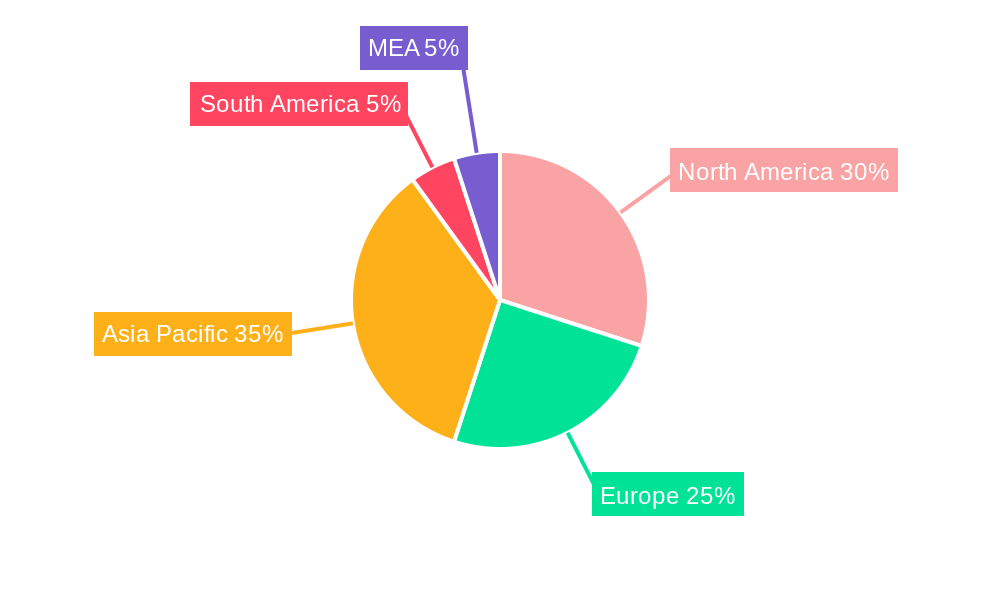
The global cashew industry, valued at $8.78 billion in 2025, is projected to experience robust growth, driven by rising consumer demand for healthy snacks and the increasing popularity of cashew-based products in food and beverage applications. This growth is further fueled by expanding distribution channels, particularly e-commerce, and the growing adoption of cashew milk and cashew butter as dairy alternatives. The industry's Compound Annual Growth Rate (CAGR) of 4.60% from 2025 to 2033 signifies a substantial increase in market size over the forecast period. Key players like The Hershey Company and Olam International are strategically investing in production, processing, and distribution to capture market share. While challenges exist, such as fluctuating raw material prices and climate change impacting cashew production, these are expected to be mitigated by technological advancements in farming and processing, as well as increasing collaboration within the industry, exemplified by the efforts of organizations like the Vietnam Cashew Association and Indian Cashew Exporters Association. Regional variations in market demand exist, with North America and Asia-Pacific expected to remain dominant regions due to high consumption rates and increasing disposable incomes. However, the growth potential in other regions, such as South America and MEA, is also significant and presents lucrative opportunities for industry expansion.
Cashew Industry Market Size (In Billion)
The cashew market’s future trajectory hinges on sustainable sourcing practices and responsible production to address environmental and social concerns. Increased focus on product diversification beyond whole cashews, including value-added products like cashew flour, roasted cashews, and cashew-derived ingredients for the food processing industry, will contribute significantly to market expansion. This diversification reduces reliance on price fluctuations for raw cashews, providing greater stability for businesses within the supply chain. Furthermore, brands are increasingly emphasizing sustainability and traceability in their sourcing, catering to the growing consumer awareness of ethical and environmentally friendly products. This trend is expected to influence market growth and further shape the competitive landscape in the coming years.
Cashew Industry Company Market Share
Cashew Industry Market Report: 2019-2033
This comprehensive report provides a detailed analysis of the global cashew industry, encompassing market dynamics, growth trends, regional dominance, product landscape, key players, and future outlook. With a study period spanning 2019-2033, a base year of 2025, and a forecast period of 2025-2033, this report offers invaluable insights for industry professionals, investors, and stakeholders seeking to navigate this dynamic market. The report leverages extensive primary and secondary research to provide a granular view of the parent market (nuts and seeds) and the child market (cashews).
Cashew Industry Market Dynamics & Structure
This section analyzes the competitive landscape, technological advancements, regulatory environment, and market trends influencing the cashew industry. The global cashew market, valued at xx million in 2024, is expected to reach xx million by 2033, exhibiting a CAGR of xx%.
- Market Concentration: The market exhibits a moderately concentrated structure with key players holding significant market share, while smaller regional players also contribute significantly. The top five players collectively hold approximately xx% of the market share (2024).
- Technological Innovation: Automation in processing and packaging, improved traceability systems, and advancements in quality control are driving efficiency and product consistency. However, high initial investment costs present a barrier to entry for smaller players.
- Regulatory Frameworks: Varying import/export regulations, food safety standards, and labeling requirements across different regions impact market dynamics. Compliance costs represent a significant challenge for industry players.
- Competitive Product Substitutes: Almonds, peanuts, and other nuts pose competitive pressure, influencing cashew pricing and market share. The increasing awareness of cashew's health benefits provides a competitive edge.
- End-User Demographics: Growing health consciousness among consumers, coupled with increasing disposable incomes, is fueling the demand for healthy snacks, benefiting cashew consumption.
- M&A Trends: The past five years witnessed xx M&A deals, mainly driven by expansion strategies, market consolidation, and accessing new technologies. This trend is expected to continue with a projected xx deals in the forecast period.
Cashew Industry Growth Trends & Insights
Leveraging extensive market research data, this section provides a comprehensive analysis of market size evolution, adoption rates, technological disruptions, and consumer behavior shifts within the global cashew industry. The historical period (2019-2024) witnessed robust growth driven by factors including increasing consumer preference for healthy snacks, rising disposable incomes in developing economies, and evolving food consumption patterns. The forecast period (2025-2033) anticipates continued growth, though at a potentially moderated pace compared to the past, influenced by supply chain complexities, fluctuating raw material prices and economic uncertainty. The market size is expected to increase from xx million in 2024 to xx million in 2033, displaying a CAGR of xx%. Market penetration in key regions continues to rise, with xx% penetration in [Region A] and xx% in [Region B] as of 2024. Technological disruptions like precision agriculture and improved processing techniques are boosting efficiency and product quality, creating further growth opportunities.
Dominant Regions, Countries, or Segments in Cashew Industry
Vietnam and India are the dominant players in the global cashew industry, together controlling over xx% of the global market share in 2024. This dominance is attributed to several factors:
- Vietnam: Beneficial climatic conditions, cost-effective labor, and established export infrastructure contribute to Vietnam's leading position. Government support for cashew cultivation and processing further strengthens its competitive advantage.
- India: Large domestic consumption and a significant export market contribute to India's substantial share. However, fluctuating raw material prices and competition from other nut producers pose challenges.
- Other Regions: Africa and Southeast Asia also represent significant growth regions, exhibiting increasing production and consumption. Market share in these regions is projected to grow at a CAGR of xx% in the forecast period.
Cashew Industry Product Landscape
The cashew product landscape is diverse, ranging from raw cashews to processed products like roasted, salted, and flavored cashews, cashew butter, cashew milk and cashew flour. Continuous innovation focuses on enhancing flavor profiles, creating convenient packaging formats, and developing healthier variations, such as reduced-fat or organic options. This caters to the evolving consumer preferences and growing demand for convenient and functional foods. The emergence of cashew-based protein bars and other health-conscious products represents a significant area of growth.
Key Drivers, Barriers & Challenges in Cashew Industry
Key Drivers:
- Growing health consciousness: Cashews' nutritional profile drives increased consumption.
- Rising disposable incomes: Boosts purchasing power, particularly in developing economies.
- Technological advancements: Improves efficiency and product quality.
Key Challenges:
- Price volatility of raw cashews: Affects profitability and market stability.
- Supply chain disruptions: Impacts availability and timely delivery.
- Competition from substitute products: Pressure on market share and pricing. The competitive landscape is also intensified by the rise of plant-based alternatives.
Emerging Opportunities in Cashew Industry
- Untapped markets: Expanding into new markets with high growth potential (e.g., South America, Africa).
- Innovative applications: Developing new products like cashew-based dairy alternatives and protein bars.
- Evolving consumer preferences: Catering to niche demands (e.g., organic, vegan options).
Growth Accelerators in the Cashew Industry
Technological advancements in cultivation and processing, strategic partnerships between processors and retailers, and expansion into new markets contribute significantly to long-term growth. Investing in sustainable farming practices and promoting responsible sourcing also enhances the industry's image and long-term sustainability.
Key Players Shaping the Cashew Industry Market
- The Hershey Company
- Olam International
- Vietnam Cashew Association
- Indian Cashew Exporters Association
Notable Milestones in Cashew Industry Sector
- 2020: Increased focus on sustainable cashew farming practices.
- 2021: Several major M&A deals reshaped the market landscape.
- 2022: New product launches capitalized on the growing demand for healthy snacks.
In-Depth Cashew Industry Market Outlook
The future of the cashew industry appears promising, driven by continuous innovation, strategic investments, and expanding consumer demand. Strategic partnerships, focus on sustainability, and product diversification will play a crucial role in maximizing long-term growth potential. Further market penetration in developing economies and the creation of innovative cashew-based products promise strong growth in the coming years.
Cashew Industry Segmentation
- 1. Production Analysis
- 2. Consumption Analysis
- 3. Import Market Analysis (Value & Volume)
- 4. Export Market Analysis (Value & Volume)
- 5. Price Trend Analysis
Cashew Industry Segmentation By Geography
-
1. North America
- 1.1. United States
- 1.2. Canada
- 1.3. Mexico
-
2. South America
- 2.1. Brazil
- 2.2. Argentina
- 2.3. Rest of South America
-
3. Europe
- 3.1. United Kingdom
- 3.2. Germany
- 3.3. France
- 3.4. Italy
- 3.5. Spain
- 3.6. Russia
- 3.7. Benelux
- 3.8. Nordics
- 3.9. Rest of Europe
-
4. Middle East & Africa
- 4.1. Turkey
- 4.2. Israel
- 4.3. GCC
- 4.4. North Africa
- 4.5. South Africa
- 4.6. Rest of Middle East & Africa
-
5. Asia Pacific
- 5.1. China
- 5.2. India
- 5.3. Japan
- 5.4. South Korea
- 5.5. ASEAN
- 5.6. Oceania
- 5.7. Rest of Asia Pacific
Cashew Industry Regional Market Share
Geographic Coverage of Cashew Industry
Cashew Industry REPORT HIGHLIGHTS
| Aspects | Details |
|---|---|
| Study Period | 2020-2034 |
| Base Year | 2025 |
| Estimated Year | 2026 |
| Forecast Period | 2026-2034 |
| Historical Period | 2020-2025 |
| Growth Rate | CAGR of 4.60% from 2020-2034 |
| Segmentation |
|
Table of Contents
- 1. Introduction
- 1.1. Research Scope
- 1.2. Market Segmentation
- 1.3. Research Methodology
- 1.4. Definitions and Assumptions
- 2. Executive Summary
- 2.1. Introduction
- 3. Market Dynamics
- 3.1. Introduction
- 3.2. Market Drivers
- 3.2.1. Rising Consumption of Cashew Nuts as a Healthy Snack; Increasing Government initiatives; Growing Cashew Nut Imports in The United States
- 3.3. Market Restrains
- 3.3.1. Hazardous Climatic Condition Hinders Cashew Production; Stringent Regulations Related To Food Quality Standards
- 3.4. Market Trends
- 3.4.1. Increasing Government Initiatives to Boost Cashew Production
- 4. Market Factor Analysis
- 4.1. Porters Five Forces
- 4.2. Supply/Value Chain
- 4.3. PESTEL analysis
- 4.4. Market Entropy
- 4.5. Patent/Trademark Analysis
- 5. Global Cashew Industry Analysis, Insights and Forecast, 2020-2032
- 5.1. Market Analysis, Insights and Forecast - by Production Analysis
- 5.2. Market Analysis, Insights and Forecast - by Consumption Analysis
- 5.3. Market Analysis, Insights and Forecast - by Import Market Analysis (Value & Volume)
- 5.4. Market Analysis, Insights and Forecast - by Export Market Analysis (Value & Volume)
- 5.5. Market Analysis, Insights and Forecast - by Price Trend Analysis
- 5.6. Market Analysis, Insights and Forecast - by Region
- 5.6.1. North America
- 5.6.2. South America
- 5.6.3. Europe
- 5.6.4. Middle East & Africa
- 5.6.5. Asia Pacific
- 5.1. Market Analysis, Insights and Forecast - by Production Analysis
- 6. North America Cashew Industry Analysis, Insights and Forecast, 2020-2032
- 6.1. Market Analysis, Insights and Forecast - by Production Analysis
- 6.2. Market Analysis, Insights and Forecast - by Consumption Analysis
- 6.3. Market Analysis, Insights and Forecast - by Import Market Analysis (Value & Volume)
- 6.4. Market Analysis, Insights and Forecast - by Export Market Analysis (Value & Volume)
- 6.5. Market Analysis, Insights and Forecast - by Price Trend Analysis
- 6.1. Market Analysis, Insights and Forecast - by Production Analysis
- 7. South America Cashew Industry Analysis, Insights and Forecast, 2020-2032
- 7.1. Market Analysis, Insights and Forecast - by Production Analysis
- 7.2. Market Analysis, Insights and Forecast - by Consumption Analysis
- 7.3. Market Analysis, Insights and Forecast - by Import Market Analysis (Value & Volume)
- 7.4. Market Analysis, Insights and Forecast - by Export Market Analysis (Value & Volume)
- 7.5. Market Analysis, Insights and Forecast - by Price Trend Analysis
- 7.1. Market Analysis, Insights and Forecast - by Production Analysis
- 8. Europe Cashew Industry Analysis, Insights and Forecast, 2020-2032
- 8.1. Market Analysis, Insights and Forecast - by Production Analysis
- 8.2. Market Analysis, Insights and Forecast - by Consumption Analysis
- 8.3. Market Analysis, Insights and Forecast - by Import Market Analysis (Value & Volume)
- 8.4. Market Analysis, Insights and Forecast - by Export Market Analysis (Value & Volume)
- 8.5. Market Analysis, Insights and Forecast - by Price Trend Analysis
- 8.1. Market Analysis, Insights and Forecast - by Production Analysis
- 9. Middle East & Africa Cashew Industry Analysis, Insights and Forecast, 2020-2032
- 9.1. Market Analysis, Insights and Forecast - by Production Analysis
- 9.2. Market Analysis, Insights and Forecast - by Consumption Analysis
- 9.3. Market Analysis, Insights and Forecast - by Import Market Analysis (Value & Volume)
- 9.4. Market Analysis, Insights and Forecast - by Export Market Analysis (Value & Volume)
- 9.5. Market Analysis, Insights and Forecast - by Price Trend Analysis
- 9.1. Market Analysis, Insights and Forecast - by Production Analysis
- 10. Asia Pacific Cashew Industry Analysis, Insights and Forecast, 2020-2032
- 10.1. Market Analysis, Insights and Forecast - by Production Analysis
- 10.2. Market Analysis, Insights and Forecast - by Consumption Analysis
- 10.3. Market Analysis, Insights and Forecast - by Import Market Analysis (Value & Volume)
- 10.4. Market Analysis, Insights and Forecast - by Export Market Analysis (Value & Volume)
- 10.5. Market Analysis, Insights and Forecast - by Price Trend Analysis
- 10.1. Market Analysis, Insights and Forecast - by Production Analysis
- 11. Competitive Analysis
- 11.1. Global Market Share Analysis 2025
- 11.2. Company Profiles
- 11.2.1 The Hershey Company
- 11.2.1.1. Overview
- 11.2.1.2. Products
- 11.2.1.3. SWOT Analysis
- 11.2.1.4. Recent Developments
- 11.2.1.5. Financials (Based on Availability)
- 11.2.2 Olam International
- 11.2.2.1. Overview
- 11.2.2.2. Products
- 11.2.2.3. SWOT Analysis
- 11.2.2.4. Recent Developments
- 11.2.2.5. Financials (Based on Availability)
- 11.2.3 Vietnam Cashew Association
- 11.2.3.1. Overview
- 11.2.3.2. Products
- 11.2.3.3. SWOT Analysis
- 11.2.3.4. Recent Developments
- 11.2.3.5. Financials (Based on Availability)
- 11.2.4 Indian Cashew Exporters Association
- 11.2.4.1. Overview
- 11.2.4.2. Products
- 11.2.4.3. SWOT Analysis
- 11.2.4.4. Recent Developments
- 11.2.4.5. Financials (Based on Availability)
- 11.2.1 The Hershey Company
List of Figures
- Figure 1: Global Cashew Industry Revenue Breakdown (Million, %) by Region 2025 & 2033
- Figure 2: Global Cashew Industry Volume Breakdown (Metric Tons, %) by Region 2025 & 2033
- Figure 3: North America Cashew Industry Revenue (Million), by Production Analysis 2025 & 2033
- Figure 4: North America Cashew Industry Volume (Metric Tons), by Production Analysis 2025 & 2033
- Figure 5: North America Cashew Industry Revenue Share (%), by Production Analysis 2025 & 2033
- Figure 6: North America Cashew Industry Volume Share (%), by Production Analysis 2025 & 2033
- Figure 7: North America Cashew Industry Revenue (Million), by Consumption Analysis 2025 & 2033
- Figure 8: North America Cashew Industry Volume (Metric Tons), by Consumption Analysis 2025 & 2033
- Figure 9: North America Cashew Industry Revenue Share (%), by Consumption Analysis 2025 & 2033
- Figure 10: North America Cashew Industry Volume Share (%), by Consumption Analysis 2025 & 2033
- Figure 11: North America Cashew Industry Revenue (Million), by Import Market Analysis (Value & Volume) 2025 & 2033
- Figure 12: North America Cashew Industry Volume (Metric Tons), by Import Market Analysis (Value & Volume) 2025 & 2033
- Figure 13: North America Cashew Industry Revenue Share (%), by Import Market Analysis (Value & Volume) 2025 & 2033
- Figure 14: North America Cashew Industry Volume Share (%), by Import Market Analysis (Value & Volume) 2025 & 2033
- Figure 15: North America Cashew Industry Revenue (Million), by Export Market Analysis (Value & Volume) 2025 & 2033
- Figure 16: North America Cashew Industry Volume (Metric Tons), by Export Market Analysis (Value & Volume) 2025 & 2033
- Figure 17: North America Cashew Industry Revenue Share (%), by Export Market Analysis (Value & Volume) 2025 & 2033
- Figure 18: North America Cashew Industry Volume Share (%), by Export Market Analysis (Value & Volume) 2025 & 2033
- Figure 19: North America Cashew Industry Revenue (Million), by Price Trend Analysis 2025 & 2033
- Figure 20: North America Cashew Industry Volume (Metric Tons), by Price Trend Analysis 2025 & 2033
- Figure 21: North America Cashew Industry Revenue Share (%), by Price Trend Analysis 2025 & 2033
- Figure 22: North America Cashew Industry Volume Share (%), by Price Trend Analysis 2025 & 2033
- Figure 23: North America Cashew Industry Revenue (Million), by Country 2025 & 2033
- Figure 24: North America Cashew Industry Volume (Metric Tons), by Country 2025 & 2033
- Figure 25: North America Cashew Industry Revenue Share (%), by Country 2025 & 2033
- Figure 26: North America Cashew Industry Volume Share (%), by Country 2025 & 2033
- Figure 27: South America Cashew Industry Revenue (Million), by Production Analysis 2025 & 2033
- Figure 28: South America Cashew Industry Volume (Metric Tons), by Production Analysis 2025 & 2033
- Figure 29: South America Cashew Industry Revenue Share (%), by Production Analysis 2025 & 2033
- Figure 30: South America Cashew Industry Volume Share (%), by Production Analysis 2025 & 2033
- Figure 31: South America Cashew Industry Revenue (Million), by Consumption Analysis 2025 & 2033
- Figure 32: South America Cashew Industry Volume (Metric Tons), by Consumption Analysis 2025 & 2033
- Figure 33: South America Cashew Industry Revenue Share (%), by Consumption Analysis 2025 & 2033
- Figure 34: South America Cashew Industry Volume Share (%), by Consumption Analysis 2025 & 2033
- Figure 35: South America Cashew Industry Revenue (Million), by Import Market Analysis (Value & Volume) 2025 & 2033
- Figure 36: South America Cashew Industry Volume (Metric Tons), by Import Market Analysis (Value & Volume) 2025 & 2033
- Figure 37: South America Cashew Industry Revenue Share (%), by Import Market Analysis (Value & Volume) 2025 & 2033
- Figure 38: South America Cashew Industry Volume Share (%), by Import Market Analysis (Value & Volume) 2025 & 2033
- Figure 39: South America Cashew Industry Revenue (Million), by Export Market Analysis (Value & Volume) 2025 & 2033
- Figure 40: South America Cashew Industry Volume (Metric Tons), by Export Market Analysis (Value & Volume) 2025 & 2033
- Figure 41: South America Cashew Industry Revenue Share (%), by Export Market Analysis (Value & Volume) 2025 & 2033
- Figure 42: South America Cashew Industry Volume Share (%), by Export Market Analysis (Value & Volume) 2025 & 2033
- Figure 43: South America Cashew Industry Revenue (Million), by Price Trend Analysis 2025 & 2033
- Figure 44: South America Cashew Industry Volume (Metric Tons), by Price Trend Analysis 2025 & 2033
- Figure 45: South America Cashew Industry Revenue Share (%), by Price Trend Analysis 2025 & 2033
- Figure 46: South America Cashew Industry Volume Share (%), by Price Trend Analysis 2025 & 2033
- Figure 47: South America Cashew Industry Revenue (Million), by Country 2025 & 2033
- Figure 48: South America Cashew Industry Volume (Metric Tons), by Country 2025 & 2033
- Figure 49: South America Cashew Industry Revenue Share (%), by Country 2025 & 2033
- Figure 50: South America Cashew Industry Volume Share (%), by Country 2025 & 2033
- Figure 51: Europe Cashew Industry Revenue (Million), by Production Analysis 2025 & 2033
- Figure 52: Europe Cashew Industry Volume (Metric Tons), by Production Analysis 2025 & 2033
- Figure 53: Europe Cashew Industry Revenue Share (%), by Production Analysis 2025 & 2033
- Figure 54: Europe Cashew Industry Volume Share (%), by Production Analysis 2025 & 2033
- Figure 55: Europe Cashew Industry Revenue (Million), by Consumption Analysis 2025 & 2033
- Figure 56: Europe Cashew Industry Volume (Metric Tons), by Consumption Analysis 2025 & 2033
- Figure 57: Europe Cashew Industry Revenue Share (%), by Consumption Analysis 2025 & 2033
- Figure 58: Europe Cashew Industry Volume Share (%), by Consumption Analysis 2025 & 2033
- Figure 59: Europe Cashew Industry Revenue (Million), by Import Market Analysis (Value & Volume) 2025 & 2033
- Figure 60: Europe Cashew Industry Volume (Metric Tons), by Import Market Analysis (Value & Volume) 2025 & 2033
- Figure 61: Europe Cashew Industry Revenue Share (%), by Import Market Analysis (Value & Volume) 2025 & 2033
- Figure 62: Europe Cashew Industry Volume Share (%), by Import Market Analysis (Value & Volume) 2025 & 2033
- Figure 63: Europe Cashew Industry Revenue (Million), by Export Market Analysis (Value & Volume) 2025 & 2033
- Figure 64: Europe Cashew Industry Volume (Metric Tons), by Export Market Analysis (Value & Volume) 2025 & 2033
- Figure 65: Europe Cashew Industry Revenue Share (%), by Export Market Analysis (Value & Volume) 2025 & 2033
- Figure 66: Europe Cashew Industry Volume Share (%), by Export Market Analysis (Value & Volume) 2025 & 2033
- Figure 67: Europe Cashew Industry Revenue (Million), by Price Trend Analysis 2025 & 2033
- Figure 68: Europe Cashew Industry Volume (Metric Tons), by Price Trend Analysis 2025 & 2033
- Figure 69: Europe Cashew Industry Revenue Share (%), by Price Trend Analysis 2025 & 2033
- Figure 70: Europe Cashew Industry Volume Share (%), by Price Trend Analysis 2025 & 2033
- Figure 71: Europe Cashew Industry Revenue (Million), by Country 2025 & 2033
- Figure 72: Europe Cashew Industry Volume (Metric Tons), by Country 2025 & 2033
- Figure 73: Europe Cashew Industry Revenue Share (%), by Country 2025 & 2033
- Figure 74: Europe Cashew Industry Volume Share (%), by Country 2025 & 2033
- Figure 75: Middle East & Africa Cashew Industry Revenue (Million), by Production Analysis 2025 & 2033
- Figure 76: Middle East & Africa Cashew Industry Volume (Metric Tons), by Production Analysis 2025 & 2033
- Figure 77: Middle East & Africa Cashew Industry Revenue Share (%), by Production Analysis 2025 & 2033
- Figure 78: Middle East & Africa Cashew Industry Volume Share (%), by Production Analysis 2025 & 2033
- Figure 79: Middle East & Africa Cashew Industry Revenue (Million), by Consumption Analysis 2025 & 2033
- Figure 80: Middle East & Africa Cashew Industry Volume (Metric Tons), by Consumption Analysis 2025 & 2033
- Figure 81: Middle East & Africa Cashew Industry Revenue Share (%), by Consumption Analysis 2025 & 2033
- Figure 82: Middle East & Africa Cashew Industry Volume Share (%), by Consumption Analysis 2025 & 2033
- Figure 83: Middle East & Africa Cashew Industry Revenue (Million), by Import Market Analysis (Value & Volume) 2025 & 2033
- Figure 84: Middle East & Africa Cashew Industry Volume (Metric Tons), by Import Market Analysis (Value & Volume) 2025 & 2033
- Figure 85: Middle East & Africa Cashew Industry Revenue Share (%), by Import Market Analysis (Value & Volume) 2025 & 2033
- Figure 86: Middle East & Africa Cashew Industry Volume Share (%), by Import Market Analysis (Value & Volume) 2025 & 2033
- Figure 87: Middle East & Africa Cashew Industry Revenue (Million), by Export Market Analysis (Value & Volume) 2025 & 2033
- Figure 88: Middle East & Africa Cashew Industry Volume (Metric Tons), by Export Market Analysis (Value & Volume) 2025 & 2033
- Figure 89: Middle East & Africa Cashew Industry Revenue Share (%), by Export Market Analysis (Value & Volume) 2025 & 2033
- Figure 90: Middle East & Africa Cashew Industry Volume Share (%), by Export Market Analysis (Value & Volume) 2025 & 2033
- Figure 91: Middle East & Africa Cashew Industry Revenue (Million), by Price Trend Analysis 2025 & 2033
- Figure 92: Middle East & Africa Cashew Industry Volume (Metric Tons), by Price Trend Analysis 2025 & 2033
- Figure 93: Middle East & Africa Cashew Industry Revenue Share (%), by Price Trend Analysis 2025 & 2033
- Figure 94: Middle East & Africa Cashew Industry Volume Share (%), by Price Trend Analysis 2025 & 2033
- Figure 95: Middle East & Africa Cashew Industry Revenue (Million), by Country 2025 & 2033
- Figure 96: Middle East & Africa Cashew Industry Volume (Metric Tons), by Country 2025 & 2033
- Figure 97: Middle East & Africa Cashew Industry Revenue Share (%), by Country 2025 & 2033
- Figure 98: Middle East & Africa Cashew Industry Volume Share (%), by Country 2025 & 2033
- Figure 99: Asia Pacific Cashew Industry Revenue (Million), by Production Analysis 2025 & 2033
- Figure 100: Asia Pacific Cashew Industry Volume (Metric Tons), by Production Analysis 2025 & 2033
- Figure 101: Asia Pacific Cashew Industry Revenue Share (%), by Production Analysis 2025 & 2033
- Figure 102: Asia Pacific Cashew Industry Volume Share (%), by Production Analysis 2025 & 2033
- Figure 103: Asia Pacific Cashew Industry Revenue (Million), by Consumption Analysis 2025 & 2033
- Figure 104: Asia Pacific Cashew Industry Volume (Metric Tons), by Consumption Analysis 2025 & 2033
- Figure 105: Asia Pacific Cashew Industry Revenue Share (%), by Consumption Analysis 2025 & 2033
- Figure 106: Asia Pacific Cashew Industry Volume Share (%), by Consumption Analysis 2025 & 2033
- Figure 107: Asia Pacific Cashew Industry Revenue (Million), by Import Market Analysis (Value & Volume) 2025 & 2033
- Figure 108: Asia Pacific Cashew Industry Volume (Metric Tons), by Import Market Analysis (Value & Volume) 2025 & 2033
- Figure 109: Asia Pacific Cashew Industry Revenue Share (%), by Import Market Analysis (Value & Volume) 2025 & 2033
- Figure 110: Asia Pacific Cashew Industry Volume Share (%), by Import Market Analysis (Value & Volume) 2025 & 2033
- Figure 111: Asia Pacific Cashew Industry Revenue (Million), by Export Market Analysis (Value & Volume) 2025 & 2033
- Figure 112: Asia Pacific Cashew Industry Volume (Metric Tons), by Export Market Analysis (Value & Volume) 2025 & 2033
- Figure 113: Asia Pacific Cashew Industry Revenue Share (%), by Export Market Analysis (Value & Volume) 2025 & 2033
- Figure 114: Asia Pacific Cashew Industry Volume Share (%), by Export Market Analysis (Value & Volume) 2025 & 2033
- Figure 115: Asia Pacific Cashew Industry Revenue (Million), by Price Trend Analysis 2025 & 2033
- Figure 116: Asia Pacific Cashew Industry Volume (Metric Tons), by Price Trend Analysis 2025 & 2033
- Figure 117: Asia Pacific Cashew Industry Revenue Share (%), by Price Trend Analysis 2025 & 2033
- Figure 118: Asia Pacific Cashew Industry Volume Share (%), by Price Trend Analysis 2025 & 2033
- Figure 119: Asia Pacific Cashew Industry Revenue (Million), by Country 2025 & 2033
- Figure 120: Asia Pacific Cashew Industry Volume (Metric Tons), by Country 2025 & 2033
- Figure 121: Asia Pacific Cashew Industry Revenue Share (%), by Country 2025 & 2033
- Figure 122: Asia Pacific Cashew Industry Volume Share (%), by Country 2025 & 2033
List of Tables
- Table 1: Global Cashew Industry Revenue Million Forecast, by Production Analysis 2020 & 2033
- Table 2: Global Cashew Industry Volume Metric Tons Forecast, by Production Analysis 2020 & 2033
- Table 3: Global Cashew Industry Revenue Million Forecast, by Consumption Analysis 2020 & 2033
- Table 4: Global Cashew Industry Volume Metric Tons Forecast, by Consumption Analysis 2020 & 2033
- Table 5: Global Cashew Industry Revenue Million Forecast, by Import Market Analysis (Value & Volume) 2020 & 2033
- Table 6: Global Cashew Industry Volume Metric Tons Forecast, by Import Market Analysis (Value & Volume) 2020 & 2033
- Table 7: Global Cashew Industry Revenue Million Forecast, by Export Market Analysis (Value & Volume) 2020 & 2033
- Table 8: Global Cashew Industry Volume Metric Tons Forecast, by Export Market Analysis (Value & Volume) 2020 & 2033
- Table 9: Global Cashew Industry Revenue Million Forecast, by Price Trend Analysis 2020 & 2033
- Table 10: Global Cashew Industry Volume Metric Tons Forecast, by Price Trend Analysis 2020 & 2033
- Table 11: Global Cashew Industry Revenue Million Forecast, by Region 2020 & 2033
- Table 12: Global Cashew Industry Volume Metric Tons Forecast, by Region 2020 & 2033
- Table 13: Global Cashew Industry Revenue Million Forecast, by Production Analysis 2020 & 2033
- Table 14: Global Cashew Industry Volume Metric Tons Forecast, by Production Analysis 2020 & 2033
- Table 15: Global Cashew Industry Revenue Million Forecast, by Consumption Analysis 2020 & 2033
- Table 16: Global Cashew Industry Volume Metric Tons Forecast, by Consumption Analysis 2020 & 2033
- Table 17: Global Cashew Industry Revenue Million Forecast, by Import Market Analysis (Value & Volume) 2020 & 2033
- Table 18: Global Cashew Industry Volume Metric Tons Forecast, by Import Market Analysis (Value & Volume) 2020 & 2033
- Table 19: Global Cashew Industry Revenue Million Forecast, by Export Market Analysis (Value & Volume) 2020 & 2033
- Table 20: Global Cashew Industry Volume Metric Tons Forecast, by Export Market Analysis (Value & Volume) 2020 & 2033
- Table 21: Global Cashew Industry Revenue Million Forecast, by Price Trend Analysis 2020 & 2033
- Table 22: Global Cashew Industry Volume Metric Tons Forecast, by Price Trend Analysis 2020 & 2033
- Table 23: Global Cashew Industry Revenue Million Forecast, by Country 2020 & 2033
- Table 24: Global Cashew Industry Volume Metric Tons Forecast, by Country 2020 & 2033
- Table 25: United States Cashew Industry Revenue (Million) Forecast, by Application 2020 & 2033
- Table 26: United States Cashew Industry Volume (Metric Tons) Forecast, by Application 2020 & 2033
- Table 27: Canada Cashew Industry Revenue (Million) Forecast, by Application 2020 & 2033
- Table 28: Canada Cashew Industry Volume (Metric Tons) Forecast, by Application 2020 & 2033
- Table 29: Mexico Cashew Industry Revenue (Million) Forecast, by Application 2020 & 2033
- Table 30: Mexico Cashew Industry Volume (Metric Tons) Forecast, by Application 2020 & 2033
- Table 31: Global Cashew Industry Revenue Million Forecast, by Production Analysis 2020 & 2033
- Table 32: Global Cashew Industry Volume Metric Tons Forecast, by Production Analysis 2020 & 2033
- Table 33: Global Cashew Industry Revenue Million Forecast, by Consumption Analysis 2020 & 2033
- Table 34: Global Cashew Industry Volume Metric Tons Forecast, by Consumption Analysis 2020 & 2033
- Table 35: Global Cashew Industry Revenue Million Forecast, by Import Market Analysis (Value & Volume) 2020 & 2033
- Table 36: Global Cashew Industry Volume Metric Tons Forecast, by Import Market Analysis (Value & Volume) 2020 & 2033
- Table 37: Global Cashew Industry Revenue Million Forecast, by Export Market Analysis (Value & Volume) 2020 & 2033
- Table 38: Global Cashew Industry Volume Metric Tons Forecast, by Export Market Analysis (Value & Volume) 2020 & 2033
- Table 39: Global Cashew Industry Revenue Million Forecast, by Price Trend Analysis 2020 & 2033
- Table 40: Global Cashew Industry Volume Metric Tons Forecast, by Price Trend Analysis 2020 & 2033
- Table 41: Global Cashew Industry Revenue Million Forecast, by Country 2020 & 2033
- Table 42: Global Cashew Industry Volume Metric Tons Forecast, by Country 2020 & 2033
- Table 43: Brazil Cashew Industry Revenue (Million) Forecast, by Application 2020 & 2033
- Table 44: Brazil Cashew Industry Volume (Metric Tons) Forecast, by Application 2020 & 2033
- Table 45: Argentina Cashew Industry Revenue (Million) Forecast, by Application 2020 & 2033
- Table 46: Argentina Cashew Industry Volume (Metric Tons) Forecast, by Application 2020 & 2033
- Table 47: Rest of South America Cashew Industry Revenue (Million) Forecast, by Application 2020 & 2033
- Table 48: Rest of South America Cashew Industry Volume (Metric Tons) Forecast, by Application 2020 & 2033
- Table 49: Global Cashew Industry Revenue Million Forecast, by Production Analysis 2020 & 2033
- Table 50: Global Cashew Industry Volume Metric Tons Forecast, by Production Analysis 2020 & 2033
- Table 51: Global Cashew Industry Revenue Million Forecast, by Consumption Analysis 2020 & 2033
- Table 52: Global Cashew Industry Volume Metric Tons Forecast, by Consumption Analysis 2020 & 2033
- Table 53: Global Cashew Industry Revenue Million Forecast, by Import Market Analysis (Value & Volume) 2020 & 2033
- Table 54: Global Cashew Industry Volume Metric Tons Forecast, by Import Market Analysis (Value & Volume) 2020 & 2033
- Table 55: Global Cashew Industry Revenue Million Forecast, by Export Market Analysis (Value & Volume) 2020 & 2033
- Table 56: Global Cashew Industry Volume Metric Tons Forecast, by Export Market Analysis (Value & Volume) 2020 & 2033
- Table 57: Global Cashew Industry Revenue Million Forecast, by Price Trend Analysis 2020 & 2033
- Table 58: Global Cashew Industry Volume Metric Tons Forecast, by Price Trend Analysis 2020 & 2033
- Table 59: Global Cashew Industry Revenue Million Forecast, by Country 2020 & 2033
- Table 60: Global Cashew Industry Volume Metric Tons Forecast, by Country 2020 & 2033
- Table 61: United Kingdom Cashew Industry Revenue (Million) Forecast, by Application 2020 & 2033
- Table 62: United Kingdom Cashew Industry Volume (Metric Tons) Forecast, by Application 2020 & 2033
- Table 63: Germany Cashew Industry Revenue (Million) Forecast, by Application 2020 & 2033
- Table 64: Germany Cashew Industry Volume (Metric Tons) Forecast, by Application 2020 & 2033
- Table 65: France Cashew Industry Revenue (Million) Forecast, by Application 2020 & 2033
- Table 66: France Cashew Industry Volume (Metric Tons) Forecast, by Application 2020 & 2033
- Table 67: Italy Cashew Industry Revenue (Million) Forecast, by Application 2020 & 2033
- Table 68: Italy Cashew Industry Volume (Metric Tons) Forecast, by Application 2020 & 2033
- Table 69: Spain Cashew Industry Revenue (Million) Forecast, by Application 2020 & 2033
- Table 70: Spain Cashew Industry Volume (Metric Tons) Forecast, by Application 2020 & 2033
- Table 71: Russia Cashew Industry Revenue (Million) Forecast, by Application 2020 & 2033
- Table 72: Russia Cashew Industry Volume (Metric Tons) Forecast, by Application 2020 & 2033
- Table 73: Benelux Cashew Industry Revenue (Million) Forecast, by Application 2020 & 2033
- Table 74: Benelux Cashew Industry Volume (Metric Tons) Forecast, by Application 2020 & 2033
- Table 75: Nordics Cashew Industry Revenue (Million) Forecast, by Application 2020 & 2033
- Table 76: Nordics Cashew Industry Volume (Metric Tons) Forecast, by Application 2020 & 2033
- Table 77: Rest of Europe Cashew Industry Revenue (Million) Forecast, by Application 2020 & 2033
- Table 78: Rest of Europe Cashew Industry Volume (Metric Tons) Forecast, by Application 2020 & 2033
- Table 79: Global Cashew Industry Revenue Million Forecast, by Production Analysis 2020 & 2033
- Table 80: Global Cashew Industry Volume Metric Tons Forecast, by Production Analysis 2020 & 2033
- Table 81: Global Cashew Industry Revenue Million Forecast, by Consumption Analysis 2020 & 2033
- Table 82: Global Cashew Industry Volume Metric Tons Forecast, by Consumption Analysis 2020 & 2033
- Table 83: Global Cashew Industry Revenue Million Forecast, by Import Market Analysis (Value & Volume) 2020 & 2033
- Table 84: Global Cashew Industry Volume Metric Tons Forecast, by Import Market Analysis (Value & Volume) 2020 & 2033
- Table 85: Global Cashew Industry Revenue Million Forecast, by Export Market Analysis (Value & Volume) 2020 & 2033
- Table 86: Global Cashew Industry Volume Metric Tons Forecast, by Export Market Analysis (Value & Volume) 2020 & 2033
- Table 87: Global Cashew Industry Revenue Million Forecast, by Price Trend Analysis 2020 & 2033
- Table 88: Global Cashew Industry Volume Metric Tons Forecast, by Price Trend Analysis 2020 & 2033
- Table 89: Global Cashew Industry Revenue Million Forecast, by Country 2020 & 2033
- Table 90: Global Cashew Industry Volume Metric Tons Forecast, by Country 2020 & 2033
- Table 91: Turkey Cashew Industry Revenue (Million) Forecast, by Application 2020 & 2033
- Table 92: Turkey Cashew Industry Volume (Metric Tons) Forecast, by Application 2020 & 2033
- Table 93: Israel Cashew Industry Revenue (Million) Forecast, by Application 2020 & 2033
- Table 94: Israel Cashew Industry Volume (Metric Tons) Forecast, by Application 2020 & 2033
- Table 95: GCC Cashew Industry Revenue (Million) Forecast, by Application 2020 & 2033
- Table 96: GCC Cashew Industry Volume (Metric Tons) Forecast, by Application 2020 & 2033
- Table 97: North Africa Cashew Industry Revenue (Million) Forecast, by Application 2020 & 2033
- Table 98: North Africa Cashew Industry Volume (Metric Tons) Forecast, by Application 2020 & 2033
- Table 99: South Africa Cashew Industry Revenue (Million) Forecast, by Application 2020 & 2033
- Table 100: South Africa Cashew Industry Volume (Metric Tons) Forecast, by Application 2020 & 2033
- Table 101: Rest of Middle East & Africa Cashew Industry Revenue (Million) Forecast, by Application 2020 & 2033
- Table 102: Rest of Middle East & Africa Cashew Industry Volume (Metric Tons) Forecast, by Application 2020 & 2033
- Table 103: Global Cashew Industry Revenue Million Forecast, by Production Analysis 2020 & 2033
- Table 104: Global Cashew Industry Volume Metric Tons Forecast, by Production Analysis 2020 & 2033
- Table 105: Global Cashew Industry Revenue Million Forecast, by Consumption Analysis 2020 & 2033
- Table 106: Global Cashew Industry Volume Metric Tons Forecast, by Consumption Analysis 2020 & 2033
- Table 107: Global Cashew Industry Revenue Million Forecast, by Import Market Analysis (Value & Volume) 2020 & 2033
- Table 108: Global Cashew Industry Volume Metric Tons Forecast, by Import Market Analysis (Value & Volume) 2020 & 2033
- Table 109: Global Cashew Industry Revenue Million Forecast, by Export Market Analysis (Value & Volume) 2020 & 2033
- Table 110: Global Cashew Industry Volume Metric Tons Forecast, by Export Market Analysis (Value & Volume) 2020 & 2033
- Table 111: Global Cashew Industry Revenue Million Forecast, by Price Trend Analysis 2020 & 2033
- Table 112: Global Cashew Industry Volume Metric Tons Forecast, by Price Trend Analysis 2020 & 2033
- Table 113: Global Cashew Industry Revenue Million Forecast, by Country 2020 & 2033
- Table 114: Global Cashew Industry Volume Metric Tons Forecast, by Country 2020 & 2033
- Table 115: China Cashew Industry Revenue (Million) Forecast, by Application 2020 & 2033
- Table 116: China Cashew Industry Volume (Metric Tons) Forecast, by Application 2020 & 2033
- Table 117: India Cashew Industry Revenue (Million) Forecast, by Application 2020 & 2033
- Table 118: India Cashew Industry Volume (Metric Tons) Forecast, by Application 2020 & 2033
- Table 119: Japan Cashew Industry Revenue (Million) Forecast, by Application 2020 & 2033
- Table 120: Japan Cashew Industry Volume (Metric Tons) Forecast, by Application 2020 & 2033
- Table 121: South Korea Cashew Industry Revenue (Million) Forecast, by Application 2020 & 2033
- Table 122: South Korea Cashew Industry Volume (Metric Tons) Forecast, by Application 2020 & 2033
- Table 123: ASEAN Cashew Industry Revenue (Million) Forecast, by Application 2020 & 2033
- Table 124: ASEAN Cashew Industry Volume (Metric Tons) Forecast, by Application 2020 & 2033
- Table 125: Oceania Cashew Industry Revenue (Million) Forecast, by Application 2020 & 2033
- Table 126: Oceania Cashew Industry Volume (Metric Tons) Forecast, by Application 2020 & 2033
- Table 127: Rest of Asia Pacific Cashew Industry Revenue (Million) Forecast, by Application 2020 & 2033
- Table 128: Rest of Asia Pacific Cashew Industry Volume (Metric Tons) Forecast, by Application 2020 & 2033
Frequently Asked Questions
1. What is the projected Compound Annual Growth Rate (CAGR) of the Cashew Industry?
The projected CAGR is approximately 4.60%.
2. Which companies are prominent players in the Cashew Industry?
Key companies in the market include The Hershey Company, Olam International, Vietnam Cashew Association , Indian Cashew Exporters Association.
3. What are the main segments of the Cashew Industry?
The market segments include Production Analysis, Consumption Analysis, Import Market Analysis (Value & Volume), Export Market Analysis (Value & Volume), Price Trend Analysis.
4. Can you provide details about the market size?
The market size is estimated to be USD 8.78 Million as of 2022.
5. What are some drivers contributing to market growth?
Rising Consumption of Cashew Nuts as a Healthy Snack; Increasing Government initiatives; Growing Cashew Nut Imports in The United States.
6. What are the notable trends driving market growth?
Increasing Government Initiatives to Boost Cashew Production.
7. Are there any restraints impacting market growth?
Hazardous Climatic Condition Hinders Cashew Production; Stringent Regulations Related To Food Quality Standards.
8. Can you provide examples of recent developments in the market?
N/A
9. What pricing options are available for accessing the report?
Pricing options include single-user, multi-user, and enterprise licenses priced at USD 3800, USD 4500, and USD 5800 respectively.
10. Is the market size provided in terms of value or volume?
The market size is provided in terms of value, measured in Million and volume, measured in Metric Tons.
11. Are there any specific market keywords associated with the report?
Yes, the market keyword associated with the report is "Cashew Industry," which aids in identifying and referencing the specific market segment covered.
12. How do I determine which pricing option suits my needs best?
The pricing options vary based on user requirements and access needs. Individual users may opt for single-user licenses, while businesses requiring broader access may choose multi-user or enterprise licenses for cost-effective access to the report.
13. Are there any additional resources or data provided in the Cashew Industry report?
While the report offers comprehensive insights, it's advisable to review the specific contents or supplementary materials provided to ascertain if additional resources or data are available.
14. How can I stay updated on further developments or reports in the Cashew Industry?
To stay informed about further developments, trends, and reports in the Cashew Industry, consider subscribing to industry newsletters, following relevant companies and organizations, or regularly checking reputable industry news sources and publications.
Methodology
Step 1 - Identification of Relevant Samples Size from Population Database


Step 2 - Approaches for Defining Global Market Size (Value, Volume* & Price*)

Note*: In applicable scenarios
Step 3 - Data Sources
Primary Research
- Web Analytics
- Survey Reports
- Research Institute
- Latest Research Reports
- Opinion Leaders
Secondary Research
- Annual Reports
- White Paper
- Latest Press Release
- Industry Association
- Paid Database
- Investor Presentations

Step 4 - Data Triangulation
Involves using different sources of information in order to increase the validity of a study
These sources are likely to be stakeholders in a program - participants, other researchers, program staff, other community members, and so on.
Then we put all data in single framework & apply various statistical tools to find out the dynamic on the market.
During the analysis stage, feedback from the stakeholder groups would be compared to determine areas of agreement as well as areas of divergence