

Key Insights
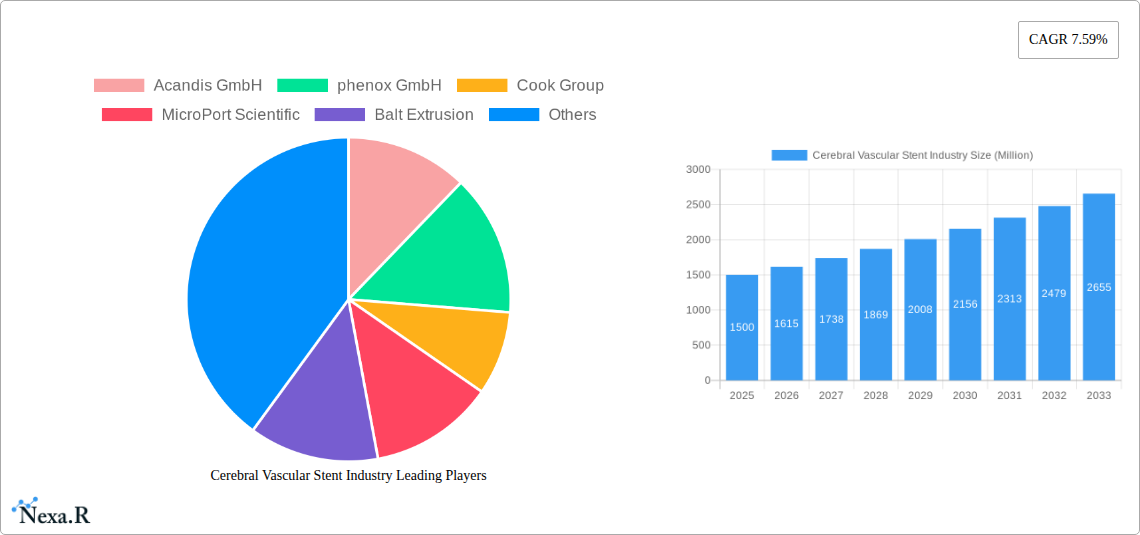
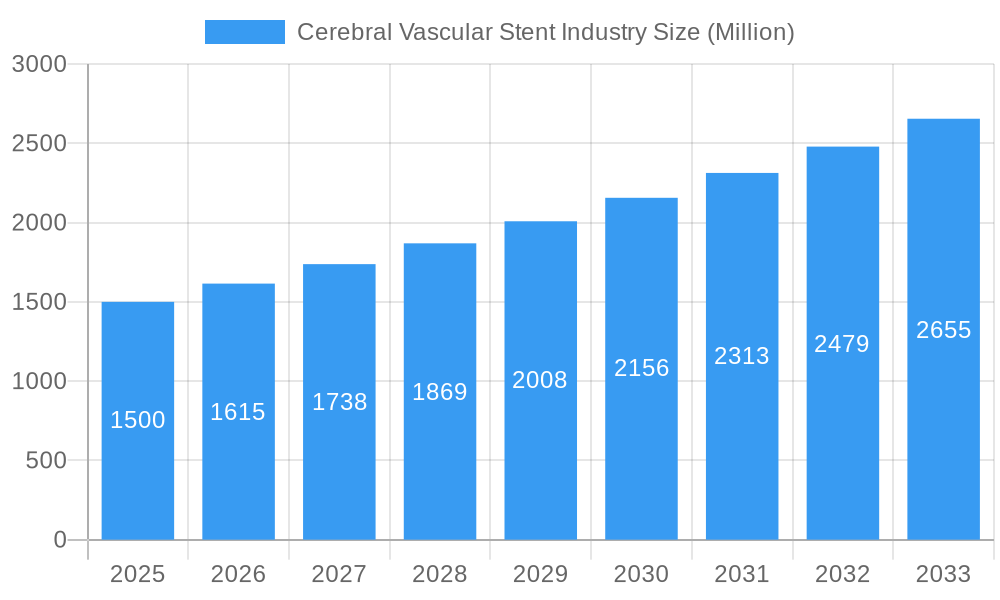
The cerebral vascular stent market, valued at $1.5 billion in 2025, is projected to achieve a robust compound annual growth rate (CAGR) of 7% from 2025 to 2033. This expansion is propelled by the increasing incidence of cerebrovascular diseases such as intracranial stenosis and brain aneurysms, amplified by a growing global elderly population. Technological advancements, including self-expanding stents and stent-assisted coil embolization, are providing less invasive treatment options, thereby stimulating market demand. Furthermore, the widespread adoption of advanced imaging technologies for precise diagnosis and enhanced surgical accuracy is improving the efficacy of cerebral vascular stents. The market is segmented by stent type (self-expanding, balloon-expanding, stent-assisted coil embolization), application (intracranial stenosis, brain aneurysm), and end-user (hospitals, ambulatory surgery centers). Hospitals currently lead the end-user segment due to procedure complexity and specialized infrastructure needs. However, ambulatory surgery centers are anticipated to grow as minimally invasive techniques become more accessible. The competitive landscape is dynamic, featuring key players like Medtronic, Boston Scientific, Johnson & Johnson, and MicroPort Scientific Corporation focusing on innovation and strategic alliances.
Cerebral Vascular Stent Industry Market Size (In Billion)
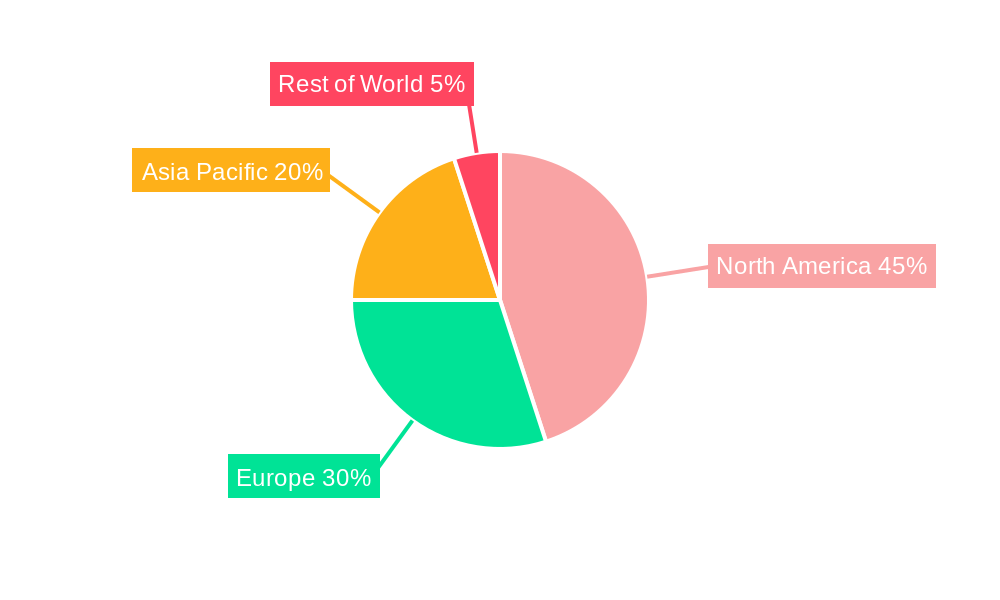
Geographically, North America, led by the United States, is expected to retain a significant market share owing to its advanced healthcare infrastructure and high spending. The Asia-Pacific region is poised for rapid growth, driven by improving healthcare access and a substantial aging demographic. Europe will also be a key contributor, with Germany and the United Kingdom leading regional expansion. Market challenges include high procedural costs, potential complications, and the availability of alternative treatments. Nevertheless, the cerebral vascular stent market demonstrates considerable growth potential. Continued innovation, increased awareness, and enhanced access to advanced treatment modalities will be pivotal in shaping its future.
Cerebral Vascular Stent Industry Company Market Share
Cerebral Vascular Stent Market Report: 2019-2033
This comprehensive report provides a detailed analysis of the Cerebral Vascular Stent market, encompassing historical data (2019-2024), current estimations (2025), and future projections (2025-2033). We delve into market dynamics, growth trends, regional dominance, product landscapes, and key players, equipping you with the insights needed to navigate this evolving industry. The report analyzes the parent market of medical devices and the child market of neurovascular devices, providing a complete picture of market size and growth potential. Values presented are in million units.
Cerebral Vascular Stent Industry Market Dynamics & Structure
This section dissects the competitive landscape of the cerebral vascular stent market, examining market concentration, technological advancements, regulatory influences, and competitive dynamics. We analyze the interplay of these factors to determine the overall health and potential of the market. The report assesses the market concentration through Herfindahl-Hirschman Index (HHI) calculation, providing a quantitative measure of market competitiveness.
- Market Concentration: The global cerebral vascular stent market exhibits a moderately concentrated structure, with a xx% market share held by the top five players in 2024, indicating significant competitive activity. An analysis of market share by key players like Medtronic, Boston Scientific, and MicroPort Scientific will be included.
- Technological Innovation: Continuous advancements in stent design, materials (e.g., biocompatible polymers), and delivery systems are major drivers. Innovation focuses on improved efficacy, reduced complications, and enhanced patient outcomes.
- Regulatory Frameworks: Stringent regulatory approvals (e.g., FDA, CE mark) influence market entry and product development, creating barriers to entry for smaller companies.
- Competitive Product Substitutes: Emerging technologies, such as drug-coated balloons and other minimally invasive techniques, pose competitive pressure, challenging the dominance of stents.
- End-User Demographics: The aging global population and rising prevalence of cerebrovascular diseases fuel market growth, with a particular emphasis on hospitals and ambulatory surgery centers.
- M&A Trends: A moderate level of M&A activity was observed in the historical period with xx deals recorded, contributing to market consolidation and technological integration.
Cerebral Vascular Stent Industry Growth Trends & Insights
This section leverages advanced analytical methodologies to comprehensively evaluate the market size, growth trajectory, and influencing factors in the cerebral vascular stent market.
The report utilizes a combination of top-down and bottom-up approaches to arrive at accurate estimations of the market size and growth. The historical period shows a CAGR of xx% from 2019 to 2024, with the market size reaching xx million units in 2024. A detailed projection for the forecast period (2025-2033) is provided, including segment-specific CAGRs and market penetration analysis. Factors influencing market growth will be discussed in detail. These include changing demographics, rising prevalence of cerebrovascular diseases, increased healthcare spending, growing awareness of endovascular treatments, technological advancements, and expansion of healthcare infrastructure. Furthermore, we will analyse the adoption rates of different types of cerebral vascular stents, based on factors such as efficacy, safety, and cost-effectiveness.
Dominant Regions, Countries, or Segments in Cerebral Vascular Stent Industry
This section identifies the leading regions, countries, and segments within the cerebral vascular stent market driving its expansion.
- By Type: The self-expanding stent segment dominates, owing to its ease of deployment and superior conformability, with an estimated xx million units in 2025. Balloon expanding stents hold a significant share as well, driven by their established track record. Stent-assisted coil embolization is a niche segment with projected growth.
- By Application: Intracranial stenosis represents the largest application segment, owing to its high prevalence. Brain aneurysm treatment is another significant segment experiencing steady growth.
- By End-User: Hospitals are the leading end-users, benefiting from specialized equipment and expertise. Ambulatory surgery centers are experiencing growth due to cost-effectiveness and shorter recovery times.
- Regional Dominance: North America holds a major share of the market, driven by high healthcare expenditure, advanced infrastructure, and technological adoption. Europe and Asia-Pacific are also significant markets exhibiting considerable growth potential. Specific countries like the US, Germany, Japan, and China will be explored in detail.
Cerebral Vascular Stent Industry Product Landscape
The cerebral vascular stent market showcases a range of products with varying designs, materials, and delivery systems. Self-expanding stents offer advantages in terms of ease of deployment and conformability. Balloon-expanding stents provide precise placement and controlled expansion. Stent-assisted coil embolization combines the benefits of stents and coils for treating complex aneurysms. Recent innovations focus on biocompatible coatings to reduce thrombosis and improve long-term outcomes. Unique selling propositions include improved deliverability, enhanced radial strength, and reduced procedural complications.
Key Drivers, Barriers & Challenges in Cerebral Vascular Stent Industry
Key Drivers:
- Technological advancements, especially in stent design and materials, leading to improved efficacy and safety.
- The rising prevalence of cerebrovascular diseases among aging populations.
- Increasing healthcare expenditure and investments in medical infrastructure.
Challenges & Restraints:
- Stringent regulatory pathways for new product approvals increase time-to-market and development costs.
- High procedure costs and insurance coverage limitations restrict market access in some regions.
- The presence of alternative treatment options, such as drug-coated balloons, creates competitive pressure. This competitive pressure is estimated to negatively impact market growth by xx% over the next five years.
Emerging Opportunities in Cerebral Vascular Stent Industry
- Untapped markets in emerging economies present significant growth potential.
- Growing demand for minimally invasive procedures and improved patient outcomes.
- Development of novel stent designs and materials with enhanced functionalities, such as drug-eluting stents.
Growth Accelerators in the Cerebral Vascular Stent Industry Industry
Technological innovations, including the development of advanced materials and designs that improve stent deliverability, flexibility, and biocompatibility, will be a key driver of long-term growth. Strategic partnerships and collaborations between device manufacturers and healthcare providers can significantly boost market penetration. Expansion into emerging markets with high unmet needs and favourable regulatory environments will also fuel market growth.
Key Players Shaping the Cerebral Vascular Stent Industry Market
- Acandis GmbH
- phenox GmbH
- Cook Group
- MicroPort Scientific
- Balt Extrusion
- Terumo Corporation
- Johnson & Johnson Services Inc
- Medtronic Plc
- MicroPort Scientific Corporation
- Stryker Corporation
- Boston Scientific Corporation
- Penumbra Inc
Notable Milestones in Cerebral Vascular Stent Industry Sector
- September 2022: Wallaby/phenox launched the pEGASUS HPC stent with anti-thrombogenic coating for intracranial aneurysms and ICAD.
- June 2022: Medtronic launched the CE-marked Pipeline Vantage flow diverter with Shield Technology for brain aneurysm treatment.
In-Depth Cerebral Vascular Stent Industry Market Outlook
The cerebral vascular stent market is poised for robust growth driven by technological advancements, increasing prevalence of cerebrovascular diseases, and expanding healthcare infrastructure. Strategic partnerships, market expansions into emerging economies, and innovative product development will further propel market growth. The forecast period (2025-2033) projects a significant increase in market size and adoption rates, presenting lucrative opportunities for established players and new entrants alike.
Cerebral Vascular Stent Industry Segmentation
-
1. Type
- 1.1. Self-expanding Stents
- 1.2. Balloon Expanding Stents
- 1.3. Stent-assisted Coil Embolization
-
2. Application
- 2.1. Intracranial Stenosis
- 2.2. Brain Aneurysm
-
3. End-User
- 3.1. Hospitals
- 3.2. Ambulatory Surgery Centers
- 3.3. Others
Cerebral Vascular Stent Industry Segmentation By Geography
-
1. North America
- 1.1. United States
- 1.2. Canada
- 1.3. Mexico
-
2. Europe
- 2.1. Germany
- 2.2. United Kingdom
- 2.3. France
- 2.4. Italy
- 2.5. Spain
- 2.6. Rest of Europe
-
3. Asia Pacific
- 3.1. China
- 3.2. Japan
- 3.3. India
- 3.4. Australia
- 3.5. South Korea
- 3.6. Rest of Asia Pacific
-
4. Middle East and Africa
- 4.1. GCC
- 4.2. South Africa
- 4.3. Rest of Middle East and Africa
-
5. South America
- 5.1. Brazil
- 5.2. Argentina
- 5.3. Rest of South America
Cerebral Vascular Stent Industry Regional Market Share
Geographic Coverage of Cerebral Vascular Stent Industry
Cerebral Vascular Stent Industry REPORT HIGHLIGHTS
| Aspects | Details |
|---|---|
| Study Period | 2020-2034 |
| Base Year | 2025 |
| Estimated Year | 2026 |
| Forecast Period | 2026-2034 |
| Historical Period | 2020-2025 |
| Growth Rate | CAGR of 7% from 2020-2034 |
| Segmentation |
|
Table of Contents
- 1. Introduction
- 1.1. Research Scope
- 1.2. Market Segmentation
- 1.3. Research Methodology
- 1.4. Definitions and Assumptions
- 2. Executive Summary
- 2.1. Introduction
- 3. Market Dynamics
- 3.1. Introduction
- 3.2. Market Drivers
- 3.2.1. Increasing Demand for Minimally Invasive Intracranial Surgeries; Rising Prevalence of Stroke and Increasing Geriatric population
- 3.3. Market Restrains
- 3.3.1. Lack of Skilled Professional for Operating using Intracranial Stents; Cerebrovascular Complications Related to Intracranial Stenting
- 3.4. Market Trends
- 3.4.1. Brain Aneurysm Segment Expects to Register a Highest CAGR Over the Forecast Period
- 4. Market Factor Analysis
- 4.1. Porters Five Forces
- 4.2. Supply/Value Chain
- 4.3. PESTEL analysis
- 4.4. Market Entropy
- 4.5. Patent/Trademark Analysis
- 5. Global Cerebral Vascular Stent Industry Analysis, Insights and Forecast, 2020-2032
- 5.1. Market Analysis, Insights and Forecast - by Type
- 5.1.1. Self-expanding Stents
- 5.1.2. Balloon Expanding Stents
- 5.1.3. Stent-assisted Coil Embolization
- 5.2. Market Analysis, Insights and Forecast - by Application
- 5.2.1. Intracranial Stenosis
- 5.2.2. Brain Aneurysm
- 5.3. Market Analysis, Insights and Forecast - by End-User
- 5.3.1. Hospitals
- 5.3.2. Ambulatory Surgery Centers
- 5.3.3. Others
- 5.4. Market Analysis, Insights and Forecast - by Region
- 5.4.1. North America
- 5.4.2. Europe
- 5.4.3. Asia Pacific
- 5.4.4. Middle East and Africa
- 5.4.5. South America
- 5.1. Market Analysis, Insights and Forecast - by Type
- 6. North America Cerebral Vascular Stent Industry Analysis, Insights and Forecast, 2020-2032
- 6.1. Market Analysis, Insights and Forecast - by Type
- 6.1.1. Self-expanding Stents
- 6.1.2. Balloon Expanding Stents
- 6.1.3. Stent-assisted Coil Embolization
- 6.2. Market Analysis, Insights and Forecast - by Application
- 6.2.1. Intracranial Stenosis
- 6.2.2. Brain Aneurysm
- 6.3. Market Analysis, Insights and Forecast - by End-User
- 6.3.1. Hospitals
- 6.3.2. Ambulatory Surgery Centers
- 6.3.3. Others
- 6.1. Market Analysis, Insights and Forecast - by Type
- 7. Europe Cerebral Vascular Stent Industry Analysis, Insights and Forecast, 2020-2032
- 7.1. Market Analysis, Insights and Forecast - by Type
- 7.1.1. Self-expanding Stents
- 7.1.2. Balloon Expanding Stents
- 7.1.3. Stent-assisted Coil Embolization
- 7.2. Market Analysis, Insights and Forecast - by Application
- 7.2.1. Intracranial Stenosis
- 7.2.2. Brain Aneurysm
- 7.3. Market Analysis, Insights and Forecast - by End-User
- 7.3.1. Hospitals
- 7.3.2. Ambulatory Surgery Centers
- 7.3.3. Others
- 7.1. Market Analysis, Insights and Forecast - by Type
- 8. Asia Pacific Cerebral Vascular Stent Industry Analysis, Insights and Forecast, 2020-2032
- 8.1. Market Analysis, Insights and Forecast - by Type
- 8.1.1. Self-expanding Stents
- 8.1.2. Balloon Expanding Stents
- 8.1.3. Stent-assisted Coil Embolization
- 8.2. Market Analysis, Insights and Forecast - by Application
- 8.2.1. Intracranial Stenosis
- 8.2.2. Brain Aneurysm
- 8.3. Market Analysis, Insights and Forecast - by End-User
- 8.3.1. Hospitals
- 8.3.2. Ambulatory Surgery Centers
- 8.3.3. Others
- 8.1. Market Analysis, Insights and Forecast - by Type
- 9. Middle East and Africa Cerebral Vascular Stent Industry Analysis, Insights and Forecast, 2020-2032
- 9.1. Market Analysis, Insights and Forecast - by Type
- 9.1.1. Self-expanding Stents
- 9.1.2. Balloon Expanding Stents
- 9.1.3. Stent-assisted Coil Embolization
- 9.2. Market Analysis, Insights and Forecast - by Application
- 9.2.1. Intracranial Stenosis
- 9.2.2. Brain Aneurysm
- 9.3. Market Analysis, Insights and Forecast - by End-User
- 9.3.1. Hospitals
- 9.3.2. Ambulatory Surgery Centers
- 9.3.3. Others
- 9.1. Market Analysis, Insights and Forecast - by Type
- 10. South America Cerebral Vascular Stent Industry Analysis, Insights and Forecast, 2020-2032
- 10.1. Market Analysis, Insights and Forecast - by Type
- 10.1.1. Self-expanding Stents
- 10.1.2. Balloon Expanding Stents
- 10.1.3. Stent-assisted Coil Embolization
- 10.2. Market Analysis, Insights and Forecast - by Application
- 10.2.1. Intracranial Stenosis
- 10.2.2. Brain Aneurysm
- 10.3. Market Analysis, Insights and Forecast - by End-User
- 10.3.1. Hospitals
- 10.3.2. Ambulatory Surgery Centers
- 10.3.3. Others
- 10.1. Market Analysis, Insights and Forecast - by Type
- 11. Competitive Analysis
- 11.1. Global Market Share Analysis 2025
- 11.2. Company Profiles
- 11.2.1 Acandis GmbH
- 11.2.1.1. Overview
- 11.2.1.2. Products
- 11.2.1.3. SWOT Analysis
- 11.2.1.4. Recent Developments
- 11.2.1.5. Financials (Based on Availability)
- 11.2.2 phenox GmbH
- 11.2.2.1. Overview
- 11.2.2.2. Products
- 11.2.2.3. SWOT Analysis
- 11.2.2.4. Recent Developments
- 11.2.2.5. Financials (Based on Availability)
- 11.2.3 Cook Group
- 11.2.3.1. Overview
- 11.2.3.2. Products
- 11.2.3.3. SWOT Analysis
- 11.2.3.4. Recent Developments
- 11.2.3.5. Financials (Based on Availability)
- 11.2.4 MicroPort Scientific
- 11.2.4.1. Overview
- 11.2.4.2. Products
- 11.2.4.3. SWOT Analysis
- 11.2.4.4. Recent Developments
- 11.2.4.5. Financials (Based on Availability)
- 11.2.5 Balt Extrusion
- 11.2.5.1. Overview
- 11.2.5.2. Products
- 11.2.5.3. SWOT Analysis
- 11.2.5.4. Recent Developments
- 11.2.5.5. Financials (Based on Availability)
- 11.2.6 Terumo Corporation
- 11.2.6.1. Overview
- 11.2.6.2. Products
- 11.2.6.3. SWOT Analysis
- 11.2.6.4. Recent Developments
- 11.2.6.5. Financials (Based on Availability)
- 11.2.7 Johnson & Johnson Services Inc
- 11.2.7.1. Overview
- 11.2.7.2. Products
- 11.2.7.3. SWOT Analysis
- 11.2.7.4. Recent Developments
- 11.2.7.5. Financials (Based on Availability)
- 11.2.8 Medtronic Plc
- 11.2.8.1. Overview
- 11.2.8.2. Products
- 11.2.8.3. SWOT Analysis
- 11.2.8.4. Recent Developments
- 11.2.8.5. Financials (Based on Availability)
- 11.2.9 MicroPort Scientific Corporation
- 11.2.9.1. Overview
- 11.2.9.2. Products
- 11.2.9.3. SWOT Analysis
- 11.2.9.4. Recent Developments
- 11.2.9.5. Financials (Based on Availability)
- 11.2.10 Stryker Corporation
- 11.2.10.1. Overview
- 11.2.10.2. Products
- 11.2.10.3. SWOT Analysis
- 11.2.10.4. Recent Developments
- 11.2.10.5. Financials (Based on Availability)
- 11.2.11 Boston Scientific Corporation
- 11.2.11.1. Overview
- 11.2.11.2. Products
- 11.2.11.3. SWOT Analysis
- 11.2.11.4. Recent Developments
- 11.2.11.5. Financials (Based on Availability)
- 11.2.12 Penumbra Inc
- 11.2.12.1. Overview
- 11.2.12.2. Products
- 11.2.12.3. SWOT Analysis
- 11.2.12.4. Recent Developments
- 11.2.12.5. Financials (Based on Availability)
- 11.2.1 Acandis GmbH
List of Figures
- Figure 1: Global Cerebral Vascular Stent Industry Revenue Breakdown (billion, %) by Region 2025 & 2033
- Figure 2: Global Cerebral Vascular Stent Industry Volume Breakdown (K Unit, %) by Region 2025 & 2033
- Figure 3: North America Cerebral Vascular Stent Industry Revenue (billion), by Type 2025 & 2033
- Figure 4: North America Cerebral Vascular Stent Industry Volume (K Unit), by Type 2025 & 2033
- Figure 5: North America Cerebral Vascular Stent Industry Revenue Share (%), by Type 2025 & 2033
- Figure 6: North America Cerebral Vascular Stent Industry Volume Share (%), by Type 2025 & 2033
- Figure 7: North America Cerebral Vascular Stent Industry Revenue (billion), by Application 2025 & 2033
- Figure 8: North America Cerebral Vascular Stent Industry Volume (K Unit), by Application 2025 & 2033
- Figure 9: North America Cerebral Vascular Stent Industry Revenue Share (%), by Application 2025 & 2033
- Figure 10: North America Cerebral Vascular Stent Industry Volume Share (%), by Application 2025 & 2033
- Figure 11: North America Cerebral Vascular Stent Industry Revenue (billion), by End-User 2025 & 2033
- Figure 12: North America Cerebral Vascular Stent Industry Volume (K Unit), by End-User 2025 & 2033
- Figure 13: North America Cerebral Vascular Stent Industry Revenue Share (%), by End-User 2025 & 2033
- Figure 14: North America Cerebral Vascular Stent Industry Volume Share (%), by End-User 2025 & 2033
- Figure 15: North America Cerebral Vascular Stent Industry Revenue (billion), by Country 2025 & 2033
- Figure 16: North America Cerebral Vascular Stent Industry Volume (K Unit), by Country 2025 & 2033
- Figure 17: North America Cerebral Vascular Stent Industry Revenue Share (%), by Country 2025 & 2033
- Figure 18: North America Cerebral Vascular Stent Industry Volume Share (%), by Country 2025 & 2033
- Figure 19: Europe Cerebral Vascular Stent Industry Revenue (billion), by Type 2025 & 2033
- Figure 20: Europe Cerebral Vascular Stent Industry Volume (K Unit), by Type 2025 & 2033
- Figure 21: Europe Cerebral Vascular Stent Industry Revenue Share (%), by Type 2025 & 2033
- Figure 22: Europe Cerebral Vascular Stent Industry Volume Share (%), by Type 2025 & 2033
- Figure 23: Europe Cerebral Vascular Stent Industry Revenue (billion), by Application 2025 & 2033
- Figure 24: Europe Cerebral Vascular Stent Industry Volume (K Unit), by Application 2025 & 2033
- Figure 25: Europe Cerebral Vascular Stent Industry Revenue Share (%), by Application 2025 & 2033
- Figure 26: Europe Cerebral Vascular Stent Industry Volume Share (%), by Application 2025 & 2033
- Figure 27: Europe Cerebral Vascular Stent Industry Revenue (billion), by End-User 2025 & 2033
- Figure 28: Europe Cerebral Vascular Stent Industry Volume (K Unit), by End-User 2025 & 2033
- Figure 29: Europe Cerebral Vascular Stent Industry Revenue Share (%), by End-User 2025 & 2033
- Figure 30: Europe Cerebral Vascular Stent Industry Volume Share (%), by End-User 2025 & 2033
- Figure 31: Europe Cerebral Vascular Stent Industry Revenue (billion), by Country 2025 & 2033
- Figure 32: Europe Cerebral Vascular Stent Industry Volume (K Unit), by Country 2025 & 2033
- Figure 33: Europe Cerebral Vascular Stent Industry Revenue Share (%), by Country 2025 & 2033
- Figure 34: Europe Cerebral Vascular Stent Industry Volume Share (%), by Country 2025 & 2033
- Figure 35: Asia Pacific Cerebral Vascular Stent Industry Revenue (billion), by Type 2025 & 2033
- Figure 36: Asia Pacific Cerebral Vascular Stent Industry Volume (K Unit), by Type 2025 & 2033
- Figure 37: Asia Pacific Cerebral Vascular Stent Industry Revenue Share (%), by Type 2025 & 2033
- Figure 38: Asia Pacific Cerebral Vascular Stent Industry Volume Share (%), by Type 2025 & 2033
- Figure 39: Asia Pacific Cerebral Vascular Stent Industry Revenue (billion), by Application 2025 & 2033
- Figure 40: Asia Pacific Cerebral Vascular Stent Industry Volume (K Unit), by Application 2025 & 2033
- Figure 41: Asia Pacific Cerebral Vascular Stent Industry Revenue Share (%), by Application 2025 & 2033
- Figure 42: Asia Pacific Cerebral Vascular Stent Industry Volume Share (%), by Application 2025 & 2033
- Figure 43: Asia Pacific Cerebral Vascular Stent Industry Revenue (billion), by End-User 2025 & 2033
- Figure 44: Asia Pacific Cerebral Vascular Stent Industry Volume (K Unit), by End-User 2025 & 2033
- Figure 45: Asia Pacific Cerebral Vascular Stent Industry Revenue Share (%), by End-User 2025 & 2033
- Figure 46: Asia Pacific Cerebral Vascular Stent Industry Volume Share (%), by End-User 2025 & 2033
- Figure 47: Asia Pacific Cerebral Vascular Stent Industry Revenue (billion), by Country 2025 & 2033
- Figure 48: Asia Pacific Cerebral Vascular Stent Industry Volume (K Unit), by Country 2025 & 2033
- Figure 49: Asia Pacific Cerebral Vascular Stent Industry Revenue Share (%), by Country 2025 & 2033
- Figure 50: Asia Pacific Cerebral Vascular Stent Industry Volume Share (%), by Country 2025 & 2033
- Figure 51: Middle East and Africa Cerebral Vascular Stent Industry Revenue (billion), by Type 2025 & 2033
- Figure 52: Middle East and Africa Cerebral Vascular Stent Industry Volume (K Unit), by Type 2025 & 2033
- Figure 53: Middle East and Africa Cerebral Vascular Stent Industry Revenue Share (%), by Type 2025 & 2033
- Figure 54: Middle East and Africa Cerebral Vascular Stent Industry Volume Share (%), by Type 2025 & 2033
- Figure 55: Middle East and Africa Cerebral Vascular Stent Industry Revenue (billion), by Application 2025 & 2033
- Figure 56: Middle East and Africa Cerebral Vascular Stent Industry Volume (K Unit), by Application 2025 & 2033
- Figure 57: Middle East and Africa Cerebral Vascular Stent Industry Revenue Share (%), by Application 2025 & 2033
- Figure 58: Middle East and Africa Cerebral Vascular Stent Industry Volume Share (%), by Application 2025 & 2033
- Figure 59: Middle East and Africa Cerebral Vascular Stent Industry Revenue (billion), by End-User 2025 & 2033
- Figure 60: Middle East and Africa Cerebral Vascular Stent Industry Volume (K Unit), by End-User 2025 & 2033
- Figure 61: Middle East and Africa Cerebral Vascular Stent Industry Revenue Share (%), by End-User 2025 & 2033
- Figure 62: Middle East and Africa Cerebral Vascular Stent Industry Volume Share (%), by End-User 2025 & 2033
- Figure 63: Middle East and Africa Cerebral Vascular Stent Industry Revenue (billion), by Country 2025 & 2033
- Figure 64: Middle East and Africa Cerebral Vascular Stent Industry Volume (K Unit), by Country 2025 & 2033
- Figure 65: Middle East and Africa Cerebral Vascular Stent Industry Revenue Share (%), by Country 2025 & 2033
- Figure 66: Middle East and Africa Cerebral Vascular Stent Industry Volume Share (%), by Country 2025 & 2033
- Figure 67: South America Cerebral Vascular Stent Industry Revenue (billion), by Type 2025 & 2033
- Figure 68: South America Cerebral Vascular Stent Industry Volume (K Unit), by Type 2025 & 2033
- Figure 69: South America Cerebral Vascular Stent Industry Revenue Share (%), by Type 2025 & 2033
- Figure 70: South America Cerebral Vascular Stent Industry Volume Share (%), by Type 2025 & 2033
- Figure 71: South America Cerebral Vascular Stent Industry Revenue (billion), by Application 2025 & 2033
- Figure 72: South America Cerebral Vascular Stent Industry Volume (K Unit), by Application 2025 & 2033
- Figure 73: South America Cerebral Vascular Stent Industry Revenue Share (%), by Application 2025 & 2033
- Figure 74: South America Cerebral Vascular Stent Industry Volume Share (%), by Application 2025 & 2033
- Figure 75: South America Cerebral Vascular Stent Industry Revenue (billion), by End-User 2025 & 2033
- Figure 76: South America Cerebral Vascular Stent Industry Volume (K Unit), by End-User 2025 & 2033
- Figure 77: South America Cerebral Vascular Stent Industry Revenue Share (%), by End-User 2025 & 2033
- Figure 78: South America Cerebral Vascular Stent Industry Volume Share (%), by End-User 2025 & 2033
- Figure 79: South America Cerebral Vascular Stent Industry Revenue (billion), by Country 2025 & 2033
- Figure 80: South America Cerebral Vascular Stent Industry Volume (K Unit), by Country 2025 & 2033
- Figure 81: South America Cerebral Vascular Stent Industry Revenue Share (%), by Country 2025 & 2033
- Figure 82: South America Cerebral Vascular Stent Industry Volume Share (%), by Country 2025 & 2033
List of Tables
- Table 1: Global Cerebral Vascular Stent Industry Revenue billion Forecast, by Type 2020 & 2033
- Table 2: Global Cerebral Vascular Stent Industry Volume K Unit Forecast, by Type 2020 & 2033
- Table 3: Global Cerebral Vascular Stent Industry Revenue billion Forecast, by Application 2020 & 2033
- Table 4: Global Cerebral Vascular Stent Industry Volume K Unit Forecast, by Application 2020 & 2033
- Table 5: Global Cerebral Vascular Stent Industry Revenue billion Forecast, by End-User 2020 & 2033
- Table 6: Global Cerebral Vascular Stent Industry Volume K Unit Forecast, by End-User 2020 & 2033
- Table 7: Global Cerebral Vascular Stent Industry Revenue billion Forecast, by Region 2020 & 2033
- Table 8: Global Cerebral Vascular Stent Industry Volume K Unit Forecast, by Region 2020 & 2033
- Table 9: Global Cerebral Vascular Stent Industry Revenue billion Forecast, by Type 2020 & 2033
- Table 10: Global Cerebral Vascular Stent Industry Volume K Unit Forecast, by Type 2020 & 2033
- Table 11: Global Cerebral Vascular Stent Industry Revenue billion Forecast, by Application 2020 & 2033
- Table 12: Global Cerebral Vascular Stent Industry Volume K Unit Forecast, by Application 2020 & 2033
- Table 13: Global Cerebral Vascular Stent Industry Revenue billion Forecast, by End-User 2020 & 2033
- Table 14: Global Cerebral Vascular Stent Industry Volume K Unit Forecast, by End-User 2020 & 2033
- Table 15: Global Cerebral Vascular Stent Industry Revenue billion Forecast, by Country 2020 & 2033
- Table 16: Global Cerebral Vascular Stent Industry Volume K Unit Forecast, by Country 2020 & 2033
- Table 17: United States Cerebral Vascular Stent Industry Revenue (billion) Forecast, by Application 2020 & 2033
- Table 18: United States Cerebral Vascular Stent Industry Volume (K Unit) Forecast, by Application 2020 & 2033
- Table 19: Canada Cerebral Vascular Stent Industry Revenue (billion) Forecast, by Application 2020 & 2033
- Table 20: Canada Cerebral Vascular Stent Industry Volume (K Unit) Forecast, by Application 2020 & 2033
- Table 21: Mexico Cerebral Vascular Stent Industry Revenue (billion) Forecast, by Application 2020 & 2033
- Table 22: Mexico Cerebral Vascular Stent Industry Volume (K Unit) Forecast, by Application 2020 & 2033
- Table 23: Global Cerebral Vascular Stent Industry Revenue billion Forecast, by Type 2020 & 2033
- Table 24: Global Cerebral Vascular Stent Industry Volume K Unit Forecast, by Type 2020 & 2033
- Table 25: Global Cerebral Vascular Stent Industry Revenue billion Forecast, by Application 2020 & 2033
- Table 26: Global Cerebral Vascular Stent Industry Volume K Unit Forecast, by Application 2020 & 2033
- Table 27: Global Cerebral Vascular Stent Industry Revenue billion Forecast, by End-User 2020 & 2033
- Table 28: Global Cerebral Vascular Stent Industry Volume K Unit Forecast, by End-User 2020 & 2033
- Table 29: Global Cerebral Vascular Stent Industry Revenue billion Forecast, by Country 2020 & 2033
- Table 30: Global Cerebral Vascular Stent Industry Volume K Unit Forecast, by Country 2020 & 2033
- Table 31: Germany Cerebral Vascular Stent Industry Revenue (billion) Forecast, by Application 2020 & 2033
- Table 32: Germany Cerebral Vascular Stent Industry Volume (K Unit) Forecast, by Application 2020 & 2033
- Table 33: United Kingdom Cerebral Vascular Stent Industry Revenue (billion) Forecast, by Application 2020 & 2033
- Table 34: United Kingdom Cerebral Vascular Stent Industry Volume (K Unit) Forecast, by Application 2020 & 2033
- Table 35: France Cerebral Vascular Stent Industry Revenue (billion) Forecast, by Application 2020 & 2033
- Table 36: France Cerebral Vascular Stent Industry Volume (K Unit) Forecast, by Application 2020 & 2033
- Table 37: Italy Cerebral Vascular Stent Industry Revenue (billion) Forecast, by Application 2020 & 2033
- Table 38: Italy Cerebral Vascular Stent Industry Volume (K Unit) Forecast, by Application 2020 & 2033
- Table 39: Spain Cerebral Vascular Stent Industry Revenue (billion) Forecast, by Application 2020 & 2033
- Table 40: Spain Cerebral Vascular Stent Industry Volume (K Unit) Forecast, by Application 2020 & 2033
- Table 41: Rest of Europe Cerebral Vascular Stent Industry Revenue (billion) Forecast, by Application 2020 & 2033
- Table 42: Rest of Europe Cerebral Vascular Stent Industry Volume (K Unit) Forecast, by Application 2020 & 2033
- Table 43: Global Cerebral Vascular Stent Industry Revenue billion Forecast, by Type 2020 & 2033
- Table 44: Global Cerebral Vascular Stent Industry Volume K Unit Forecast, by Type 2020 & 2033
- Table 45: Global Cerebral Vascular Stent Industry Revenue billion Forecast, by Application 2020 & 2033
- Table 46: Global Cerebral Vascular Stent Industry Volume K Unit Forecast, by Application 2020 & 2033
- Table 47: Global Cerebral Vascular Stent Industry Revenue billion Forecast, by End-User 2020 & 2033
- Table 48: Global Cerebral Vascular Stent Industry Volume K Unit Forecast, by End-User 2020 & 2033
- Table 49: Global Cerebral Vascular Stent Industry Revenue billion Forecast, by Country 2020 & 2033
- Table 50: Global Cerebral Vascular Stent Industry Volume K Unit Forecast, by Country 2020 & 2033
- Table 51: China Cerebral Vascular Stent Industry Revenue (billion) Forecast, by Application 2020 & 2033
- Table 52: China Cerebral Vascular Stent Industry Volume (K Unit) Forecast, by Application 2020 & 2033
- Table 53: Japan Cerebral Vascular Stent Industry Revenue (billion) Forecast, by Application 2020 & 2033
- Table 54: Japan Cerebral Vascular Stent Industry Volume (K Unit) Forecast, by Application 2020 & 2033
- Table 55: India Cerebral Vascular Stent Industry Revenue (billion) Forecast, by Application 2020 & 2033
- Table 56: India Cerebral Vascular Stent Industry Volume (K Unit) Forecast, by Application 2020 & 2033
- Table 57: Australia Cerebral Vascular Stent Industry Revenue (billion) Forecast, by Application 2020 & 2033
- Table 58: Australia Cerebral Vascular Stent Industry Volume (K Unit) Forecast, by Application 2020 & 2033
- Table 59: South Korea Cerebral Vascular Stent Industry Revenue (billion) Forecast, by Application 2020 & 2033
- Table 60: South Korea Cerebral Vascular Stent Industry Volume (K Unit) Forecast, by Application 2020 & 2033
- Table 61: Rest of Asia Pacific Cerebral Vascular Stent Industry Revenue (billion) Forecast, by Application 2020 & 2033
- Table 62: Rest of Asia Pacific Cerebral Vascular Stent Industry Volume (K Unit) Forecast, by Application 2020 & 2033
- Table 63: Global Cerebral Vascular Stent Industry Revenue billion Forecast, by Type 2020 & 2033
- Table 64: Global Cerebral Vascular Stent Industry Volume K Unit Forecast, by Type 2020 & 2033
- Table 65: Global Cerebral Vascular Stent Industry Revenue billion Forecast, by Application 2020 & 2033
- Table 66: Global Cerebral Vascular Stent Industry Volume K Unit Forecast, by Application 2020 & 2033
- Table 67: Global Cerebral Vascular Stent Industry Revenue billion Forecast, by End-User 2020 & 2033
- Table 68: Global Cerebral Vascular Stent Industry Volume K Unit Forecast, by End-User 2020 & 2033
- Table 69: Global Cerebral Vascular Stent Industry Revenue billion Forecast, by Country 2020 & 2033
- Table 70: Global Cerebral Vascular Stent Industry Volume K Unit Forecast, by Country 2020 & 2033
- Table 71: GCC Cerebral Vascular Stent Industry Revenue (billion) Forecast, by Application 2020 & 2033
- Table 72: GCC Cerebral Vascular Stent Industry Volume (K Unit) Forecast, by Application 2020 & 2033
- Table 73: South Africa Cerebral Vascular Stent Industry Revenue (billion) Forecast, by Application 2020 & 2033
- Table 74: South Africa Cerebral Vascular Stent Industry Volume (K Unit) Forecast, by Application 2020 & 2033
- Table 75: Rest of Middle East and Africa Cerebral Vascular Stent Industry Revenue (billion) Forecast, by Application 2020 & 2033
- Table 76: Rest of Middle East and Africa Cerebral Vascular Stent Industry Volume (K Unit) Forecast, by Application 2020 & 2033
- Table 77: Global Cerebral Vascular Stent Industry Revenue billion Forecast, by Type 2020 & 2033
- Table 78: Global Cerebral Vascular Stent Industry Volume K Unit Forecast, by Type 2020 & 2033
- Table 79: Global Cerebral Vascular Stent Industry Revenue billion Forecast, by Application 2020 & 2033
- Table 80: Global Cerebral Vascular Stent Industry Volume K Unit Forecast, by Application 2020 & 2033
- Table 81: Global Cerebral Vascular Stent Industry Revenue billion Forecast, by End-User 2020 & 2033
- Table 82: Global Cerebral Vascular Stent Industry Volume K Unit Forecast, by End-User 2020 & 2033
- Table 83: Global Cerebral Vascular Stent Industry Revenue billion Forecast, by Country 2020 & 2033
- Table 84: Global Cerebral Vascular Stent Industry Volume K Unit Forecast, by Country 2020 & 2033
- Table 85: Brazil Cerebral Vascular Stent Industry Revenue (billion) Forecast, by Application 2020 & 2033
- Table 86: Brazil Cerebral Vascular Stent Industry Volume (K Unit) Forecast, by Application 2020 & 2033
- Table 87: Argentina Cerebral Vascular Stent Industry Revenue (billion) Forecast, by Application 2020 & 2033
- Table 88: Argentina Cerebral Vascular Stent Industry Volume (K Unit) Forecast, by Application 2020 & 2033
- Table 89: Rest of South America Cerebral Vascular Stent Industry Revenue (billion) Forecast, by Application 2020 & 2033
- Table 90: Rest of South America Cerebral Vascular Stent Industry Volume (K Unit) Forecast, by Application 2020 & 2033
Frequently Asked Questions
1. What is the projected Compound Annual Growth Rate (CAGR) of the Cerebral Vascular Stent Industry?
The projected CAGR is approximately 7%.
2. Which companies are prominent players in the Cerebral Vascular Stent Industry?
Key companies in the market include Acandis GmbH, phenox GmbH, Cook Group, MicroPort Scientific, Balt Extrusion, Terumo Corporation, Johnson & Johnson Services Inc, Medtronic Plc, MicroPort Scientific Corporation, Stryker Corporation, Boston Scientific Corporation, Penumbra Inc.
3. What are the main segments of the Cerebral Vascular Stent Industry?
The market segments include Type, Application, End-User.
4. Can you provide details about the market size?
The market size is estimated to be USD 1.5 billion as of 2022.
5. What are some drivers contributing to market growth?
Increasing Demand for Minimally Invasive Intracranial Surgeries; Rising Prevalence of Stroke and Increasing Geriatric population.
6. What are the notable trends driving market growth?
Brain Aneurysm Segment Expects to Register a Highest CAGR Over the Forecast Period.
7. Are there any restraints impacting market growth?
Lack of Skilled Professional for Operating using Intracranial Stents; Cerebrovascular Complications Related to Intracranial Stenting.
8. Can you provide examples of recent developments in the market?
In September 2022, Wallaby/phenox launched a pEGASUS HPC stent with an anti-thrombogenic HPC coating technology, indicated for patients with intracranial aneurysms as well as stenoses in intracranial atherosclerotic disease (ICAD) patients, at the ESMINT 2022 congress in France.
9. What pricing options are available for accessing the report?
Pricing options include single-user, multi-user, and enterprise licenses priced at USD 4750, USD 5250, and USD 8750 respectively.
10. Is the market size provided in terms of value or volume?
The market size is provided in terms of value, measured in billion and volume, measured in K Unit.
11. Are there any specific market keywords associated with the report?
Yes, the market keyword associated with the report is "Cerebral Vascular Stent Industry," which aids in identifying and referencing the specific market segment covered.
12. How do I determine which pricing option suits my needs best?
The pricing options vary based on user requirements and access needs. Individual users may opt for single-user licenses, while businesses requiring broader access may choose multi-user or enterprise licenses for cost-effective access to the report.
13. Are there any additional resources or data provided in the Cerebral Vascular Stent Industry report?
While the report offers comprehensive insights, it's advisable to review the specific contents or supplementary materials provided to ascertain if additional resources or data are available.
14. How can I stay updated on further developments or reports in the Cerebral Vascular Stent Industry?
To stay informed about further developments, trends, and reports in the Cerebral Vascular Stent Industry, consider subscribing to industry newsletters, following relevant companies and organizations, or regularly checking reputable industry news sources and publications.
Methodology
Step 1 - Identification of Relevant Samples Size from Population Database


Step 2 - Approaches for Defining Global Market Size (Value, Volume* & Price*)

Note*: In applicable scenarios
Step 3 - Data Sources
Primary Research
- Web Analytics
- Survey Reports
- Research Institute
- Latest Research Reports
- Opinion Leaders
Secondary Research
- Annual Reports
- White Paper
- Latest Press Release
- Industry Association
- Paid Database
- Investor Presentations

Step 4 - Data Triangulation
Involves using different sources of information in order to increase the validity of a study
These sources are likely to be stakeholders in a program - participants, other researchers, program staff, other community members, and so on.
Then we put all data in single framework & apply various statistical tools to find out the dynamic on the market.
During the analysis stage, feedback from the stakeholder groups would be compared to determine areas of agreement as well as areas of divergence