

Key Insights
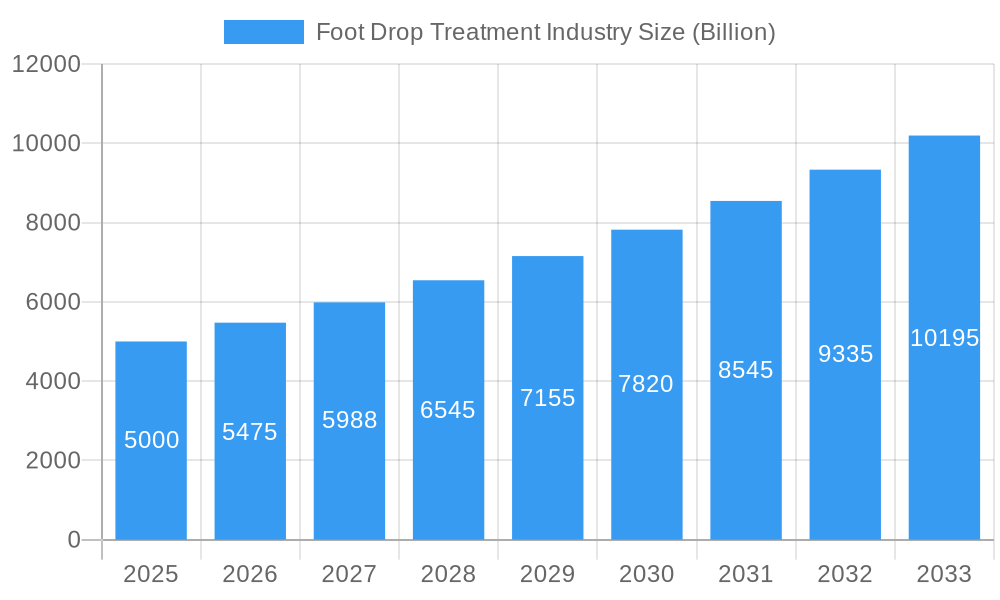
The global Foot Drop Treatment Market is poised for significant expansion, projected to reach an estimated value of over $5 billion by 2025, with a robust Compound Annual Growth Rate (CAGR) of 9.50% expected through 2033. This remarkable growth is primarily fueled by the increasing prevalence of neurological conditions like stroke, multiple sclerosis, and spinal cord injuries, all of which can lead to foot drop. Advancements in technology, particularly the development of sophisticated Functional Electrical Stimulators (FES) and advanced orthopedic braces and splints, are revolutionizing treatment options, offering patients greater mobility and improved quality of life. The rising awareness among patients and healthcare professionals regarding the benefits of these innovative solutions further propels market adoption.
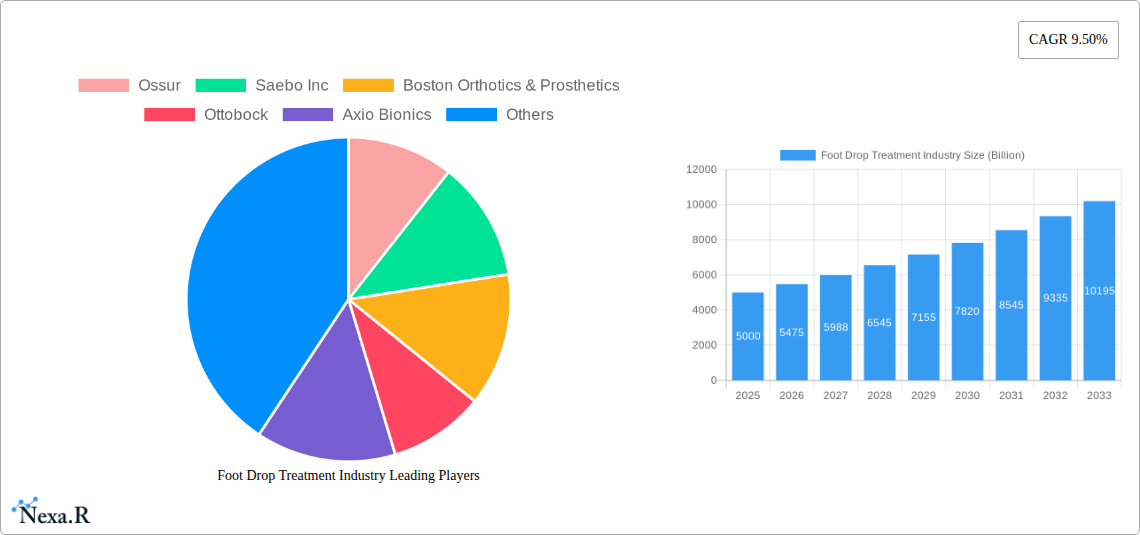
Foot Drop Treatment Industry Market Size (In Billion)
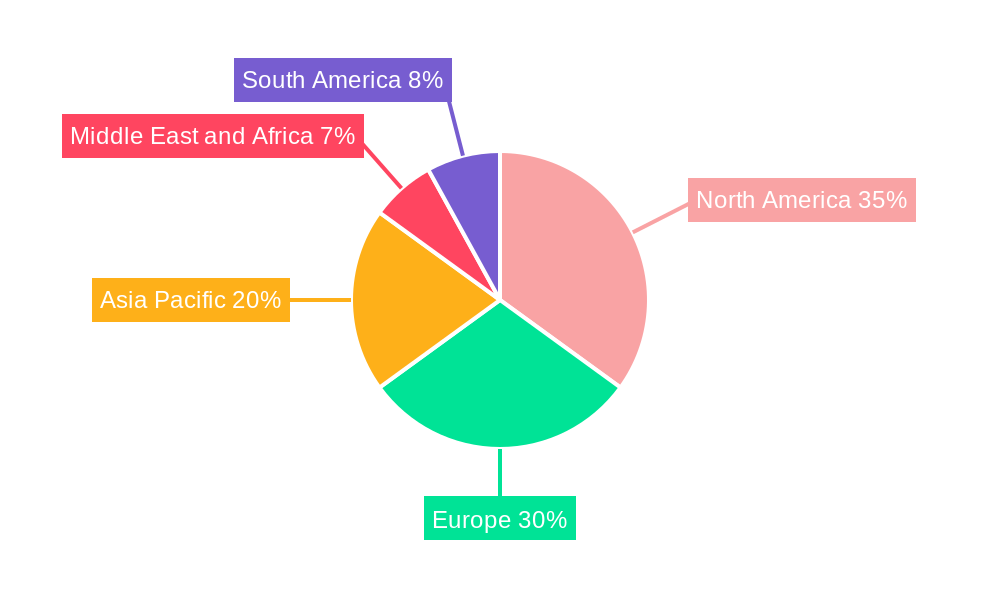
The market's trajectory is further shaped by emerging trends such as the integration of artificial intelligence in rehabilitation devices for personalized treatment plans and the growing demand for wearable and portable foot drop solutions. While the market is optimistic, certain restraints, including the high cost of some advanced treatment devices and limited reimbursement policies in specific regions, could temper growth. However, the strong focus on research and development by leading companies like Ossur, Ottobock, and Bioness Inc. is expected to overcome these challenges, leading to more accessible and effective treatments. Geographically, North America is anticipated to lead the market due to its advanced healthcare infrastructure and high adoption rates of new technologies, followed closely by Europe, driven by supportive government initiatives and a growing aging population.
Foot Drop Treatment Industry Company Market Share
Foot Drop Treatment Industry: Comprehensive Market Analysis and Future Outlook (2019-2033)
This in-depth report provides a comprehensive analysis of the global Foot Drop Treatment market, detailing its current dynamics, growth trajectories, and future potential. Covering the period from 2019 to 2033, with a base year of 2025, this report offers actionable insights for industry stakeholders, investors, and professionals seeking to navigate the evolving landscape of foot drop orthotics, functional electrical stimulation for foot drop, and neurological rehabilitation devices. We delve into market size evolution, technological advancements, regional dominance, and the strategic initiatives of key players.
Foot Drop Treatment Industry Market Dynamics & Structure
The Foot Drop Treatment market is characterized by a moderately concentrated structure, with a blend of established orthopedic device manufacturers and innovative technology startups. Technological innovation is a primary driver, fueled by advancements in biomaterials, sensor technology, and artificial intelligence for personalized treatment. The regulatory landscape, particularly the scrutiny from bodies like the USFDA, plays a crucial role in product development and market entry. Competitive product substitutes include conventional braces, physical therapy, and emerging wearable technology. End-user demographics are shifting, with an increasing aging population and a rise in conditions like stroke, multiple sclerosis, and cerebral palsy driving demand. Merger and acquisition (M&A) trends indicate consolidation among larger players acquiring innovative technologies to expand their product portfolios. Barriers to innovation include the high cost of research and development, stringent clinical trial requirements, and the need for extensive physician education and patient adoption.
- Market Concentration: Moderate, with key players like Ossur and Ottobock holding significant market share, alongside dynamic emerging companies.
- Technological Innovation Drivers: Miniaturization of electronics, advanced material science, AI-powered gait analysis, and sophisticated stimulation algorithms.
- Regulatory Frameworks: FDA approval processes for medical devices, CE marking in Europe, and varying reimbursement policies across regions.
- Competitive Product Substitutes: Traditional ankle-foot orthoses (AFOs), neuromuscular electrical stimulation (NMES) devices, and intensive physiotherapy regimens.
- End-User Demographics: Growing prevalence of neurological disorders and age-related mobility issues.
- M&A Trends: Strategic acquisitions by major players to integrate advanced technologies and expand market reach.
- Innovation Barriers: High R&D investment, lengthy regulatory approval cycles, and challenges in demonstrating long-term efficacy and cost-effectiveness.
Foot Drop Treatment Industry Growth Trends & Insights
The Foot Drop Treatment market is projected to experience robust growth, driven by increasing awareness of treatment options, a rising incidence of neurological conditions, and continuous technological advancements. The foot drop brace market and the functional electrical stimulator market are expected to witness significant expansion. Market penetration is gradually increasing as healthcare providers and patients become more receptive to innovative solutions beyond traditional therapy. Technological disruptions, such as the integration of AI in gait analysis and personalized stimulation protocols, are enhancing treatment efficacy and patient outcomes. Consumer behavior shifts are evident, with a growing preference for non-invasive, wearable, and user-friendly devices that offer greater mobility and independence. The neuroprosthetics market segment within foot drop treatment is particularly poised for substantial growth.
The global foot drop treatment market size is estimated to reach a significant valuation in the coming years. The foot drop treatment device market is expanding due to factors like an aging global population and a higher prevalence of conditions leading to foot drop, such as stroke, multiple sclerosis, and spinal cord injuries. The increasing adoption of rehabilitation technology and assistive devices for neurological disorders is a major growth catalyst. Furthermore, advancements in orthotic devices and neuromuscular electrical stimulation (NMES) offer improved functional recovery and mobility for patients. The cerebral palsy treatment market and stroke rehabilitation market are directly contributing to the growth of the foot drop treatment industry.
The foot drop market share is being reshaped by innovations like smart orthotics and advanced FES systems that provide adaptive support and personalized stimulation. The neuropathy treatment market also intersects with foot drop, as peripheral neuropathy is a common cause. The market is also benefiting from increased investment in healthcare infrastructure and a growing emphasis on home-based rehabilitation solutions. The demand for lightweight, comfortable, and aesthetically pleasing foot drop braces is also on the rise, catering to patient preferences and improving compliance. The brain and spinal disorder treatment market is a significant driver for the overall foot drop treatment industry.
Dominant Regions, Countries, or Segments in Foot Drop Treatment Industry
North America, particularly the United States, currently dominates the Foot Drop Treatment industry. This dominance is driven by a combination of factors including high disposable income, advanced healthcare infrastructure, widespread adoption of innovative medical technologies, and a significant patient population suffering from stroke, multiple sclerosis, and diabetes-related neuropathy. The robust reimbursement policies for medical devices and rehabilitation services further bolster market growth in this region. The high level of awareness among healthcare professionals and patients regarding advanced treatment options, including functional electrical stimulation (FES) devices for foot drop and sophisticated orthotic solutions, also contributes to its leading position.
- North America: Leading region due to high healthcare spending, advanced R&D, and strong regulatory support.
- United States: Accounts for a significant portion of regional market share, driven by a high prevalence of neurological disorders and early adoption of new technologies.
- Canada: Growing market influenced by increasing awareness and government initiatives for rehabilitation.
- Europe: The second-largest market, characterized by a well-established healthcare system, supportive government policies, and a growing aging population.
- Germany: A key contributor with advanced medical device manufacturing capabilities and a strong emphasis on rehabilitation.
- United Kingdom: Increasing investment in neurological rehabilitation and assistive technologies.
- Asia Pacific: Emerging as a high-growth region due to rising healthcare expenditure, a growing patient base for neurological conditions, and improving access to advanced treatments.
- China: Rapidly expanding market driven by increasing healthcare reforms and a large population susceptible to stroke.
- Japan: An aging population and a focus on innovative geriatric care solutions contribute to market growth.
Within product segments, Braces/Splints currently hold the largest market share, driven by their established efficacy, wider accessibility, and diverse range of options for different severities of foot drop. However, the Functional Electrical Stimulator (FES) segment is exhibiting the highest growth rate, propelled by technological advancements leading to more effective, compact, and user-friendly devices. In terms of applications, Neuropathy and Brain & Spinal Disorders are the primary drivers of demand, given their high incidence and direct correlation with foot drop.
Foot Drop Treatment Industry Product Landscape
The product landscape for foot drop treatment is continuously evolving with a focus on enhancing functionality, comfort, and user experience. Innovations include lightweight, customizable braces with advanced materials for optimal fit and support. Functional electrical stimulators are becoming more sophisticated, utilizing AI and sensors to adapt stimulation patterns in real-time to a patient's gait, mimicking natural muscle activation. Wearable technology, like intelligent sleeves with integrated electrodes, is emerging as a significant trend, offering discreet and effective muscle stimulation. These advancements aim to improve patient mobility, reduce the risk of falls, and facilitate greater independence.
Key Drivers, Barriers & Challenges in Foot Drop Treatment Industry
Key Drivers:
- Rising Prevalence of Neurological Disorders: Increasing rates of stroke, multiple sclerosis, and spinal cord injuries directly correlate with a growing demand for foot drop treatments.
- Technological Advancements: Innovations in FES, smart orthotics, and wearable technology are creating more effective and user-friendly solutions.
- Aging Global Population: The elderly demographic is more susceptible to conditions that cause foot drop, driving market expansion.
- Increased Healthcare Expenditure: Growing investments in rehabilitation services and medical devices worldwide.
Barriers & Challenges:
- High Cost of Advanced Devices: Sophisticated FES systems and custom orthotics can be expensive, limiting accessibility for some patient populations.
- Reimbursement Policies: Inconsistent and sometimes inadequate insurance coverage for advanced foot drop treatments can hinder adoption.
- Patient and Physician Education: The need for comprehensive training and awareness regarding the benefits and proper use of emerging technologies.
- Regulatory Hurdles: Obtaining approvals for new medical devices can be a lengthy and costly process.
- Competition from Traditional Therapies: Established physical therapy methods, while not always as effective for severe cases, remain a significant alternative.
- Supply Chain Disruptions: Global manufacturing and distribution challenges can impact product availability.
Emerging Opportunities in Foot Drop Treatment Industry
Emerging opportunities lie in the development of more affordable and accessible FES systems, particularly for emerging markets. The integration of IoT and mobile health (mHealth) for remote patient monitoring and personalized therapy adjustments presents a significant avenue. Furthermore, the growing demand for aesthetically pleasing and comfortable orthotic solutions that seamlessly integrate into daily life offers a niche for innovative designs. Research into combination therapies, integrating electrical stimulation with advanced physical therapy techniques, also holds immense potential. The increasing focus on preventative measures and early intervention for conditions leading to foot drop will also create new market segments.
Growth Accelerators in the Foot Drop Treatment Industry Industry
The Foot Drop Treatment industry is poised for accelerated growth driven by ongoing breakthroughs in neuromodulation technology, leading to more precise and adaptable stimulation devices. Strategic partnerships between technology developers, rehabilitation centers, and healthcare providers are crucial for market penetration and widespread adoption. Expansion into underserved emerging markets with tailored product offerings and pricing strategies will unlock significant growth potential. The increasing emphasis on evidence-based medicine and the generation of robust clinical data demonstrating the long-term efficacy and cost-effectiveness of advanced treatments will further bolster market confidence and drive physician prescribing habits.
Key Players Shaping the Foot Drop Treatment Industry Market
- Ossur
- Saebo Inc
- Boston Orthotics & Prosthetics
- Ottobock
- Axio Bionics
- Thrive Orthopedics
- Turbomed Orthotics
- Accelerated Care Plus Corporation
- Allard
- Bioness Inc
Notable Milestones in Foot Drop Treatment Industry Sector
- August 2022: Development of a Velcro sleeve with electrodes for muscle stimulation, designed for individuals with neurological conditions like stroke, multiple sclerosis, and cerebral palsy, with a projected delivery in 2023.
- March 2022: The United States Food and Drug Administration (USFDA) granted approval for Cionic's lightweight leg-worn Neural Sleeve, designed for analyzing, predicting, and augmenting human movement.
In-Depth Foot Drop Treatment Industry Market Outlook
The future of the Foot Drop Treatment industry is exceptionally bright, propelled by a confluence of technological innovation and increasing global healthcare needs. Continued research and development in areas like AI-driven adaptive algorithms for FES devices and the creation of lightweight, multi-functional orthotics will redefine patient care. Strategic collaborations with research institutions and a focus on user-centric design will foster rapid market adoption. Untapped potential exists in developing economies where the prevalence of conditions causing foot drop is high, but access to advanced treatments is limited. By addressing these needs with innovative and affordable solutions, the industry can achieve substantial and sustainable growth, improving the quality of life for millions worldwide.
Foot Drop Treatment Industry Segmentation
-
1. Product Type
- 1.1. Functional Electrical Stimulator
- 1.2. Braces/Splints
-
2. Application
- 2.1. Neuropathy
- 2.2. Muscle Disorders
- 2.3. Brain & Spinal Disorders
Foot Drop Treatment Industry Segmentation By Geography
-
1. North America
- 1.1. United States
- 1.2. Canada
- 1.3. Mexico
-
2. Europe
- 2.1. Germany
- 2.2. United Kingdom
- 2.3. France
- 2.4. Italy
- 2.5. Spain
- 2.6. Rest of Europe
-
3. Asia Pacific
- 3.1. China
- 3.2. Japan
- 3.3. India
- 3.4. Australia
- 3.5. South Korea
- 3.6. Rest of Asia Pacific
-
4. Middle East and Africa
- 4.1. GCC
- 4.2. South Africa
- 4.3. Rest of Middle East and Africa
-
5. South America
- 5.1. Brazil
- 5.2. Argentina
- 5.3. Rest of South America
Foot Drop Treatment Industry Regional Market Share
Geographic Coverage of Foot Drop Treatment Industry
Foot Drop Treatment Industry REPORT HIGHLIGHTS
| Aspects | Details |
|---|---|
| Study Period | 2020-2034 |
| Base Year | 2025 |
| Estimated Year | 2026 |
| Forecast Period | 2026-2034 |
| Historical Period | 2020-2025 |
| Growth Rate | CAGR of 9.50% from 2020-2034 |
| Segmentation |
|
Table of Contents
- 1. Introduction
- 1.1. Research Scope
- 1.2. Market Segmentation
- 1.3. Research Methodology
- 1.4. Definitions and Assumptions
- 2. Executive Summary
- 2.1. Introduction
- 3. Market Dynamics
- 3.1. Introduction
- 3.2. Market Drivers
- 3.2.1. Growing Burden of Chronic Diseases; Advancements in Products
- 3.3. Market Restrains
- 3.3.1. High Cost of Functional Electrical Stimulators
- 3.4. Market Trends
- 3.4.1. Functional Electrical Stimulator Segment is Expected to Show a Significant Growth Rate in the Foot Drop Treatment Market
- 4. Market Factor Analysis
- 4.1. Porters Five Forces
- 4.2. Supply/Value Chain
- 4.3. PESTEL analysis
- 4.4. Market Entropy
- 4.5. Patent/Trademark Analysis
- 5. Global Foot Drop Treatment Industry Analysis, Insights and Forecast, 2020-2032
- 5.1. Market Analysis, Insights and Forecast - by Product Type
- 5.1.1. Functional Electrical Stimulator
- 5.1.2. Braces/Splints
- 5.2. Market Analysis, Insights and Forecast - by Application
- 5.2.1. Neuropathy
- 5.2.2. Muscle Disorders
- 5.2.3. Brain & Spinal Disorders
- 5.3. Market Analysis, Insights and Forecast - by Region
- 5.3.1. North America
- 5.3.2. Europe
- 5.3.3. Asia Pacific
- 5.3.4. Middle East and Africa
- 5.3.5. South America
- 5.1. Market Analysis, Insights and Forecast - by Product Type
- 6. North America Foot Drop Treatment Industry Analysis, Insights and Forecast, 2020-2032
- 6.1. Market Analysis, Insights and Forecast - by Product Type
- 6.1.1. Functional Electrical Stimulator
- 6.1.2. Braces/Splints
- 6.2. Market Analysis, Insights and Forecast - by Application
- 6.2.1. Neuropathy
- 6.2.2. Muscle Disorders
- 6.2.3. Brain & Spinal Disorders
- 6.1. Market Analysis, Insights and Forecast - by Product Type
- 7. Europe Foot Drop Treatment Industry Analysis, Insights and Forecast, 2020-2032
- 7.1. Market Analysis, Insights and Forecast - by Product Type
- 7.1.1. Functional Electrical Stimulator
- 7.1.2. Braces/Splints
- 7.2. Market Analysis, Insights and Forecast - by Application
- 7.2.1. Neuropathy
- 7.2.2. Muscle Disorders
- 7.2.3. Brain & Spinal Disorders
- 7.1. Market Analysis, Insights and Forecast - by Product Type
- 8. Asia Pacific Foot Drop Treatment Industry Analysis, Insights and Forecast, 2020-2032
- 8.1. Market Analysis, Insights and Forecast - by Product Type
- 8.1.1. Functional Electrical Stimulator
- 8.1.2. Braces/Splints
- 8.2. Market Analysis, Insights and Forecast - by Application
- 8.2.1. Neuropathy
- 8.2.2. Muscle Disorders
- 8.2.3. Brain & Spinal Disorders
- 8.1. Market Analysis, Insights and Forecast - by Product Type
- 9. Middle East and Africa Foot Drop Treatment Industry Analysis, Insights and Forecast, 2020-2032
- 9.1. Market Analysis, Insights and Forecast - by Product Type
- 9.1.1. Functional Electrical Stimulator
- 9.1.2. Braces/Splints
- 9.2. Market Analysis, Insights and Forecast - by Application
- 9.2.1. Neuropathy
- 9.2.2. Muscle Disorders
- 9.2.3. Brain & Spinal Disorders
- 9.1. Market Analysis, Insights and Forecast - by Product Type
- 10. South America Foot Drop Treatment Industry Analysis, Insights and Forecast, 2020-2032
- 10.1. Market Analysis, Insights and Forecast - by Product Type
- 10.1.1. Functional Electrical Stimulator
- 10.1.2. Braces/Splints
- 10.2. Market Analysis, Insights and Forecast - by Application
- 10.2.1. Neuropathy
- 10.2.2. Muscle Disorders
- 10.2.3. Brain & Spinal Disorders
- 10.1. Market Analysis, Insights and Forecast - by Product Type
- 11. Competitive Analysis
- 11.1. Global Market Share Analysis 2025
- 11.2. Company Profiles
- 11.2.1 Ossur
- 11.2.1.1. Overview
- 11.2.1.2. Products
- 11.2.1.3. SWOT Analysis
- 11.2.1.4. Recent Developments
- 11.2.1.5. Financials (Based on Availability)
- 11.2.2 Saebo Inc
- 11.2.2.1. Overview
- 11.2.2.2. Products
- 11.2.2.3. SWOT Analysis
- 11.2.2.4. Recent Developments
- 11.2.2.5. Financials (Based on Availability)
- 11.2.3 Boston Orthotics & Prosthetics
- 11.2.3.1. Overview
- 11.2.3.2. Products
- 11.2.3.3. SWOT Analysis
- 11.2.3.4. Recent Developments
- 11.2.3.5. Financials (Based on Availability)
- 11.2.4 Ottobock
- 11.2.4.1. Overview
- 11.2.4.2. Products
- 11.2.4.3. SWOT Analysis
- 11.2.4.4. Recent Developments
- 11.2.4.5. Financials (Based on Availability)
- 11.2.5 Axio Bionics
- 11.2.5.1. Overview
- 11.2.5.2. Products
- 11.2.5.3. SWOT Analysis
- 11.2.5.4. Recent Developments
- 11.2.5.5. Financials (Based on Availability)
- 11.2.6 Thrive Orthopedics
- 11.2.6.1. Overview
- 11.2.6.2. Products
- 11.2.6.3. SWOT Analysis
- 11.2.6.4. Recent Developments
- 11.2.6.5. Financials (Based on Availability)
- 11.2.7 Turbomed Orthotics*List Not Exhaustive
- 11.2.7.1. Overview
- 11.2.7.2. Products
- 11.2.7.3. SWOT Analysis
- 11.2.7.4. Recent Developments
- 11.2.7.5. Financials (Based on Availability)
- 11.2.8 Accelerated Care Plus Corporation
- 11.2.8.1. Overview
- 11.2.8.2. Products
- 11.2.8.3. SWOT Analysis
- 11.2.8.4. Recent Developments
- 11.2.8.5. Financials (Based on Availability)
- 11.2.9 Allard
- 11.2.9.1. Overview
- 11.2.9.2. Products
- 11.2.9.3. SWOT Analysis
- 11.2.9.4. Recent Developments
- 11.2.9.5. Financials (Based on Availability)
- 11.2.10 Bioness Inc
- 11.2.10.1. Overview
- 11.2.10.2. Products
- 11.2.10.3. SWOT Analysis
- 11.2.10.4. Recent Developments
- 11.2.10.5. Financials (Based on Availability)
- 11.2.1 Ossur
List of Figures
- Figure 1: Global Foot Drop Treatment Industry Revenue Breakdown (Billion, %) by Region 2025 & 2033
- Figure 2: Global Foot Drop Treatment Industry Volume Breakdown (Piece, %) by Region 2025 & 2033
- Figure 3: North America Foot Drop Treatment Industry Revenue (Billion), by Product Type 2025 & 2033
- Figure 4: North America Foot Drop Treatment Industry Volume (Piece), by Product Type 2025 & 2033
- Figure 5: North America Foot Drop Treatment Industry Revenue Share (%), by Product Type 2025 & 2033
- Figure 6: North America Foot Drop Treatment Industry Volume Share (%), by Product Type 2025 & 2033
- Figure 7: North America Foot Drop Treatment Industry Revenue (Billion), by Application 2025 & 2033
- Figure 8: North America Foot Drop Treatment Industry Volume (Piece), by Application 2025 & 2033
- Figure 9: North America Foot Drop Treatment Industry Revenue Share (%), by Application 2025 & 2033
- Figure 10: North America Foot Drop Treatment Industry Volume Share (%), by Application 2025 & 2033
- Figure 11: North America Foot Drop Treatment Industry Revenue (Billion), by Country 2025 & 2033
- Figure 12: North America Foot Drop Treatment Industry Volume (Piece), by Country 2025 & 2033
- Figure 13: North America Foot Drop Treatment Industry Revenue Share (%), by Country 2025 & 2033
- Figure 14: North America Foot Drop Treatment Industry Volume Share (%), by Country 2025 & 2033
- Figure 15: Europe Foot Drop Treatment Industry Revenue (Billion), by Product Type 2025 & 2033
- Figure 16: Europe Foot Drop Treatment Industry Volume (Piece), by Product Type 2025 & 2033
- Figure 17: Europe Foot Drop Treatment Industry Revenue Share (%), by Product Type 2025 & 2033
- Figure 18: Europe Foot Drop Treatment Industry Volume Share (%), by Product Type 2025 & 2033
- Figure 19: Europe Foot Drop Treatment Industry Revenue (Billion), by Application 2025 & 2033
- Figure 20: Europe Foot Drop Treatment Industry Volume (Piece), by Application 2025 & 2033
- Figure 21: Europe Foot Drop Treatment Industry Revenue Share (%), by Application 2025 & 2033
- Figure 22: Europe Foot Drop Treatment Industry Volume Share (%), by Application 2025 & 2033
- Figure 23: Europe Foot Drop Treatment Industry Revenue (Billion), by Country 2025 & 2033
- Figure 24: Europe Foot Drop Treatment Industry Volume (Piece), by Country 2025 & 2033
- Figure 25: Europe Foot Drop Treatment Industry Revenue Share (%), by Country 2025 & 2033
- Figure 26: Europe Foot Drop Treatment Industry Volume Share (%), by Country 2025 & 2033
- Figure 27: Asia Pacific Foot Drop Treatment Industry Revenue (Billion), by Product Type 2025 & 2033
- Figure 28: Asia Pacific Foot Drop Treatment Industry Volume (Piece), by Product Type 2025 & 2033
- Figure 29: Asia Pacific Foot Drop Treatment Industry Revenue Share (%), by Product Type 2025 & 2033
- Figure 30: Asia Pacific Foot Drop Treatment Industry Volume Share (%), by Product Type 2025 & 2033
- Figure 31: Asia Pacific Foot Drop Treatment Industry Revenue (Billion), by Application 2025 & 2033
- Figure 32: Asia Pacific Foot Drop Treatment Industry Volume (Piece), by Application 2025 & 2033
- Figure 33: Asia Pacific Foot Drop Treatment Industry Revenue Share (%), by Application 2025 & 2033
- Figure 34: Asia Pacific Foot Drop Treatment Industry Volume Share (%), by Application 2025 & 2033
- Figure 35: Asia Pacific Foot Drop Treatment Industry Revenue (Billion), by Country 2025 & 2033
- Figure 36: Asia Pacific Foot Drop Treatment Industry Volume (Piece), by Country 2025 & 2033
- Figure 37: Asia Pacific Foot Drop Treatment Industry Revenue Share (%), by Country 2025 & 2033
- Figure 38: Asia Pacific Foot Drop Treatment Industry Volume Share (%), by Country 2025 & 2033
- Figure 39: Middle East and Africa Foot Drop Treatment Industry Revenue (Billion), by Product Type 2025 & 2033
- Figure 40: Middle East and Africa Foot Drop Treatment Industry Volume (Piece), by Product Type 2025 & 2033
- Figure 41: Middle East and Africa Foot Drop Treatment Industry Revenue Share (%), by Product Type 2025 & 2033
- Figure 42: Middle East and Africa Foot Drop Treatment Industry Volume Share (%), by Product Type 2025 & 2033
- Figure 43: Middle East and Africa Foot Drop Treatment Industry Revenue (Billion), by Application 2025 & 2033
- Figure 44: Middle East and Africa Foot Drop Treatment Industry Volume (Piece), by Application 2025 & 2033
- Figure 45: Middle East and Africa Foot Drop Treatment Industry Revenue Share (%), by Application 2025 & 2033
- Figure 46: Middle East and Africa Foot Drop Treatment Industry Volume Share (%), by Application 2025 & 2033
- Figure 47: Middle East and Africa Foot Drop Treatment Industry Revenue (Billion), by Country 2025 & 2033
- Figure 48: Middle East and Africa Foot Drop Treatment Industry Volume (Piece), by Country 2025 & 2033
- Figure 49: Middle East and Africa Foot Drop Treatment Industry Revenue Share (%), by Country 2025 & 2033
- Figure 50: Middle East and Africa Foot Drop Treatment Industry Volume Share (%), by Country 2025 & 2033
- Figure 51: South America Foot Drop Treatment Industry Revenue (Billion), by Product Type 2025 & 2033
- Figure 52: South America Foot Drop Treatment Industry Volume (Piece), by Product Type 2025 & 2033
- Figure 53: South America Foot Drop Treatment Industry Revenue Share (%), by Product Type 2025 & 2033
- Figure 54: South America Foot Drop Treatment Industry Volume Share (%), by Product Type 2025 & 2033
- Figure 55: South America Foot Drop Treatment Industry Revenue (Billion), by Application 2025 & 2033
- Figure 56: South America Foot Drop Treatment Industry Volume (Piece), by Application 2025 & 2033
- Figure 57: South America Foot Drop Treatment Industry Revenue Share (%), by Application 2025 & 2033
- Figure 58: South America Foot Drop Treatment Industry Volume Share (%), by Application 2025 & 2033
- Figure 59: South America Foot Drop Treatment Industry Revenue (Billion), by Country 2025 & 2033
- Figure 60: South America Foot Drop Treatment Industry Volume (Piece), by Country 2025 & 2033
- Figure 61: South America Foot Drop Treatment Industry Revenue Share (%), by Country 2025 & 2033
- Figure 62: South America Foot Drop Treatment Industry Volume Share (%), by Country 2025 & 2033
List of Tables
- Table 1: Global Foot Drop Treatment Industry Revenue Billion Forecast, by Product Type 2020 & 2033
- Table 2: Global Foot Drop Treatment Industry Volume Piece Forecast, by Product Type 2020 & 2033
- Table 3: Global Foot Drop Treatment Industry Revenue Billion Forecast, by Application 2020 & 2033
- Table 4: Global Foot Drop Treatment Industry Volume Piece Forecast, by Application 2020 & 2033
- Table 5: Global Foot Drop Treatment Industry Revenue Billion Forecast, by Region 2020 & 2033
- Table 6: Global Foot Drop Treatment Industry Volume Piece Forecast, by Region 2020 & 2033
- Table 7: Global Foot Drop Treatment Industry Revenue Billion Forecast, by Product Type 2020 & 2033
- Table 8: Global Foot Drop Treatment Industry Volume Piece Forecast, by Product Type 2020 & 2033
- Table 9: Global Foot Drop Treatment Industry Revenue Billion Forecast, by Application 2020 & 2033
- Table 10: Global Foot Drop Treatment Industry Volume Piece Forecast, by Application 2020 & 2033
- Table 11: Global Foot Drop Treatment Industry Revenue Billion Forecast, by Country 2020 & 2033
- Table 12: Global Foot Drop Treatment Industry Volume Piece Forecast, by Country 2020 & 2033
- Table 13: United States Foot Drop Treatment Industry Revenue (Billion) Forecast, by Application 2020 & 2033
- Table 14: United States Foot Drop Treatment Industry Volume (Piece) Forecast, by Application 2020 & 2033
- Table 15: Canada Foot Drop Treatment Industry Revenue (Billion) Forecast, by Application 2020 & 2033
- Table 16: Canada Foot Drop Treatment Industry Volume (Piece) Forecast, by Application 2020 & 2033
- Table 17: Mexico Foot Drop Treatment Industry Revenue (Billion) Forecast, by Application 2020 & 2033
- Table 18: Mexico Foot Drop Treatment Industry Volume (Piece) Forecast, by Application 2020 & 2033
- Table 19: Global Foot Drop Treatment Industry Revenue Billion Forecast, by Product Type 2020 & 2033
- Table 20: Global Foot Drop Treatment Industry Volume Piece Forecast, by Product Type 2020 & 2033
- Table 21: Global Foot Drop Treatment Industry Revenue Billion Forecast, by Application 2020 & 2033
- Table 22: Global Foot Drop Treatment Industry Volume Piece Forecast, by Application 2020 & 2033
- Table 23: Global Foot Drop Treatment Industry Revenue Billion Forecast, by Country 2020 & 2033
- Table 24: Global Foot Drop Treatment Industry Volume Piece Forecast, by Country 2020 & 2033
- Table 25: Germany Foot Drop Treatment Industry Revenue (Billion) Forecast, by Application 2020 & 2033
- Table 26: Germany Foot Drop Treatment Industry Volume (Piece) Forecast, by Application 2020 & 2033
- Table 27: United Kingdom Foot Drop Treatment Industry Revenue (Billion) Forecast, by Application 2020 & 2033
- Table 28: United Kingdom Foot Drop Treatment Industry Volume (Piece) Forecast, by Application 2020 & 2033
- Table 29: France Foot Drop Treatment Industry Revenue (Billion) Forecast, by Application 2020 & 2033
- Table 30: France Foot Drop Treatment Industry Volume (Piece) Forecast, by Application 2020 & 2033
- Table 31: Italy Foot Drop Treatment Industry Revenue (Billion) Forecast, by Application 2020 & 2033
- Table 32: Italy Foot Drop Treatment Industry Volume (Piece) Forecast, by Application 2020 & 2033
- Table 33: Spain Foot Drop Treatment Industry Revenue (Billion) Forecast, by Application 2020 & 2033
- Table 34: Spain Foot Drop Treatment Industry Volume (Piece) Forecast, by Application 2020 & 2033
- Table 35: Rest of Europe Foot Drop Treatment Industry Revenue (Billion) Forecast, by Application 2020 & 2033
- Table 36: Rest of Europe Foot Drop Treatment Industry Volume (Piece) Forecast, by Application 2020 & 2033
- Table 37: Global Foot Drop Treatment Industry Revenue Billion Forecast, by Product Type 2020 & 2033
- Table 38: Global Foot Drop Treatment Industry Volume Piece Forecast, by Product Type 2020 & 2033
- Table 39: Global Foot Drop Treatment Industry Revenue Billion Forecast, by Application 2020 & 2033
- Table 40: Global Foot Drop Treatment Industry Volume Piece Forecast, by Application 2020 & 2033
- Table 41: Global Foot Drop Treatment Industry Revenue Billion Forecast, by Country 2020 & 2033
- Table 42: Global Foot Drop Treatment Industry Volume Piece Forecast, by Country 2020 & 2033
- Table 43: China Foot Drop Treatment Industry Revenue (Billion) Forecast, by Application 2020 & 2033
- Table 44: China Foot Drop Treatment Industry Volume (Piece) Forecast, by Application 2020 & 2033
- Table 45: Japan Foot Drop Treatment Industry Revenue (Billion) Forecast, by Application 2020 & 2033
- Table 46: Japan Foot Drop Treatment Industry Volume (Piece) Forecast, by Application 2020 & 2033
- Table 47: India Foot Drop Treatment Industry Revenue (Billion) Forecast, by Application 2020 & 2033
- Table 48: India Foot Drop Treatment Industry Volume (Piece) Forecast, by Application 2020 & 2033
- Table 49: Australia Foot Drop Treatment Industry Revenue (Billion) Forecast, by Application 2020 & 2033
- Table 50: Australia Foot Drop Treatment Industry Volume (Piece) Forecast, by Application 2020 & 2033
- Table 51: South Korea Foot Drop Treatment Industry Revenue (Billion) Forecast, by Application 2020 & 2033
- Table 52: South Korea Foot Drop Treatment Industry Volume (Piece) Forecast, by Application 2020 & 2033
- Table 53: Rest of Asia Pacific Foot Drop Treatment Industry Revenue (Billion) Forecast, by Application 2020 & 2033
- Table 54: Rest of Asia Pacific Foot Drop Treatment Industry Volume (Piece) Forecast, by Application 2020 & 2033
- Table 55: Global Foot Drop Treatment Industry Revenue Billion Forecast, by Product Type 2020 & 2033
- Table 56: Global Foot Drop Treatment Industry Volume Piece Forecast, by Product Type 2020 & 2033
- Table 57: Global Foot Drop Treatment Industry Revenue Billion Forecast, by Application 2020 & 2033
- Table 58: Global Foot Drop Treatment Industry Volume Piece Forecast, by Application 2020 & 2033
- Table 59: Global Foot Drop Treatment Industry Revenue Billion Forecast, by Country 2020 & 2033
- Table 60: Global Foot Drop Treatment Industry Volume Piece Forecast, by Country 2020 & 2033
- Table 61: GCC Foot Drop Treatment Industry Revenue (Billion) Forecast, by Application 2020 & 2033
- Table 62: GCC Foot Drop Treatment Industry Volume (Piece) Forecast, by Application 2020 & 2033
- Table 63: South Africa Foot Drop Treatment Industry Revenue (Billion) Forecast, by Application 2020 & 2033
- Table 64: South Africa Foot Drop Treatment Industry Volume (Piece) Forecast, by Application 2020 & 2033
- Table 65: Rest of Middle East and Africa Foot Drop Treatment Industry Revenue (Billion) Forecast, by Application 2020 & 2033
- Table 66: Rest of Middle East and Africa Foot Drop Treatment Industry Volume (Piece) Forecast, by Application 2020 & 2033
- Table 67: Global Foot Drop Treatment Industry Revenue Billion Forecast, by Product Type 2020 & 2033
- Table 68: Global Foot Drop Treatment Industry Volume Piece Forecast, by Product Type 2020 & 2033
- Table 69: Global Foot Drop Treatment Industry Revenue Billion Forecast, by Application 2020 & 2033
- Table 70: Global Foot Drop Treatment Industry Volume Piece Forecast, by Application 2020 & 2033
- Table 71: Global Foot Drop Treatment Industry Revenue Billion Forecast, by Country 2020 & 2033
- Table 72: Global Foot Drop Treatment Industry Volume Piece Forecast, by Country 2020 & 2033
- Table 73: Brazil Foot Drop Treatment Industry Revenue (Billion) Forecast, by Application 2020 & 2033
- Table 74: Brazil Foot Drop Treatment Industry Volume (Piece) Forecast, by Application 2020 & 2033
- Table 75: Argentina Foot Drop Treatment Industry Revenue (Billion) Forecast, by Application 2020 & 2033
- Table 76: Argentina Foot Drop Treatment Industry Volume (Piece) Forecast, by Application 2020 & 2033
- Table 77: Rest of South America Foot Drop Treatment Industry Revenue (Billion) Forecast, by Application 2020 & 2033
- Table 78: Rest of South America Foot Drop Treatment Industry Volume (Piece) Forecast, by Application 2020 & 2033
Frequently Asked Questions
1. What is the projected Compound Annual Growth Rate (CAGR) of the Foot Drop Treatment Industry?
The projected CAGR is approximately 9.50%.
2. Which companies are prominent players in the Foot Drop Treatment Industry?
Key companies in the market include Ossur, Saebo Inc, Boston Orthotics & Prosthetics, Ottobock, Axio Bionics, Thrive Orthopedics, Turbomed Orthotics*List Not Exhaustive, Accelerated Care Plus Corporation, Allard, Bioness Inc.
3. What are the main segments of the Foot Drop Treatment Industry?
The market segments include Product Type, Application.
4. Can you provide details about the market size?
The market size is estimated to be USD 4 Billion as of 2022.
5. What are some drivers contributing to market growth?
Growing Burden of Chronic Diseases; Advancements in Products.
6. What are the notable trends driving market growth?
Functional Electrical Stimulator Segment is Expected to Show a Significant Growth Rate in the Foot Drop Treatment Market.
7. Are there any restraints impacting market growth?
High Cost of Functional Electrical Stimulators.
8. Can you provide examples of recent developments in the market?
As per the news published in August 2022, a Velcro sleeve fastened around the leg has been designed with electrodes that help stimulate the muscles of those who experience difficulty getting around due to nervous system conditions. This device will be ready for delivery to those who have experienced a stroke, or have multiple sclerosis or cerebral palsy, in 2023.
9. What pricing options are available for accessing the report?
Pricing options include single-user, multi-user, and enterprise licenses priced at USD 4750, USD 5250, and USD 8750 respectively.
10. Is the market size provided in terms of value or volume?
The market size is provided in terms of value, measured in Billion and volume, measured in Piece.
11. Are there any specific market keywords associated with the report?
Yes, the market keyword associated with the report is "Foot Drop Treatment Industry," which aids in identifying and referencing the specific market segment covered.
12. How do I determine which pricing option suits my needs best?
The pricing options vary based on user requirements and access needs. Individual users may opt for single-user licenses, while businesses requiring broader access may choose multi-user or enterprise licenses for cost-effective access to the report.
13. Are there any additional resources or data provided in the Foot Drop Treatment Industry report?
While the report offers comprehensive insights, it's advisable to review the specific contents or supplementary materials provided to ascertain if additional resources or data are available.
14. How can I stay updated on further developments or reports in the Foot Drop Treatment Industry?
To stay informed about further developments, trends, and reports in the Foot Drop Treatment Industry, consider subscribing to industry newsletters, following relevant companies and organizations, or regularly checking reputable industry news sources and publications.
Methodology
Step 1 - Identification of Relevant Samples Size from Population Database


Step 2 - Approaches for Defining Global Market Size (Value, Volume* & Price*)

Note*: In applicable scenarios
Step 3 - Data Sources
Primary Research
- Web Analytics
- Survey Reports
- Research Institute
- Latest Research Reports
- Opinion Leaders
Secondary Research
- Annual Reports
- White Paper
- Latest Press Release
- Industry Association
- Paid Database
- Investor Presentations

Step 4 - Data Triangulation
Involves using different sources of information in order to increase the validity of a study
These sources are likely to be stakeholders in a program - participants, other researchers, program staff, other community members, and so on.
Then we put all data in single framework & apply various statistical tools to find out the dynamic on the market.
During the analysis stage, feedback from the stakeholder groups would be compared to determine areas of agreement as well as areas of divergence