

Key Insights
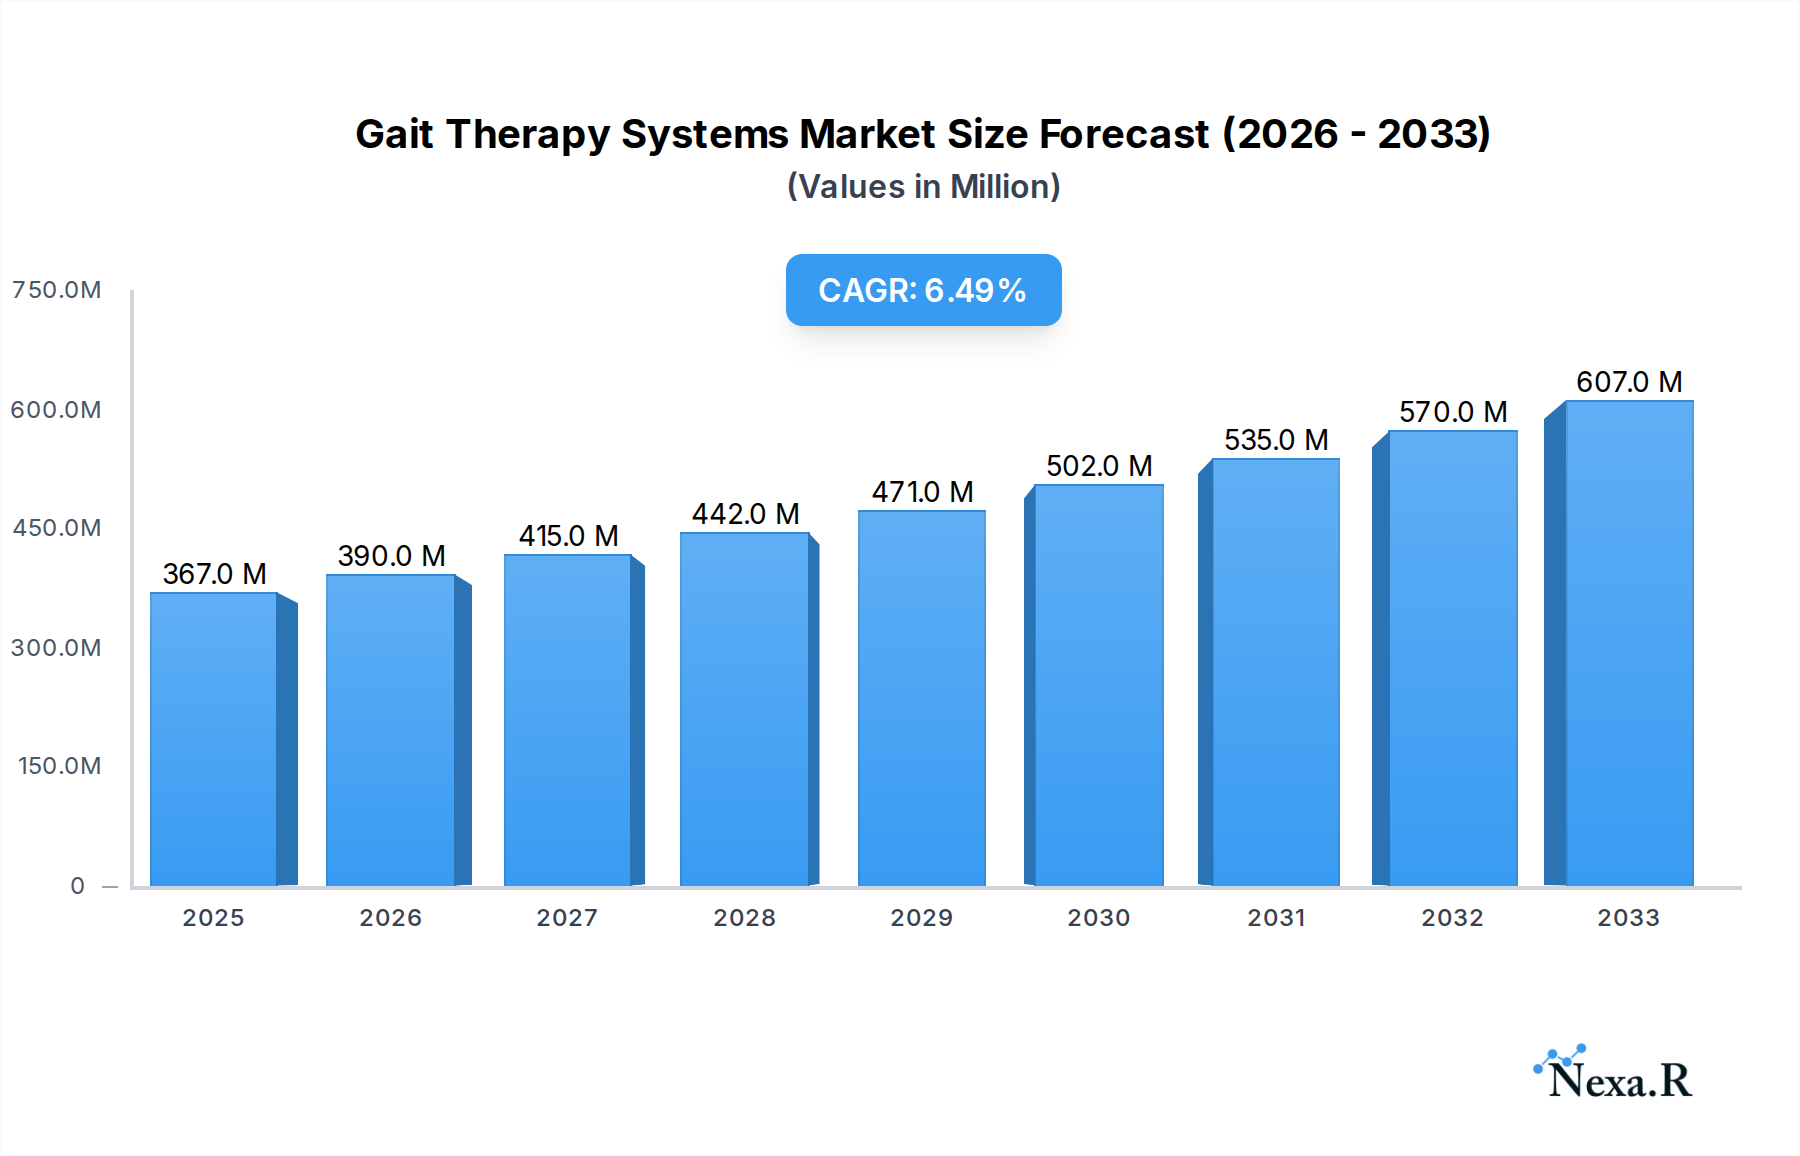
The global Gait Therapy Systems market is poised for significant expansion, projected to reach a market size of 367 million by 2025, demonstrating a robust Compound Annual Growth Rate (CAGR) of 6.4% from 2019 to 2033. This growth is primarily fueled by an escalating prevalence of neurological disorders and musculoskeletal conditions, such as stroke, Parkinson's disease, and spinal cord injuries, necessitating advanced rehabilitation solutions. The increasing awareness among healthcare providers and patients about the efficacy of gait training in restoring mobility and improving quality of life is a critical driver. Furthermore, technological advancements, including the integration of robotics, virtual reality, and sensor technologies, are enhancing the precision, effectiveness, and patient engagement within gait therapy systems, thereby stimulating market demand. The growing emphasis on post-operative rehabilitation and the expanding geriatric population, prone to mobility impairments, also contribute to the market's upward trajectory.

Gait Therapy Systems Market Size (In Million)
The market is segmented into various applications, including hospitals, nursing homes, and home-based care, with hospitals currently dominating due to specialized infrastructure and trained personnel. However, the growing adoption of mobile gait therapy systems and the increasing demand for home-use devices are reshaping the landscape, offering greater accessibility and convenience. Geographically, North America leads the market, driven by high healthcare spending, early adoption of advanced technologies, and a well-established rehabilitation infrastructure. Europe and Asia Pacific are also significant markets, with the latter expected to witness the fastest growth due to a large patient pool, improving healthcare facilities, and increasing government initiatives supporting rehabilitation services. Key players in this dynamic market include Hocoma, Thera-Trainer, Zebris, Reha Technology AG, Woodway, and Yeecon, who are actively engaged in research and development to introduce innovative and user-centric gait therapy solutions.
Gait Therapy Systems Company Market Share
Gait Therapy Systems Market Research Report: Comprehensive Analysis and Future Outlook (2019-2033)
This in-depth market research report provides an exhaustive analysis of the global Gait Therapy Systems market. Covering the historical period of 2019-2024, the base year of 2025, and a forecast period extending to 2033, the report offers critical insights into market dynamics, growth trends, regional dominance, product landscape, key drivers, emerging opportunities, and leading players. Designed for industry professionals, investors, and stakeholders, this report equips you with the strategic intelligence needed to navigate this rapidly evolving sector.
Gait Therapy Systems Market Dynamics & Structure
The gait therapy systems market exhibits a moderate to high concentration, with key players like Hocoma, Thera-Trainer, and Zebris actively investing in technological advancements to drive innovation. The primary drivers of this market are the increasing prevalence of neurological disorders, age-related mobility issues, and a growing emphasis on rehabilitation outcomes. Regulatory frameworks, particularly those focusing on medical device safety and efficacy, play a significant role in shaping product development and market entry. Competitive product substitutes include traditional physiotherapy methods and less sophisticated assistive devices. End-user demographics are shifting towards an aging population requiring long-term care and a growing demand for home-based rehabilitation solutions. Mergers and acquisitions (M&A) are expected to continue as companies seek to expand their product portfolios and geographical reach, with an estimated X number of deals anticipated during the forecast period.
- Market Concentration: Moderate to High, with key players dominating research and development.
- Technological Innovation Drivers: Advancements in robotics, artificial intelligence (AI), sensor technology, and virtual reality (VR) are crucial.
- Regulatory Frameworks: FDA, CE marking, and other regional health authorities influence product approval and market access.
- Competitive Product Substitutes: Traditional manual therapy, basic exercise equipment, and non-specialized mobility aids.
- End-User Demographics: Aging population, individuals with stroke, spinal cord injuries, Parkinson's disease, and other neurological conditions.
- M&A Trends: Expected to increase as companies pursue consolidation and market expansion.
Gait Therapy Systems Growth Trends & Insights
The gait therapy systems market is projected for robust growth, driven by an escalating global demand for effective rehabilitation solutions. The market size is anticipated to expand from an estimated $XXX million in 2025 to over $YYY million by 2033, demonstrating a Compound Annual Growth Rate (CAGR) of approximately XX%. Adoption rates are accelerating, particularly in developed economies, as awareness of the benefits of early and consistent gait training increases. Technological disruptions are at the forefront of this growth, with the integration of AI-powered analytics for personalized therapy plans and VR environments offering immersive and engaging rehabilitation experiences. Consumer behavior shifts are also significant, with a growing preference for home-based therapy solutions, necessitating the development of user-friendly and portable gait training devices. The market penetration of advanced gait therapy systems, while still relatively low in some regions, is expected to rise significantly as costs decrease and accessibility improves. The increasing burden of chronic diseases and the focus on improving patient quality of life post-injury or illness are fundamental pillars supporting this upward trajectory.
Dominant Regions, Countries, or Segments in Gait Therapy Systems
North America is poised to emerge as the dominant region in the global gait therapy systems market, driven by a confluence of factors including a high prevalence of neurological disorders, a well-established healthcare infrastructure, and significant investment in healthcare research and development. The United States, in particular, leads this dominance with a substantial market share estimated at XX% of the global total in 2025. This leadership is attributed to advanced reimbursement policies for rehabilitation services, a large aging population, and a strong adoption rate of innovative medical technologies.
Application:
- Hospital: Currently the largest segment, benefiting from specialized rehabilitation centers and skilled professionals. Projected to reach $XXX million by 2033.
- Nursing Home: Experiencing rapid growth due to the increasing elderly population and demand for continuous care. Expected to grow at a CAGR of XX% during the forecast period.
- Home: Witnessing the fastest expansion, fueled by the desire for convenience, cost-effectiveness, and personalized therapy. Estimated to reach $YYY million by 2033.
Type:
- Mobile Type: Gaining traction due to its portability and flexibility, enabling therapy in various settings, including homes. Projected to capture XX% of the market by 2033.
- Fixed Type: Continues to be a significant segment, especially in clinical settings, offering stability and advanced features.
Key drivers for North America's dominance include favorable government initiatives promoting geriatric care and rehabilitation, a robust pipeline of new product launches by leading manufacturers like Hocoma and Thera-Trainer, and a high disposable income that supports the adoption of advanced medical devices. Furthermore, the increasing incidence of conditions like stroke and Parkinson's disease necessitates continuous and advanced gait training. The growing awareness among healthcare providers and patients about the efficacy of technologically advanced gait therapy systems in improving functional recovery is another critical factor.
Gait Therapy Systems Product Landscape
The gait therapy systems product landscape is characterized by continuous innovation, focusing on enhancing patient outcomes and therapist efficiency. Current offerings include advanced robotic exoskeletons, treadmill-based systems with integrated virtual reality, and sensor-based motion analysis platforms. These products are designed to provide personalized, intensive, and data-driven gait training, catering to a wide spectrum of neurological and musculoskeletal conditions. Key advancements include intuitive user interfaces, real-time performance feedback, and adaptive difficulty levels that dynamically adjust to the patient's progress. Products from companies like Reha Technology AG and Woodway are at the forefront of integrating AI for predictive analytics and personalized therapy protocols, offering superior performance metrics and unique selling propositions that differentiate them in a competitive market.
Key Drivers, Barriers & Challenges in Gait Therapy Systems
Key Drivers:
- Rising Incidence of Neurological Disorders: Growing numbers of stroke, Parkinson's disease, and spinal cord injuries worldwide fuel the demand for rehabilitation.
- Aging Global Population: An increasing elderly demographic requires assistive technologies for mobility and fall prevention.
- Technological Advancements: Innovations in robotics, AI, and VR are enhancing the efficacy and engagement of gait therapy.
- Growing Emphasis on Rehabilitation: Healthcare systems are increasingly prioritizing functional recovery and quality of life post-injury or illness.
- Demand for Home-Based Therapy: Convenience and cost-effectiveness are driving the adoption of portable and user-friendly systems for home use.
Barriers & Challenges:
- High Initial Cost: Advanced gait therapy systems can be expensive, limiting accessibility for some healthcare facilities and individuals.
- Reimbursement Policies: Inconsistent or inadequate reimbursement from insurance providers can hinder market penetration.
- Lack of Skilled Professionals: A shortage of trained therapists to operate and interpret data from complex systems poses a challenge.
- Regulatory Hurdles: Stringent approval processes for medical devices can delay market entry.
- Interoperability Issues: Ensuring seamless integration of gait therapy systems with existing electronic health records (EHRs) remains a challenge.
- Supply Chain Disruptions: Global events can impact the availability of critical components and finished products. The estimated impact of supply chain disruptions on market growth could be around XX% reduction in the forecast period.
Emerging Opportunities in Gait Therapy Systems
Emerging opportunities in the gait therapy systems market are abundant, driven by evolving patient needs and technological frontiers. The integration of wearable sensors for continuous, real-time monitoring of gait patterns outside of clinical settings presents a significant avenue for growth. Tele-rehabilitation platforms leveraging these sensors and AI algorithms can provide remote patient management and personalized interventions, expanding access to care in underserved areas. Furthermore, the development of more affordable and user-friendly mobile gait therapy systems tailored for home use presents a substantial untapped market. The application of gamification and virtual reality for pediatric rehabilitation also holds immense potential, making therapy more engaging and effective for younger patients. Companies like Yeecon are exploring novel applications for gait analysis in sports performance and injury prevention, opening up new market segments.
Growth Accelerators in the Gait Therapy Systems Industry
Several key catalysts are accelerating the long-term growth of the gait therapy systems industry. Continued technological breakthroughs, particularly in miniaturization of robotics, advancements in AI for predictive diagnostics, and the development of more sophisticated VR rehabilitation environments, will significantly enhance product capabilities and therapeutic outcomes. Strategic partnerships between technology providers, healthcare institutions, and research organizations are crucial for accelerating product development and clinical validation. Market expansion strategies, including focusing on emerging economies with growing healthcare expenditures and increasing demand for advanced medical technologies, will also be pivotal. The increasing focus on preventive healthcare and the desire for individuals to maintain an active and independent lifestyle well into old age are further reinforcing the demand for effective gait training solutions.
Key Players Shaping the Gait Therapy Systems Market
- Hocoma
- Thera-Trainer
- Zebris
- Reha Technology AG
- Woodway
- Yeecon
Notable Milestones in Gait Therapy Systems Sector
- 2019: Hocoma launches advanced Lokomat model with enhanced AI integration.
- 2020: Thera-Trainer introduces a new generation of passive-assistive therapy devices.
- 2021: Zebris expands its product line with high-precision 3D motion capture systems for gait analysis.
- 2022: Reha Technology AG announces strategic partnerships for global market expansion.
- 2023: Woodway unveils innovative treadmill technology for intensive gait rehabilitation.
- 2024: Yeecon introduces novel robotic exoskeletons for home-use rehabilitation.
- 2025 (Estimated): Anticipated launch of AI-driven personalized gait therapy platforms by multiple key players.
- 2026 (Estimated): Significant growth expected in the adoption of VR-enhanced gait therapy systems.
- 2028 (Estimated): Introduction of more affordable and accessible mobile gait therapy solutions for home use.
- 2030 (Estimated): Increased integration of gait therapy data with comprehensive patient health records.
- 2033 (Estimated): Widespread adoption of tele-rehabilitation models for gait therapy.
In-Depth Gait Therapy Systems Market Outlook
The future outlook for the gait therapy systems market is exceptionally promising, characterized by sustained growth driven by a synergistic blend of technological innovation and evolving healthcare demands. As advancements in AI, robotics, and VR continue to mature, gait therapy systems will become more intelligent, adaptive, and personalized, leading to demonstrably improved patient outcomes. The increasing global prevalence of neurological conditions and the demographic shift towards an aging population will continue to be significant demand drivers. Furthermore, the ongoing trend towards decentralized healthcare models, with a greater emphasis on home-based and community-level rehabilitation, will create substantial opportunities for manufacturers of user-friendly and portable gait therapy solutions. Strategic collaborations and continuous product development will be instrumental in capitalizing on these opportunities and shaping a more accessible and effective future for gait rehabilitation worldwide.
Gait Therapy Systems Segmentation
-
1. Application
- 1.1. Hospital
- 1.2. Nursing Home
- 1.3. Home
-
2. Type
- 2.1. Mobile Type
- 2.2. Fixed Type
Gait Therapy Systems Segmentation By Geography
-
1. North America
- 1.1. United States
- 1.2. Canada
- 1.3. Mexico
-
2. South America
- 2.1. Brazil
- 2.2. Argentina
- 2.3. Rest of South America
-
3. Europe
- 3.1. United Kingdom
- 3.2. Germany
- 3.3. France
- 3.4. Italy
- 3.5. Spain
- 3.6. Russia
- 3.7. Benelux
- 3.8. Nordics
- 3.9. Rest of Europe
-
4. Middle East & Africa
- 4.1. Turkey
- 4.2. Israel
- 4.3. GCC
- 4.4. North Africa
- 4.5. South Africa
- 4.6. Rest of Middle East & Africa
-
5. Asia Pacific
- 5.1. China
- 5.2. India
- 5.3. Japan
- 5.4. South Korea
- 5.5. ASEAN
- 5.6. Oceania
- 5.7. Rest of Asia Pacific
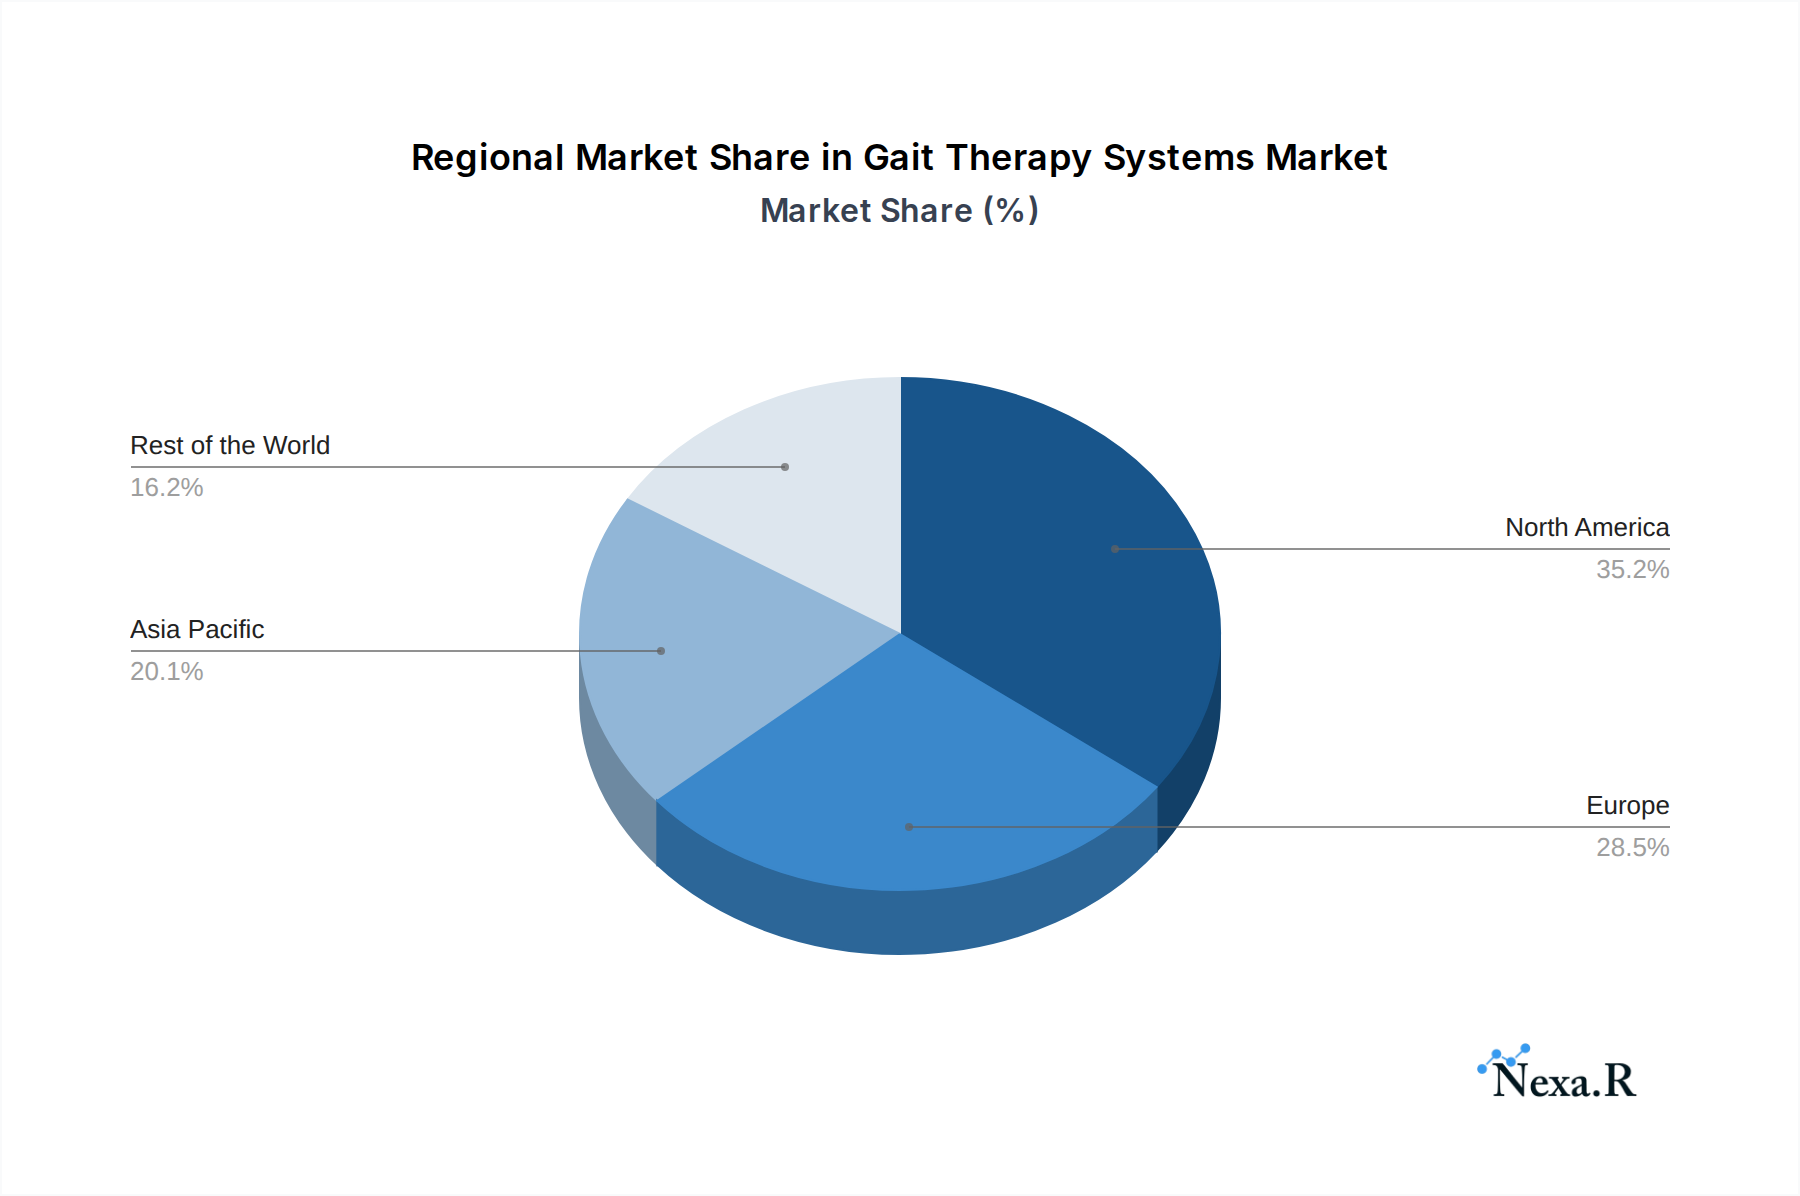
Gait Therapy Systems Regional Market Share
Geographic Coverage of Gait Therapy Systems
Gait Therapy Systems REPORT HIGHLIGHTS
| Aspects | Details |
|---|---|
| Study Period | 2020-2034 |
| Base Year | 2025 |
| Estimated Year | 2026 |
| Forecast Period | 2026-2034 |
| Historical Period | 2020-2025 |
| Growth Rate | CAGR of 6.4% from 2020-2034 |
| Segmentation |
|
Table of Contents
- 1. Introduction
- 1.1. Research Scope
- 1.2. Market Segmentation
- 1.3. Research Methodology
- 1.4. Definitions and Assumptions
- 2. Executive Summary
- 2.1. Introduction
- 3. Market Dynamics
- 3.1. Introduction
- 3.2. Market Drivers
- 3.3. Market Restrains
- 3.4. Market Trends
- 4. Market Factor Analysis
- 4.1. Porters Five Forces
- 4.2. Supply/Value Chain
- 4.3. PESTEL analysis
- 4.4. Market Entropy
- 4.5. Patent/Trademark Analysis
- 5. Global Gait Therapy Systems Analysis, Insights and Forecast, 2020-2032
- 5.1. Market Analysis, Insights and Forecast - by Application
- 5.1.1. Hospital
- 5.1.2. Nursing Home
- 5.1.3. Home
- 5.2. Market Analysis, Insights and Forecast - by Type
- 5.2.1. Mobile Type
- 5.2.2. Fixed Type
- 5.3. Market Analysis, Insights and Forecast - by Region
- 5.3.1. North America
- 5.3.2. South America
- 5.3.3. Europe
- 5.3.4. Middle East & Africa
- 5.3.5. Asia Pacific
- 5.1. Market Analysis, Insights and Forecast - by Application
- 6. North America Gait Therapy Systems Analysis, Insights and Forecast, 2020-2032
- 6.1. Market Analysis, Insights and Forecast - by Application
- 6.1.1. Hospital
- 6.1.2. Nursing Home
- 6.1.3. Home
- 6.2. Market Analysis, Insights and Forecast - by Type
- 6.2.1. Mobile Type
- 6.2.2. Fixed Type
- 6.1. Market Analysis, Insights and Forecast - by Application
- 7. South America Gait Therapy Systems Analysis, Insights and Forecast, 2020-2032
- 7.1. Market Analysis, Insights and Forecast - by Application
- 7.1.1. Hospital
- 7.1.2. Nursing Home
- 7.1.3. Home
- 7.2. Market Analysis, Insights and Forecast - by Type
- 7.2.1. Mobile Type
- 7.2.2. Fixed Type
- 7.1. Market Analysis, Insights and Forecast - by Application
- 8. Europe Gait Therapy Systems Analysis, Insights and Forecast, 2020-2032
- 8.1. Market Analysis, Insights and Forecast - by Application
- 8.1.1. Hospital
- 8.1.2. Nursing Home
- 8.1.3. Home
- 8.2. Market Analysis, Insights and Forecast - by Type
- 8.2.1. Mobile Type
- 8.2.2. Fixed Type
- 8.1. Market Analysis, Insights and Forecast - by Application
- 9. Middle East & Africa Gait Therapy Systems Analysis, Insights and Forecast, 2020-2032
- 9.1. Market Analysis, Insights and Forecast - by Application
- 9.1.1. Hospital
- 9.1.2. Nursing Home
- 9.1.3. Home
- 9.2. Market Analysis, Insights and Forecast - by Type
- 9.2.1. Mobile Type
- 9.2.2. Fixed Type
- 9.1. Market Analysis, Insights and Forecast - by Application
- 10. Asia Pacific Gait Therapy Systems Analysis, Insights and Forecast, 2020-2032
- 10.1. Market Analysis, Insights and Forecast - by Application
- 10.1.1. Hospital
- 10.1.2. Nursing Home
- 10.1.3. Home
- 10.2. Market Analysis, Insights and Forecast - by Type
- 10.2.1. Mobile Type
- 10.2.2. Fixed Type
- 10.1. Market Analysis, Insights and Forecast - by Application
- 11. Competitive Analysis
- 11.1. Global Market Share Analysis 2025
- 11.2. Company Profiles
- 11.2.1 Hocoma
- 11.2.1.1. Overview
- 11.2.1.2. Products
- 11.2.1.3. SWOT Analysis
- 11.2.1.4. Recent Developments
- 11.2.1.5. Financials (Based on Availability)
- 11.2.2 Thera-Trainer
- 11.2.2.1. Overview
- 11.2.2.2. Products
- 11.2.2.3. SWOT Analysis
- 11.2.2.4. Recent Developments
- 11.2.2.5. Financials (Based on Availability)
- 11.2.3 Zebris
- 11.2.3.1. Overview
- 11.2.3.2. Products
- 11.2.3.3. SWOT Analysis
- 11.2.3.4. Recent Developments
- 11.2.3.5. Financials (Based on Availability)
- 11.2.4 Reha Technology AG
- 11.2.4.1. Overview
- 11.2.4.2. Products
- 11.2.4.3. SWOT Analysis
- 11.2.4.4. Recent Developments
- 11.2.4.5. Financials (Based on Availability)
- 11.2.5 Woodway
- 11.2.5.1. Overview
- 11.2.5.2. Products
- 11.2.5.3. SWOT Analysis
- 11.2.5.4. Recent Developments
- 11.2.5.5. Financials (Based on Availability)
- 11.2.6 Yeecon
- 11.2.6.1. Overview
- 11.2.6.2. Products
- 11.2.6.3. SWOT Analysis
- 11.2.6.4. Recent Developments
- 11.2.6.5. Financials (Based on Availability)
- 11.2.1 Hocoma
List of Figures
- Figure 1: Global Gait Therapy Systems Revenue Breakdown (million, %) by Region 2025 & 2033
- Figure 2: Global Gait Therapy Systems Volume Breakdown (K, %) by Region 2025 & 2033
- Figure 3: North America Gait Therapy Systems Revenue (million), by Application 2025 & 2033
- Figure 4: North America Gait Therapy Systems Volume (K), by Application 2025 & 2033
- Figure 5: North America Gait Therapy Systems Revenue Share (%), by Application 2025 & 2033
- Figure 6: North America Gait Therapy Systems Volume Share (%), by Application 2025 & 2033
- Figure 7: North America Gait Therapy Systems Revenue (million), by Type 2025 & 2033
- Figure 8: North America Gait Therapy Systems Volume (K), by Type 2025 & 2033
- Figure 9: North America Gait Therapy Systems Revenue Share (%), by Type 2025 & 2033
- Figure 10: North America Gait Therapy Systems Volume Share (%), by Type 2025 & 2033
- Figure 11: North America Gait Therapy Systems Revenue (million), by Country 2025 & 2033
- Figure 12: North America Gait Therapy Systems Volume (K), by Country 2025 & 2033
- Figure 13: North America Gait Therapy Systems Revenue Share (%), by Country 2025 & 2033
- Figure 14: North America Gait Therapy Systems Volume Share (%), by Country 2025 & 2033
- Figure 15: South America Gait Therapy Systems Revenue (million), by Application 2025 & 2033
- Figure 16: South America Gait Therapy Systems Volume (K), by Application 2025 & 2033
- Figure 17: South America Gait Therapy Systems Revenue Share (%), by Application 2025 & 2033
- Figure 18: South America Gait Therapy Systems Volume Share (%), by Application 2025 & 2033
- Figure 19: South America Gait Therapy Systems Revenue (million), by Type 2025 & 2033
- Figure 20: South America Gait Therapy Systems Volume (K), by Type 2025 & 2033
- Figure 21: South America Gait Therapy Systems Revenue Share (%), by Type 2025 & 2033
- Figure 22: South America Gait Therapy Systems Volume Share (%), by Type 2025 & 2033
- Figure 23: South America Gait Therapy Systems Revenue (million), by Country 2025 & 2033
- Figure 24: South America Gait Therapy Systems Volume (K), by Country 2025 & 2033
- Figure 25: South America Gait Therapy Systems Revenue Share (%), by Country 2025 & 2033
- Figure 26: South America Gait Therapy Systems Volume Share (%), by Country 2025 & 2033
- Figure 27: Europe Gait Therapy Systems Revenue (million), by Application 2025 & 2033
- Figure 28: Europe Gait Therapy Systems Volume (K), by Application 2025 & 2033
- Figure 29: Europe Gait Therapy Systems Revenue Share (%), by Application 2025 & 2033
- Figure 30: Europe Gait Therapy Systems Volume Share (%), by Application 2025 & 2033
- Figure 31: Europe Gait Therapy Systems Revenue (million), by Type 2025 & 2033
- Figure 32: Europe Gait Therapy Systems Volume (K), by Type 2025 & 2033
- Figure 33: Europe Gait Therapy Systems Revenue Share (%), by Type 2025 & 2033
- Figure 34: Europe Gait Therapy Systems Volume Share (%), by Type 2025 & 2033
- Figure 35: Europe Gait Therapy Systems Revenue (million), by Country 2025 & 2033
- Figure 36: Europe Gait Therapy Systems Volume (K), by Country 2025 & 2033
- Figure 37: Europe Gait Therapy Systems Revenue Share (%), by Country 2025 & 2033
- Figure 38: Europe Gait Therapy Systems Volume Share (%), by Country 2025 & 2033
- Figure 39: Middle East & Africa Gait Therapy Systems Revenue (million), by Application 2025 & 2033
- Figure 40: Middle East & Africa Gait Therapy Systems Volume (K), by Application 2025 & 2033
- Figure 41: Middle East & Africa Gait Therapy Systems Revenue Share (%), by Application 2025 & 2033
- Figure 42: Middle East & Africa Gait Therapy Systems Volume Share (%), by Application 2025 & 2033
- Figure 43: Middle East & Africa Gait Therapy Systems Revenue (million), by Type 2025 & 2033
- Figure 44: Middle East & Africa Gait Therapy Systems Volume (K), by Type 2025 & 2033
- Figure 45: Middle East & Africa Gait Therapy Systems Revenue Share (%), by Type 2025 & 2033
- Figure 46: Middle East & Africa Gait Therapy Systems Volume Share (%), by Type 2025 & 2033
- Figure 47: Middle East & Africa Gait Therapy Systems Revenue (million), by Country 2025 & 2033
- Figure 48: Middle East & Africa Gait Therapy Systems Volume (K), by Country 2025 & 2033
- Figure 49: Middle East & Africa Gait Therapy Systems Revenue Share (%), by Country 2025 & 2033
- Figure 50: Middle East & Africa Gait Therapy Systems Volume Share (%), by Country 2025 & 2033
- Figure 51: Asia Pacific Gait Therapy Systems Revenue (million), by Application 2025 & 2033
- Figure 52: Asia Pacific Gait Therapy Systems Volume (K), by Application 2025 & 2033
- Figure 53: Asia Pacific Gait Therapy Systems Revenue Share (%), by Application 2025 & 2033
- Figure 54: Asia Pacific Gait Therapy Systems Volume Share (%), by Application 2025 & 2033
- Figure 55: Asia Pacific Gait Therapy Systems Revenue (million), by Type 2025 & 2033
- Figure 56: Asia Pacific Gait Therapy Systems Volume (K), by Type 2025 & 2033
- Figure 57: Asia Pacific Gait Therapy Systems Revenue Share (%), by Type 2025 & 2033
- Figure 58: Asia Pacific Gait Therapy Systems Volume Share (%), by Type 2025 & 2033
- Figure 59: Asia Pacific Gait Therapy Systems Revenue (million), by Country 2025 & 2033
- Figure 60: Asia Pacific Gait Therapy Systems Volume (K), by Country 2025 & 2033
- Figure 61: Asia Pacific Gait Therapy Systems Revenue Share (%), by Country 2025 & 2033
- Figure 62: Asia Pacific Gait Therapy Systems Volume Share (%), by Country 2025 & 2033
List of Tables
- Table 1: Global Gait Therapy Systems Revenue million Forecast, by Application 2020 & 2033
- Table 2: Global Gait Therapy Systems Volume K Forecast, by Application 2020 & 2033
- Table 3: Global Gait Therapy Systems Revenue million Forecast, by Type 2020 & 2033
- Table 4: Global Gait Therapy Systems Volume K Forecast, by Type 2020 & 2033
- Table 5: Global Gait Therapy Systems Revenue million Forecast, by Region 2020 & 2033
- Table 6: Global Gait Therapy Systems Volume K Forecast, by Region 2020 & 2033
- Table 7: Global Gait Therapy Systems Revenue million Forecast, by Application 2020 & 2033
- Table 8: Global Gait Therapy Systems Volume K Forecast, by Application 2020 & 2033
- Table 9: Global Gait Therapy Systems Revenue million Forecast, by Type 2020 & 2033
- Table 10: Global Gait Therapy Systems Volume K Forecast, by Type 2020 & 2033
- Table 11: Global Gait Therapy Systems Revenue million Forecast, by Country 2020 & 2033
- Table 12: Global Gait Therapy Systems Volume K Forecast, by Country 2020 & 2033
- Table 13: United States Gait Therapy Systems Revenue (million) Forecast, by Application 2020 & 2033
- Table 14: United States Gait Therapy Systems Volume (K) Forecast, by Application 2020 & 2033
- Table 15: Canada Gait Therapy Systems Revenue (million) Forecast, by Application 2020 & 2033
- Table 16: Canada Gait Therapy Systems Volume (K) Forecast, by Application 2020 & 2033
- Table 17: Mexico Gait Therapy Systems Revenue (million) Forecast, by Application 2020 & 2033
- Table 18: Mexico Gait Therapy Systems Volume (K) Forecast, by Application 2020 & 2033
- Table 19: Global Gait Therapy Systems Revenue million Forecast, by Application 2020 & 2033
- Table 20: Global Gait Therapy Systems Volume K Forecast, by Application 2020 & 2033
- Table 21: Global Gait Therapy Systems Revenue million Forecast, by Type 2020 & 2033
- Table 22: Global Gait Therapy Systems Volume K Forecast, by Type 2020 & 2033
- Table 23: Global Gait Therapy Systems Revenue million Forecast, by Country 2020 & 2033
- Table 24: Global Gait Therapy Systems Volume K Forecast, by Country 2020 & 2033
- Table 25: Brazil Gait Therapy Systems Revenue (million) Forecast, by Application 2020 & 2033
- Table 26: Brazil Gait Therapy Systems Volume (K) Forecast, by Application 2020 & 2033
- Table 27: Argentina Gait Therapy Systems Revenue (million) Forecast, by Application 2020 & 2033
- Table 28: Argentina Gait Therapy Systems Volume (K) Forecast, by Application 2020 & 2033
- Table 29: Rest of South America Gait Therapy Systems Revenue (million) Forecast, by Application 2020 & 2033
- Table 30: Rest of South America Gait Therapy Systems Volume (K) Forecast, by Application 2020 & 2033
- Table 31: Global Gait Therapy Systems Revenue million Forecast, by Application 2020 & 2033
- Table 32: Global Gait Therapy Systems Volume K Forecast, by Application 2020 & 2033
- Table 33: Global Gait Therapy Systems Revenue million Forecast, by Type 2020 & 2033
- Table 34: Global Gait Therapy Systems Volume K Forecast, by Type 2020 & 2033
- Table 35: Global Gait Therapy Systems Revenue million Forecast, by Country 2020 & 2033
- Table 36: Global Gait Therapy Systems Volume K Forecast, by Country 2020 & 2033
- Table 37: United Kingdom Gait Therapy Systems Revenue (million) Forecast, by Application 2020 & 2033
- Table 38: United Kingdom Gait Therapy Systems Volume (K) Forecast, by Application 2020 & 2033
- Table 39: Germany Gait Therapy Systems Revenue (million) Forecast, by Application 2020 & 2033
- Table 40: Germany Gait Therapy Systems Volume (K) Forecast, by Application 2020 & 2033
- Table 41: France Gait Therapy Systems Revenue (million) Forecast, by Application 2020 & 2033
- Table 42: France Gait Therapy Systems Volume (K) Forecast, by Application 2020 & 2033
- Table 43: Italy Gait Therapy Systems Revenue (million) Forecast, by Application 2020 & 2033
- Table 44: Italy Gait Therapy Systems Volume (K) Forecast, by Application 2020 & 2033
- Table 45: Spain Gait Therapy Systems Revenue (million) Forecast, by Application 2020 & 2033
- Table 46: Spain Gait Therapy Systems Volume (K) Forecast, by Application 2020 & 2033
- Table 47: Russia Gait Therapy Systems Revenue (million) Forecast, by Application 2020 & 2033
- Table 48: Russia Gait Therapy Systems Volume (K) Forecast, by Application 2020 & 2033
- Table 49: Benelux Gait Therapy Systems Revenue (million) Forecast, by Application 2020 & 2033
- Table 50: Benelux Gait Therapy Systems Volume (K) Forecast, by Application 2020 & 2033
- Table 51: Nordics Gait Therapy Systems Revenue (million) Forecast, by Application 2020 & 2033
- Table 52: Nordics Gait Therapy Systems Volume (K) Forecast, by Application 2020 & 2033
- Table 53: Rest of Europe Gait Therapy Systems Revenue (million) Forecast, by Application 2020 & 2033
- Table 54: Rest of Europe Gait Therapy Systems Volume (K) Forecast, by Application 2020 & 2033
- Table 55: Global Gait Therapy Systems Revenue million Forecast, by Application 2020 & 2033
- Table 56: Global Gait Therapy Systems Volume K Forecast, by Application 2020 & 2033
- Table 57: Global Gait Therapy Systems Revenue million Forecast, by Type 2020 & 2033
- Table 58: Global Gait Therapy Systems Volume K Forecast, by Type 2020 & 2033
- Table 59: Global Gait Therapy Systems Revenue million Forecast, by Country 2020 & 2033
- Table 60: Global Gait Therapy Systems Volume K Forecast, by Country 2020 & 2033
- Table 61: Turkey Gait Therapy Systems Revenue (million) Forecast, by Application 2020 & 2033
- Table 62: Turkey Gait Therapy Systems Volume (K) Forecast, by Application 2020 & 2033
- Table 63: Israel Gait Therapy Systems Revenue (million) Forecast, by Application 2020 & 2033
- Table 64: Israel Gait Therapy Systems Volume (K) Forecast, by Application 2020 & 2033
- Table 65: GCC Gait Therapy Systems Revenue (million) Forecast, by Application 2020 & 2033
- Table 66: GCC Gait Therapy Systems Volume (K) Forecast, by Application 2020 & 2033
- Table 67: North Africa Gait Therapy Systems Revenue (million) Forecast, by Application 2020 & 2033
- Table 68: North Africa Gait Therapy Systems Volume (K) Forecast, by Application 2020 & 2033
- Table 69: South Africa Gait Therapy Systems Revenue (million) Forecast, by Application 2020 & 2033
- Table 70: South Africa Gait Therapy Systems Volume (K) Forecast, by Application 2020 & 2033
- Table 71: Rest of Middle East & Africa Gait Therapy Systems Revenue (million) Forecast, by Application 2020 & 2033
- Table 72: Rest of Middle East & Africa Gait Therapy Systems Volume (K) Forecast, by Application 2020 & 2033
- Table 73: Global Gait Therapy Systems Revenue million Forecast, by Application 2020 & 2033
- Table 74: Global Gait Therapy Systems Volume K Forecast, by Application 2020 & 2033
- Table 75: Global Gait Therapy Systems Revenue million Forecast, by Type 2020 & 2033
- Table 76: Global Gait Therapy Systems Volume K Forecast, by Type 2020 & 2033
- Table 77: Global Gait Therapy Systems Revenue million Forecast, by Country 2020 & 2033
- Table 78: Global Gait Therapy Systems Volume K Forecast, by Country 2020 & 2033
- Table 79: China Gait Therapy Systems Revenue (million) Forecast, by Application 2020 & 2033
- Table 80: China Gait Therapy Systems Volume (K) Forecast, by Application 2020 & 2033
- Table 81: India Gait Therapy Systems Revenue (million) Forecast, by Application 2020 & 2033
- Table 82: India Gait Therapy Systems Volume (K) Forecast, by Application 2020 & 2033
- Table 83: Japan Gait Therapy Systems Revenue (million) Forecast, by Application 2020 & 2033
- Table 84: Japan Gait Therapy Systems Volume (K) Forecast, by Application 2020 & 2033
- Table 85: South Korea Gait Therapy Systems Revenue (million) Forecast, by Application 2020 & 2033
- Table 86: South Korea Gait Therapy Systems Volume (K) Forecast, by Application 2020 & 2033
- Table 87: ASEAN Gait Therapy Systems Revenue (million) Forecast, by Application 2020 & 2033
- Table 88: ASEAN Gait Therapy Systems Volume (K) Forecast, by Application 2020 & 2033
- Table 89: Oceania Gait Therapy Systems Revenue (million) Forecast, by Application 2020 & 2033
- Table 90: Oceania Gait Therapy Systems Volume (K) Forecast, by Application 2020 & 2033
- Table 91: Rest of Asia Pacific Gait Therapy Systems Revenue (million) Forecast, by Application 2020 & 2033
- Table 92: Rest of Asia Pacific Gait Therapy Systems Volume (K) Forecast, by Application 2020 & 2033
Frequently Asked Questions
1. What is the projected Compound Annual Growth Rate (CAGR) of the Gait Therapy Systems?
The projected CAGR is approximately 6.4%.
2. Which companies are prominent players in the Gait Therapy Systems?
Key companies in the market include Hocoma, Thera-Trainer, Zebris, Reha Technology AG, Woodway, Yeecon.
3. What are the main segments of the Gait Therapy Systems?
The market segments include Application, Type.
4. Can you provide details about the market size?
The market size is estimated to be USD 367 million as of 2022.
5. What are some drivers contributing to market growth?
N/A
6. What are the notable trends driving market growth?
N/A
7. Are there any restraints impacting market growth?
N/A
8. Can you provide examples of recent developments in the market?
N/A
9. What pricing options are available for accessing the report?
Pricing options include single-user, multi-user, and enterprise licenses priced at USD 3950.00, USD 5925.00, and USD 7900.00 respectively.
10. Is the market size provided in terms of value or volume?
The market size is provided in terms of value, measured in million and volume, measured in K.
11. Are there any specific market keywords associated with the report?
Yes, the market keyword associated with the report is "Gait Therapy Systems," which aids in identifying and referencing the specific market segment covered.
12. How do I determine which pricing option suits my needs best?
The pricing options vary based on user requirements and access needs. Individual users may opt for single-user licenses, while businesses requiring broader access may choose multi-user or enterprise licenses for cost-effective access to the report.
13. Are there any additional resources or data provided in the Gait Therapy Systems report?
While the report offers comprehensive insights, it's advisable to review the specific contents or supplementary materials provided to ascertain if additional resources or data are available.
14. How can I stay updated on further developments or reports in the Gait Therapy Systems?
To stay informed about further developments, trends, and reports in the Gait Therapy Systems, consider subscribing to industry newsletters, following relevant companies and organizations, or regularly checking reputable industry news sources and publications.
Methodology
Step 1 - Identification of Relevant Samples Size from Population Database


Step 2 - Approaches for Defining Global Market Size (Value, Volume* & Price*)

Note*: In applicable scenarios
Step 3 - Data Sources
Primary Research
- Web Analytics
- Survey Reports
- Research Institute
- Latest Research Reports
- Opinion Leaders
Secondary Research
- Annual Reports
- White Paper
- Latest Press Release
- Industry Association
- Paid Database
- Investor Presentations

Step 4 - Data Triangulation
Involves using different sources of information in order to increase the validity of a study
These sources are likely to be stakeholders in a program - participants, other researchers, program staff, other community members, and so on.
Then we put all data in single framework & apply various statistical tools to find out the dynamic on the market.
During the analysis stage, feedback from the stakeholder groups would be compared to determine areas of agreement as well as areas of divergence