

Key Insights
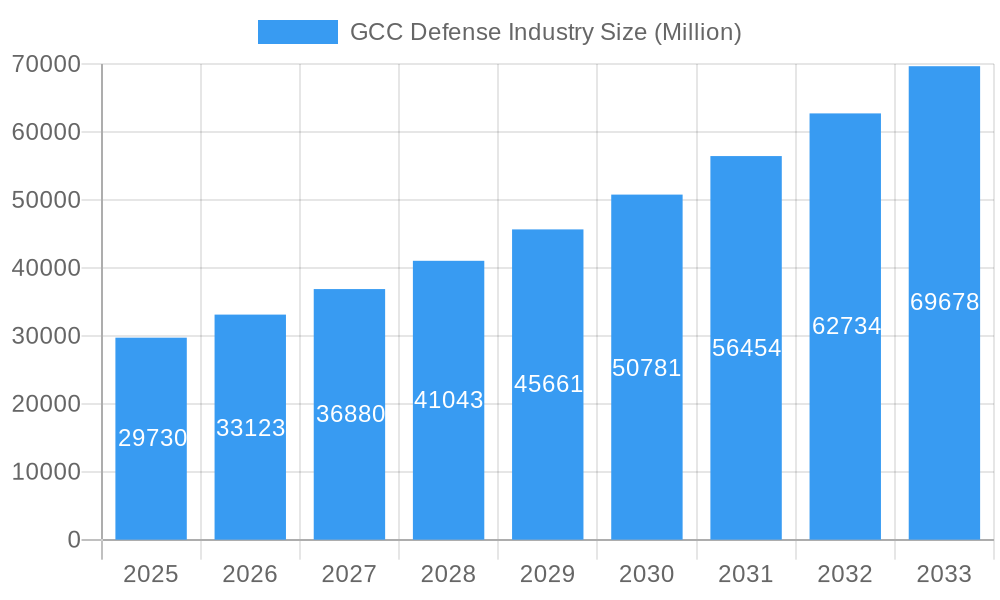
The GCC (Gulf Cooperation Council) defense industry is experiencing robust growth, projected to reach a market size of $29.73 billion in 2025, expanding at a Compound Annual Growth Rate (CAGR) of 11.04% from 2025 to 2033. This surge is driven by several factors. Geopolitical instability in the region necessitates significant investments in military modernization and strengthening national security capabilities. Furthermore, a rising threat of terrorism and regional conflicts fuel demand for advanced defense technologies, including sophisticated communication systems, cutting-edge weaponry, and robust protection equipment. The increasing focus on personnel training and protection programs, coupled with the modernization of armed forces across the Army, Navy, and Air Force, further contributes to market expansion. Key players such as L3Harris Technologies Inc., Thales, Leonardo SpA, and Rheinmetall AG are capitalizing on this growth, actively competing to provide state-of-the-art solutions to the GCC nations. The market segmentation across different equipment types (protection equipment, communication systems, vehicles, air-based vehicles, weapons, and ammunition) allows for specialized technological development and tailored solutions for diverse military needs. The regional distribution of the market, with Saudi Arabia, the UAE, Qatar, Kuwait, Oman, and Bahrain as key contributors, indicates a significant focus on national defense strategies and technological advancement across the entire region. Future growth is likely influenced by government spending priorities, technological advancements in defense technologies, and evolving geopolitical landscapes. The focus on domestic production and partnerships with international players is shaping the competitive dynamics within this dynamic and expanding sector.

GCC Defense Industry Market Size (In Billion)
The forecast period from 2025 to 2033 promises continued growth, spurred by ongoing investments in advanced weaponry, cybersecurity infrastructure, and military training programs. The modernization of existing equipment and the adoption of innovative technologies such as AI, unmanned systems, and cyber warfare capabilities are likely to define the trajectory of this industry. However, global economic uncertainties and potential shifts in geopolitical alliances could introduce challenges, impacting the pace of growth. Nevertheless, the long-term outlook remains positive, with strong prospects for companies that can offer advanced, reliable, and cost-effective solutions to the unique security needs of the GCC nations. The region's focus on diversifying its economies and building strategic partnerships also presents opportunities for international defense companies seeking to gain a foothold in this lucrative market.
GCC Defense Industry Company Market Share
GCC Defense Industry Market Report: 2019-2033
This comprehensive report provides an in-depth analysis of the GCC defense industry, encompassing market dynamics, growth trends, key players, and future outlook. With a focus on the parent market (GCC Defense) and its child markets (Protection Equipment, Air-based Vehicles, etc.), this report offers invaluable insights for industry professionals, investors, and strategic decision-makers. The study period covers 2019-2033, with a base year of 2025 and a forecast period of 2025-2033. Market values are presented in millions of units.
GCC Defense Industry Market Dynamics & Structure
The GCC defense market is characterized by a moderately concentrated landscape, with key players like Lockheed Martin Corporation, THALES, and BAE Systems PLC holding significant market share. Technological innovation, driven by the need for advanced weaponry and cybersecurity, is a primary growth driver. Stringent regulatory frameworks and regional geopolitical factors significantly influence market dynamics. Competition from global players and the emergence of domestic defense manufacturers are shaping the competitive landscape. Furthermore, M&A activity plays a crucial role in market consolidation and technological advancement.
- Market Concentration: Highly concentrated, with top 5 players holding approximately xx% market share in 2025.
- Technological Innovation: Focus on AI, unmanned systems, cyber warfare, and missile defense technologies.
- Regulatory Framework: Stringent regulations governing arms sales and technology transfer.
- Competitive Substitutes: Limited direct substitutes, but competition from alternative defense solutions.
- End-User Demographics: Predominantly government agencies (Army, Navy, Air Force) across GCC countries.
- M&A Trends: Significant M&A activity observed in the historical period (2019-2024), with an average of xx deals annually, predominantly focused on technology acquisition and expansion.
GCC Defense Industry Growth Trends & Insights
The GCC defense market experienced robust growth during the historical period (2019-2024), driven by rising geopolitical tensions, increasing defense budgets, and modernization initiatives across the region. The market is projected to maintain a strong CAGR of xx% during the forecast period (2025-2033), reaching a value of xx million by 2033. This growth is fueled by continuous technological advancements, adoption of sophisticated defense systems, and growing regional security concerns. The market penetration of advanced technologies like AI and unmanned systems is expected to increase significantly. Consumer behavior shifts towards prioritizing advanced defense capabilities are further driving market growth. Specific market segments such as air-based vehicles and communication systems are expected to demonstrate higher growth rates than others due to their critical role in modern warfare.
Dominant Regions, Countries, or Segments in GCC Defense Industry
Saudi Arabia and the UAE are the leading markets within the GCC, accounting for the largest share of defense spending and driving significant growth in various segments. The Army segment commands the largest share of the market due to its extensive operational needs. Within the product segments, Air-based vehicles (particularly fighter jets and related weaponry) and Communication Systems demonstrate strong market dominance driven by the high demand for advanced air defense capabilities and communication infrastructure. Protection equipment is also a major segment, focusing on advanced body armor, communication devices, and protective vehicles.
- Key Drivers: Increased defense budgets, modernization programs, geopolitical instability.
- Saudi Arabia: Largest market share driven by high defense spending and strategic investments.
- UAE: Strong growth driven by significant investment in advanced defense systems and technologies.
- Army Segment: Largest market share due to its extensive requirements across various weapon systems.
- Air-based Vehicles: High demand for advanced fighter jets and related systems.
- Communication Systems: Strong growth due to increased demand for secure and reliable communication networks.
GCC Defense Industry Product Landscape
The GCC defense industry is characterized by a diverse product landscape encompassing advanced weaponry, communication systems, protective equipment, and training solutions. Recent innovations include AI-powered systems, unmanned aerial vehicles (UAVs), and advanced missile defense technologies. These products offer enhanced precision, improved situational awareness, and greater operational efficiency. Key performance indicators include range, accuracy, lethality, and survivability. Unique selling propositions revolve around advanced features, operational flexibility, and integration capabilities.
Key Drivers, Barriers & Challenges in GCC Defense Industry
Key Drivers: Rising geopolitical tensions, increased defense budgets, modernization of armed forces, technological advancements in weaponry and communication systems, and strategic partnerships with international defense contractors.
Challenges: Economic fluctuations impacting defense spending, stringent regulatory frameworks, dependence on foreign technology and expertise, and supply chain disruptions. These challenges have resulted in a xx% reduction in planned procurement for certain systems in the past year.
Emerging Opportunities in GCC Defense Industry
Emerging opportunities lie in the increasing adoption of unmanned systems, AI-powered solutions, cybersecurity enhancements, and the development of indigenous defense capabilities. Untapped markets exist in areas like cyber defense, space-based defense systems, and homeland security solutions. Evolving consumer preferences emphasize greater technological sophistication, improved interoperability, and enhanced cost-effectiveness.
Growth Accelerators in the GCC Defense Industry
Long-term growth will be significantly driven by continued investment in technological innovation, strategic partnerships between regional and international players, expansion into new markets, particularly in the cybersecurity and space defense sectors, and ongoing regional investment in armed force modernization projects.
Key Players Shaping the GCC Defense Industry Market
- L3Harris Technologies Inc
- THALES
- Leonardo SpA
- Rheinmetall AG
- Elbit Systems Ltd
- Lockheed Martin Corporation
- Airbus SE
- ASELSAN AS
- IAI
- BAE Systems PLC
- RTX Corporation
- Dahra Engineering & Security Services LLC
- EDGE Group PJSC
- Saudi Arabian Military Industries (SAMI)
- Northrop Grumman Corporation
- The Boeing Company
Notable Milestones in GCC Defense Industry Sector
- February 2024: Lockheed Martin Corporation signs an agreement with Saudi Arabian companies to manufacture components of its THAAD missile defense system.
- March 2023: Bahrain announces the delivery of the latest F-16s in 2024 and 2025.
In-Depth GCC Defense Industry Market Outlook
The GCC defense market presents significant long-term growth potential, driven by sustained investment in technological advancements, regional security concerns, and the ongoing modernization of armed forces across the region. Strategic opportunities exist for companies that can provide cutting-edge solutions, leverage strategic partnerships, and effectively navigate the regulatory landscape. The market is poised for continued expansion, with a focus on advanced technologies and enhanced regional self-sufficiency in defense capabilities.
GCC Defense Industry Segmentation
-
1. Armed Forces
- 1.1. Army
- 1.2. Navy
- 1.3. Air Force
-
2. Type
-
2.1. Personnel Training and Protection
- 2.1.1. Training and Simulation
- 2.1.2. Protection Equipment
- 2.2. Communication Systems
-
2.3. Vehicles
- 2.3.1. Land-based Vehicles
- 2.3.2. Sea-based Vehicles
- 2.3.3. Air-based Vehicles
-
2.4. Weapons and Ammunition
- 2.4.1. Artillery and Mortar Systems
- 2.4.2. Infantry Weapons
- 2.4.3. Missiles and Missile Defense Systems
-
2.1. Personnel Training and Protection
-
3. Geography
- 3.1. Saudi Arabia
- 3.2. United Arab Emirates
- 3.3. Qatar
- 3.4. Kuwait
- 3.5. Bahrain
- 3.6. Oman
GCC Defense Industry Segmentation By Geography
- 1. Saudi Arabia
- 2. United Arab Emirates
- 3. Qatar
- 4. Kuwait
- 5. Bahrain
- 6. Oman

GCC Defense Industry Regional Market Share
Geographic Coverage of GCC Defense Industry
GCC Defense Industry REPORT HIGHLIGHTS
| Aspects | Details |
|---|---|
| Study Period | 2020-2034 |
| Base Year | 2025 |
| Estimated Year | 2026 |
| Forecast Period | 2026-2034 |
| Historical Period | 2020-2025 |
| Growth Rate | CAGR of 11.04% from 2020-2034 |
| Segmentation |
|
Table of Contents
- 1. Introduction
- 1.1. Research Scope
- 1.2. Market Segmentation
- 1.3. Research Methodology
- 1.4. Definitions and Assumptions
- 2. Executive Summary
- 2.1. Introduction
- 3. Market Dynamics
- 3.1. Introduction
- 3.2. Market Drivers
- 3.3. Market Restrains
- 3.4. Market Trends
- 3.4.1. Airforce Segment to Dominate Market Share During the Forecast Period
- 4. Market Factor Analysis
- 4.1. Porters Five Forces
- 4.2. Supply/Value Chain
- 4.3. PESTEL analysis
- 4.4. Market Entropy
- 4.5. Patent/Trademark Analysis
- 5. Global GCC Defense Industry Analysis, Insights and Forecast, 2020-2032
- 5.1. Market Analysis, Insights and Forecast - by Armed Forces
- 5.1.1. Army
- 5.1.2. Navy
- 5.1.3. Air Force
- 5.2. Market Analysis, Insights and Forecast - by Type
- 5.2.1. Personnel Training and Protection
- 5.2.1.1. Training and Simulation
- 5.2.1.2. Protection Equipment
- 5.2.2. Communication Systems
- 5.2.3. Vehicles
- 5.2.3.1. Land-based Vehicles
- 5.2.3.2. Sea-based Vehicles
- 5.2.3.3. Air-based Vehicles
- 5.2.4. Weapons and Ammunition
- 5.2.4.1. Artillery and Mortar Systems
- 5.2.4.2. Infantry Weapons
- 5.2.4.3. Missiles and Missile Defense Systems
- 5.2.1. Personnel Training and Protection
- 5.3. Market Analysis, Insights and Forecast - by Geography
- 5.3.1. Saudi Arabia
- 5.3.2. United Arab Emirates
- 5.3.3. Qatar
- 5.3.4. Kuwait
- 5.3.5. Bahrain
- 5.3.6. Oman
- 5.4. Market Analysis, Insights and Forecast - by Region
- 5.4.1. Saudi Arabia
- 5.4.2. United Arab Emirates
- 5.4.3. Qatar
- 5.4.4. Kuwait
- 5.4.5. Bahrain
- 5.4.6. Oman
- 5.1. Market Analysis, Insights and Forecast - by Armed Forces
- 6. Saudi Arabia GCC Defense Industry Analysis, Insights and Forecast, 2020-2032
- 6.1. Market Analysis, Insights and Forecast - by Armed Forces
- 6.1.1. Army
- 6.1.2. Navy
- 6.1.3. Air Force
- 6.2. Market Analysis, Insights and Forecast - by Type
- 6.2.1. Personnel Training and Protection
- 6.2.1.1. Training and Simulation
- 6.2.1.2. Protection Equipment
- 6.2.2. Communication Systems
- 6.2.3. Vehicles
- 6.2.3.1. Land-based Vehicles
- 6.2.3.2. Sea-based Vehicles
- 6.2.3.3. Air-based Vehicles
- 6.2.4. Weapons and Ammunition
- 6.2.4.1. Artillery and Mortar Systems
- 6.2.4.2. Infantry Weapons
- 6.2.4.3. Missiles and Missile Defense Systems
- 6.2.1. Personnel Training and Protection
- 6.3. Market Analysis, Insights and Forecast - by Geography
- 6.3.1. Saudi Arabia
- 6.3.2. United Arab Emirates
- 6.3.3. Qatar
- 6.3.4. Kuwait
- 6.3.5. Bahrain
- 6.3.6. Oman
- 6.1. Market Analysis, Insights and Forecast - by Armed Forces
- 7. United Arab Emirates GCC Defense Industry Analysis, Insights and Forecast, 2020-2032
- 7.1. Market Analysis, Insights and Forecast - by Armed Forces
- 7.1.1. Army
- 7.1.2. Navy
- 7.1.3. Air Force
- 7.2. Market Analysis, Insights and Forecast - by Type
- 7.2.1. Personnel Training and Protection
- 7.2.1.1. Training and Simulation
- 7.2.1.2. Protection Equipment
- 7.2.2. Communication Systems
- 7.2.3. Vehicles
- 7.2.3.1. Land-based Vehicles
- 7.2.3.2. Sea-based Vehicles
- 7.2.3.3. Air-based Vehicles
- 7.2.4. Weapons and Ammunition
- 7.2.4.1. Artillery and Mortar Systems
- 7.2.4.2. Infantry Weapons
- 7.2.4.3. Missiles and Missile Defense Systems
- 7.2.1. Personnel Training and Protection
- 7.3. Market Analysis, Insights and Forecast - by Geography
- 7.3.1. Saudi Arabia
- 7.3.2. United Arab Emirates
- 7.3.3. Qatar
- 7.3.4. Kuwait
- 7.3.5. Bahrain
- 7.3.6. Oman
- 7.1. Market Analysis, Insights and Forecast - by Armed Forces
- 8. Qatar GCC Defense Industry Analysis, Insights and Forecast, 2020-2032
- 8.1. Market Analysis, Insights and Forecast - by Armed Forces
- 8.1.1. Army
- 8.1.2. Navy
- 8.1.3. Air Force
- 8.2. Market Analysis, Insights and Forecast - by Type
- 8.2.1. Personnel Training and Protection
- 8.2.1.1. Training and Simulation
- 8.2.1.2. Protection Equipment
- 8.2.2. Communication Systems
- 8.2.3. Vehicles
- 8.2.3.1. Land-based Vehicles
- 8.2.3.2. Sea-based Vehicles
- 8.2.3.3. Air-based Vehicles
- 8.2.4. Weapons and Ammunition
- 8.2.4.1. Artillery and Mortar Systems
- 8.2.4.2. Infantry Weapons
- 8.2.4.3. Missiles and Missile Defense Systems
- 8.2.1. Personnel Training and Protection
- 8.3. Market Analysis, Insights and Forecast - by Geography
- 8.3.1. Saudi Arabia
- 8.3.2. United Arab Emirates
- 8.3.3. Qatar
- 8.3.4. Kuwait
- 8.3.5. Bahrain
- 8.3.6. Oman
- 8.1. Market Analysis, Insights and Forecast - by Armed Forces
- 9. Kuwait GCC Defense Industry Analysis, Insights and Forecast, 2020-2032
- 9.1. Market Analysis, Insights and Forecast - by Armed Forces
- 9.1.1. Army
- 9.1.2. Navy
- 9.1.3. Air Force
- 9.2. Market Analysis, Insights and Forecast - by Type
- 9.2.1. Personnel Training and Protection
- 9.2.1.1. Training and Simulation
- 9.2.1.2. Protection Equipment
- 9.2.2. Communication Systems
- 9.2.3. Vehicles
- 9.2.3.1. Land-based Vehicles
- 9.2.3.2. Sea-based Vehicles
- 9.2.3.3. Air-based Vehicles
- 9.2.4. Weapons and Ammunition
- 9.2.4.1. Artillery and Mortar Systems
- 9.2.4.2. Infantry Weapons
- 9.2.4.3. Missiles and Missile Defense Systems
- 9.2.1. Personnel Training and Protection
- 9.3. Market Analysis, Insights and Forecast - by Geography
- 9.3.1. Saudi Arabia
- 9.3.2. United Arab Emirates
- 9.3.3. Qatar
- 9.3.4. Kuwait
- 9.3.5. Bahrain
- 9.3.6. Oman
- 9.1. Market Analysis, Insights and Forecast - by Armed Forces
- 10. Bahrain GCC Defense Industry Analysis, Insights and Forecast, 2020-2032
- 10.1. Market Analysis, Insights and Forecast - by Armed Forces
- 10.1.1. Army
- 10.1.2. Navy
- 10.1.3. Air Force
- 10.2. Market Analysis, Insights and Forecast - by Type
- 10.2.1. Personnel Training and Protection
- 10.2.1.1. Training and Simulation
- 10.2.1.2. Protection Equipment
- 10.2.2. Communication Systems
- 10.2.3. Vehicles
- 10.2.3.1. Land-based Vehicles
- 10.2.3.2. Sea-based Vehicles
- 10.2.3.3. Air-based Vehicles
- 10.2.4. Weapons and Ammunition
- 10.2.4.1. Artillery and Mortar Systems
- 10.2.4.2. Infantry Weapons
- 10.2.4.3. Missiles and Missile Defense Systems
- 10.2.1. Personnel Training and Protection
- 10.3. Market Analysis, Insights and Forecast - by Geography
- 10.3.1. Saudi Arabia
- 10.3.2. United Arab Emirates
- 10.3.3. Qatar
- 10.3.4. Kuwait
- 10.3.5. Bahrain
- 10.3.6. Oman
- 10.1. Market Analysis, Insights and Forecast - by Armed Forces
- 11. Oman GCC Defense Industry Analysis, Insights and Forecast, 2020-2032
- 11.1. Market Analysis, Insights and Forecast - by Armed Forces
- 11.1.1. Army
- 11.1.2. Navy
- 11.1.3. Air Force
- 11.2. Market Analysis, Insights and Forecast - by Type
- 11.2.1. Personnel Training and Protection
- 11.2.1.1. Training and Simulation
- 11.2.1.2. Protection Equipment
- 11.2.2. Communication Systems
- 11.2.3. Vehicles
- 11.2.3.1. Land-based Vehicles
- 11.2.3.2. Sea-based Vehicles
- 11.2.3.3. Air-based Vehicles
- 11.2.4. Weapons and Ammunition
- 11.2.4.1. Artillery and Mortar Systems
- 11.2.4.2. Infantry Weapons
- 11.2.4.3. Missiles and Missile Defense Systems
- 11.2.1. Personnel Training and Protection
- 11.3. Market Analysis, Insights and Forecast - by Geography
- 11.3.1. Saudi Arabia
- 11.3.2. United Arab Emirates
- 11.3.3. Qatar
- 11.3.4. Kuwait
- 11.3.5. Bahrain
- 11.3.6. Oman
- 11.1. Market Analysis, Insights and Forecast - by Armed Forces
- 12. Competitive Analysis
- 12.1. Global Market Share Analysis 2025
- 12.2. Company Profiles
- 12.2.1 L3Harris Technologies Inc
- 12.2.1.1. Overview
- 12.2.1.2. Products
- 12.2.1.3. SWOT Analysis
- 12.2.1.4. Recent Developments
- 12.2.1.5. Financials (Based on Availability)
- 12.2.2 THALES
- 12.2.2.1. Overview
- 12.2.2.2. Products
- 12.2.2.3. SWOT Analysis
- 12.2.2.4. Recent Developments
- 12.2.2.5. Financials (Based on Availability)
- 12.2.3 Leonardo SpA
- 12.2.3.1. Overview
- 12.2.3.2. Products
- 12.2.3.3. SWOT Analysis
- 12.2.3.4. Recent Developments
- 12.2.3.5. Financials (Based on Availability)
- 12.2.4 Rheinmetall AG
- 12.2.4.1. Overview
- 12.2.4.2. Products
- 12.2.4.3. SWOT Analysis
- 12.2.4.4. Recent Developments
- 12.2.4.5. Financials (Based on Availability)
- 12.2.5 Elbit Systems Ltd
- 12.2.5.1. Overview
- 12.2.5.2. Products
- 12.2.5.3. SWOT Analysis
- 12.2.5.4. Recent Developments
- 12.2.5.5. Financials (Based on Availability)
- 12.2.6 Lockheed Martin Corporation
- 12.2.6.1. Overview
- 12.2.6.2. Products
- 12.2.6.3. SWOT Analysis
- 12.2.6.4. Recent Developments
- 12.2.6.5. Financials (Based on Availability)
- 12.2.7 Airbus SE
- 12.2.7.1. Overview
- 12.2.7.2. Products
- 12.2.7.3. SWOT Analysis
- 12.2.7.4. Recent Developments
- 12.2.7.5. Financials (Based on Availability)
- 12.2.8 ASELSAN AS
- 12.2.8.1. Overview
- 12.2.8.2. Products
- 12.2.8.3. SWOT Analysis
- 12.2.8.4. Recent Developments
- 12.2.8.5. Financials (Based on Availability)
- 12.2.9 IAI
- 12.2.9.1. Overview
- 12.2.9.2. Products
- 12.2.9.3. SWOT Analysis
- 12.2.9.4. Recent Developments
- 12.2.9.5. Financials (Based on Availability)
- 12.2.10 BAE Systems PLC
- 12.2.10.1. Overview
- 12.2.10.2. Products
- 12.2.10.3. SWOT Analysis
- 12.2.10.4. Recent Developments
- 12.2.10.5. Financials (Based on Availability)
- 12.2.11 RTX Corporation
- 12.2.11.1. Overview
- 12.2.11.2. Products
- 12.2.11.3. SWOT Analysis
- 12.2.11.4. Recent Developments
- 12.2.11.5. Financials (Based on Availability)
- 12.2.12 Dahra Engineering & Security Services LLC
- 12.2.12.1. Overview
- 12.2.12.2. Products
- 12.2.12.3. SWOT Analysis
- 12.2.12.4. Recent Developments
- 12.2.12.5. Financials (Based on Availability)
- 12.2.13 EDGE Group PJSC
- 12.2.13.1. Overview
- 12.2.13.2. Products
- 12.2.13.3. SWOT Analysis
- 12.2.13.4. Recent Developments
- 12.2.13.5. Financials (Based on Availability)
- 12.2.14 Saudi Arabian Military Industries (SAMI
- 12.2.14.1. Overview
- 12.2.14.2. Products
- 12.2.14.3. SWOT Analysis
- 12.2.14.4. Recent Developments
- 12.2.14.5. Financials (Based on Availability)
- 12.2.15 Northrop Grumman Corporation
- 12.2.15.1. Overview
- 12.2.15.2. Products
- 12.2.15.3. SWOT Analysis
- 12.2.15.4. Recent Developments
- 12.2.15.5. Financials (Based on Availability)
- 12.2.16 The Boeing Company
- 12.2.16.1. Overview
- 12.2.16.2. Products
- 12.2.16.3. SWOT Analysis
- 12.2.16.4. Recent Developments
- 12.2.16.5. Financials (Based on Availability)
- 12.2.1 L3Harris Technologies Inc
List of Figures
- Figure 1: Global GCC Defense Industry Revenue Breakdown (Million, %) by Region 2025 & 2033
- Figure 2: Saudi Arabia GCC Defense Industry Revenue (Million), by Armed Forces 2025 & 2033
- Figure 3: Saudi Arabia GCC Defense Industry Revenue Share (%), by Armed Forces 2025 & 2033
- Figure 4: Saudi Arabia GCC Defense Industry Revenue (Million), by Type 2025 & 2033
- Figure 5: Saudi Arabia GCC Defense Industry Revenue Share (%), by Type 2025 & 2033
- Figure 6: Saudi Arabia GCC Defense Industry Revenue (Million), by Geography 2025 & 2033
- Figure 7: Saudi Arabia GCC Defense Industry Revenue Share (%), by Geography 2025 & 2033
- Figure 8: Saudi Arabia GCC Defense Industry Revenue (Million), by Country 2025 & 2033
- Figure 9: Saudi Arabia GCC Defense Industry Revenue Share (%), by Country 2025 & 2033
- Figure 10: United Arab Emirates GCC Defense Industry Revenue (Million), by Armed Forces 2025 & 2033
- Figure 11: United Arab Emirates GCC Defense Industry Revenue Share (%), by Armed Forces 2025 & 2033
- Figure 12: United Arab Emirates GCC Defense Industry Revenue (Million), by Type 2025 & 2033
- Figure 13: United Arab Emirates GCC Defense Industry Revenue Share (%), by Type 2025 & 2033
- Figure 14: United Arab Emirates GCC Defense Industry Revenue (Million), by Geography 2025 & 2033
- Figure 15: United Arab Emirates GCC Defense Industry Revenue Share (%), by Geography 2025 & 2033
- Figure 16: United Arab Emirates GCC Defense Industry Revenue (Million), by Country 2025 & 2033
- Figure 17: United Arab Emirates GCC Defense Industry Revenue Share (%), by Country 2025 & 2033
- Figure 18: Qatar GCC Defense Industry Revenue (Million), by Armed Forces 2025 & 2033
- Figure 19: Qatar GCC Defense Industry Revenue Share (%), by Armed Forces 2025 & 2033
- Figure 20: Qatar GCC Defense Industry Revenue (Million), by Type 2025 & 2033
- Figure 21: Qatar GCC Defense Industry Revenue Share (%), by Type 2025 & 2033
- Figure 22: Qatar GCC Defense Industry Revenue (Million), by Geography 2025 & 2033
- Figure 23: Qatar GCC Defense Industry Revenue Share (%), by Geography 2025 & 2033
- Figure 24: Qatar GCC Defense Industry Revenue (Million), by Country 2025 & 2033
- Figure 25: Qatar GCC Defense Industry Revenue Share (%), by Country 2025 & 2033
- Figure 26: Kuwait GCC Defense Industry Revenue (Million), by Armed Forces 2025 & 2033
- Figure 27: Kuwait GCC Defense Industry Revenue Share (%), by Armed Forces 2025 & 2033
- Figure 28: Kuwait GCC Defense Industry Revenue (Million), by Type 2025 & 2033
- Figure 29: Kuwait GCC Defense Industry Revenue Share (%), by Type 2025 & 2033
- Figure 30: Kuwait GCC Defense Industry Revenue (Million), by Geography 2025 & 2033
- Figure 31: Kuwait GCC Defense Industry Revenue Share (%), by Geography 2025 & 2033
- Figure 32: Kuwait GCC Defense Industry Revenue (Million), by Country 2025 & 2033
- Figure 33: Kuwait GCC Defense Industry Revenue Share (%), by Country 2025 & 2033
- Figure 34: Bahrain GCC Defense Industry Revenue (Million), by Armed Forces 2025 & 2033
- Figure 35: Bahrain GCC Defense Industry Revenue Share (%), by Armed Forces 2025 & 2033
- Figure 36: Bahrain GCC Defense Industry Revenue (Million), by Type 2025 & 2033
- Figure 37: Bahrain GCC Defense Industry Revenue Share (%), by Type 2025 & 2033
- Figure 38: Bahrain GCC Defense Industry Revenue (Million), by Geography 2025 & 2033
- Figure 39: Bahrain GCC Defense Industry Revenue Share (%), by Geography 2025 & 2033
- Figure 40: Bahrain GCC Defense Industry Revenue (Million), by Country 2025 & 2033
- Figure 41: Bahrain GCC Defense Industry Revenue Share (%), by Country 2025 & 2033
- Figure 42: Oman GCC Defense Industry Revenue (Million), by Armed Forces 2025 & 2033
- Figure 43: Oman GCC Defense Industry Revenue Share (%), by Armed Forces 2025 & 2033
- Figure 44: Oman GCC Defense Industry Revenue (Million), by Type 2025 & 2033
- Figure 45: Oman GCC Defense Industry Revenue Share (%), by Type 2025 & 2033
- Figure 46: Oman GCC Defense Industry Revenue (Million), by Geography 2025 & 2033
- Figure 47: Oman GCC Defense Industry Revenue Share (%), by Geography 2025 & 2033
- Figure 48: Oman GCC Defense Industry Revenue (Million), by Country 2025 & 2033
- Figure 49: Oman GCC Defense Industry Revenue Share (%), by Country 2025 & 2033
List of Tables
- Table 1: Global GCC Defense Industry Revenue Million Forecast, by Armed Forces 2020 & 2033
- Table 2: Global GCC Defense Industry Revenue Million Forecast, by Type 2020 & 2033
- Table 3: Global GCC Defense Industry Revenue Million Forecast, by Geography 2020 & 2033
- Table 4: Global GCC Defense Industry Revenue Million Forecast, by Region 2020 & 2033
- Table 5: Global GCC Defense Industry Revenue Million Forecast, by Armed Forces 2020 & 2033
- Table 6: Global GCC Defense Industry Revenue Million Forecast, by Type 2020 & 2033
- Table 7: Global GCC Defense Industry Revenue Million Forecast, by Geography 2020 & 2033
- Table 8: Global GCC Defense Industry Revenue Million Forecast, by Country 2020 & 2033
- Table 9: Global GCC Defense Industry Revenue Million Forecast, by Armed Forces 2020 & 2033
- Table 10: Global GCC Defense Industry Revenue Million Forecast, by Type 2020 & 2033
- Table 11: Global GCC Defense Industry Revenue Million Forecast, by Geography 2020 & 2033
- Table 12: Global GCC Defense Industry Revenue Million Forecast, by Country 2020 & 2033
- Table 13: Global GCC Defense Industry Revenue Million Forecast, by Armed Forces 2020 & 2033
- Table 14: Global GCC Defense Industry Revenue Million Forecast, by Type 2020 & 2033
- Table 15: Global GCC Defense Industry Revenue Million Forecast, by Geography 2020 & 2033
- Table 16: Global GCC Defense Industry Revenue Million Forecast, by Country 2020 & 2033
- Table 17: Global GCC Defense Industry Revenue Million Forecast, by Armed Forces 2020 & 2033
- Table 18: Global GCC Defense Industry Revenue Million Forecast, by Type 2020 & 2033
- Table 19: Global GCC Defense Industry Revenue Million Forecast, by Geography 2020 & 2033
- Table 20: Global GCC Defense Industry Revenue Million Forecast, by Country 2020 & 2033
- Table 21: Global GCC Defense Industry Revenue Million Forecast, by Armed Forces 2020 & 2033
- Table 22: Global GCC Defense Industry Revenue Million Forecast, by Type 2020 & 2033
- Table 23: Global GCC Defense Industry Revenue Million Forecast, by Geography 2020 & 2033
- Table 24: Global GCC Defense Industry Revenue Million Forecast, by Country 2020 & 2033
- Table 25: Global GCC Defense Industry Revenue Million Forecast, by Armed Forces 2020 & 2033
- Table 26: Global GCC Defense Industry Revenue Million Forecast, by Type 2020 & 2033
- Table 27: Global GCC Defense Industry Revenue Million Forecast, by Geography 2020 & 2033
- Table 28: Global GCC Defense Industry Revenue Million Forecast, by Country 2020 & 2033
Frequently Asked Questions
1. What is the projected Compound Annual Growth Rate (CAGR) of the GCC Defense Industry?
The projected CAGR is approximately 11.04%.
2. Which companies are prominent players in the GCC Defense Industry?
Key companies in the market include L3Harris Technologies Inc, THALES, Leonardo SpA, Rheinmetall AG, Elbit Systems Ltd, Lockheed Martin Corporation, Airbus SE, ASELSAN AS, IAI, BAE Systems PLC, RTX Corporation, Dahra Engineering & Security Services LLC, EDGE Group PJSC, Saudi Arabian Military Industries (SAMI, Northrop Grumman Corporation, The Boeing Company.
3. What are the main segments of the GCC Defense Industry?
The market segments include Armed Forces, Type, Geography.
4. Can you provide details about the market size?
The market size is estimated to be USD 29.73 Million as of 2022.
5. What are some drivers contributing to market growth?
N/A
6. What are the notable trends driving market growth?
Airforce Segment to Dominate Market Share During the Forecast Period.
7. Are there any restraints impacting market growth?
N/A
8. Can you provide examples of recent developments in the market?
February 2024: Lockheed Martin Corporation signed an agreement with Saudi Arabian companies to manufacture components of its Terminal High Altitude Area Defense (THAAD) missile defense system. This move comes as the United States continues to conduct military operations in the Middle East.
9. What pricing options are available for accessing the report?
Pricing options include single-user, multi-user, and enterprise licenses priced at USD 4750, USD 5250, and USD 8750 respectively.
10. Is the market size provided in terms of value or volume?
The market size is provided in terms of value, measured in Million.
11. Are there any specific market keywords associated with the report?
Yes, the market keyword associated with the report is "GCC Defense Industry," which aids in identifying and referencing the specific market segment covered.
12. How do I determine which pricing option suits my needs best?
The pricing options vary based on user requirements and access needs. Individual users may opt for single-user licenses, while businesses requiring broader access may choose multi-user or enterprise licenses for cost-effective access to the report.
13. Are there any additional resources or data provided in the GCC Defense Industry report?
While the report offers comprehensive insights, it's advisable to review the specific contents or supplementary materials provided to ascertain if additional resources or data are available.
14. How can I stay updated on further developments or reports in the GCC Defense Industry?
To stay informed about further developments, trends, and reports in the GCC Defense Industry, consider subscribing to industry newsletters, following relevant companies and organizations, or regularly checking reputable industry news sources and publications.
Methodology
Step 1 - Identification of Relevant Samples Size from Population Database


Step 2 - Approaches for Defining Global Market Size (Value, Volume* & Price*)

Note*: In applicable scenarios
Step 3 - Data Sources
Primary Research
- Web Analytics
- Survey Reports
- Research Institute
- Latest Research Reports
- Opinion Leaders
Secondary Research
- Annual Reports
- White Paper
- Latest Press Release
- Industry Association
- Paid Database
- Investor Presentations

Step 4 - Data Triangulation
Involves using different sources of information in order to increase the validity of a study
These sources are likely to be stakeholders in a program - participants, other researchers, program staff, other community members, and so on.
Then we put all data in single framework & apply various statistical tools to find out the dynamic on the market.
During the analysis stage, feedback from the stakeholder groups would be compared to determine areas of agreement as well as areas of divergence