

Key Insights
The global Ophthalmology Picture Archiving and Communication Systems (PACS) market is poised for significant expansion, fueled by the increasing incidence of ocular diseases, advancements in imaging technology, and the widespread adoption of digital healthcare. The market, valued at $184.4 million in the base year 2025, is projected to grow at a Compound Annual Growth Rate (CAGR) of 8.4% through 2033. Key growth drivers include the escalating demand for efficient image management and storage within ophthalmology practices, enhanced diagnostic capabilities facilitated by PACS, and the growing need for streamlined workflows in healthcare facilities. A notable trend is the shift towards cloud-based PACS solutions, offering superior scalability, accessibility, and cost-effectiveness over traditional on-premise systems. However, substantial initial investment costs for PACS implementation, data security concerns, and the requirement for robust IT infrastructure in certain regions present challenges to market growth. The market is segmented by type (integrated vs. standalone PACS), delivery model (cloud-based vs. on-premise), and end-user (hospitals & clinics, ambulatory surgical centers). North America currently leads the market due to its advanced healthcare infrastructure and high adoption of digital technologies. Conversely, the Asia-Pacific region is expected to demonstrate substantial growth potential, driven by increasing healthcare expenditure and rising awareness of eye care in developing economies. The competitive landscape features established players such as IBM, Agfa-Gevaert, and Carl Zeiss Meditec, alongside innovative emerging companies. The market is anticipated to experience further consolidation and innovation, propelled by the sustained demand for advanced and cost-effective ophthalmology PACS solutions.
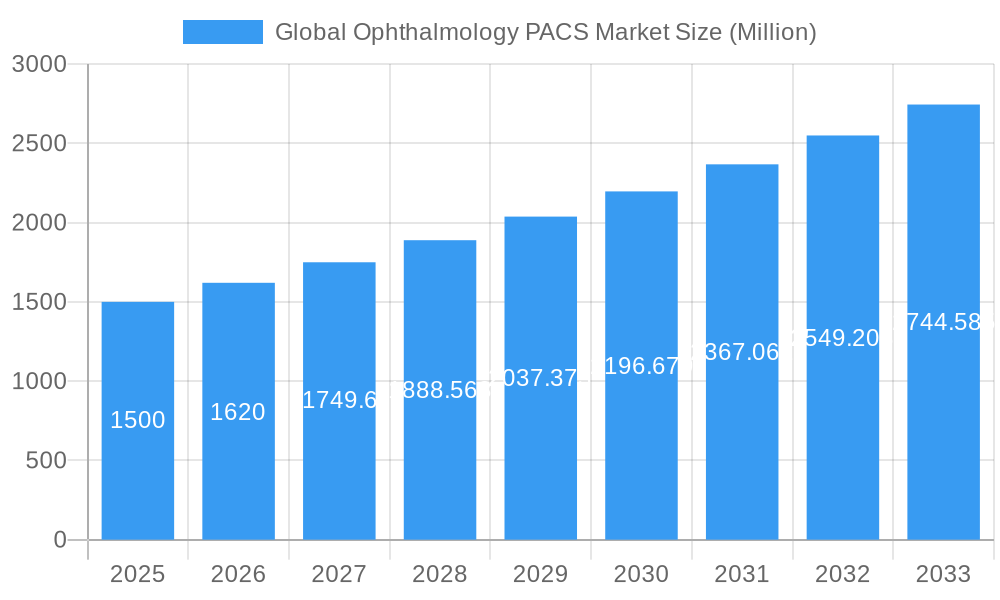
Global Ophthalmology PACS Market Market Size (In Million)
The market's future trajectory will be significantly influenced by the integration of Artificial Intelligence (AI) and machine learning in image analysis, leading to accelerated and more precise diagnoses. Furthermore, the growing emphasis on telehealth and remote patient monitoring will boost demand for cloud-based PACS, enabling seamless remote access to patient data. Regulatory mandates promoting interoperability and data standardization within healthcare systems will also be instrumental in shaping the market's evolution. The increasing number of ophthalmologists and the rising prevalence of age-related eye conditions, including macular degeneration and glaucoma, will contribute significantly to market expansion, particularly within aging demographics. Advancements in retinal imaging technologies and the subsequent need for efficient PACS to manage the growing volume of high-resolution images will also drive market growth.
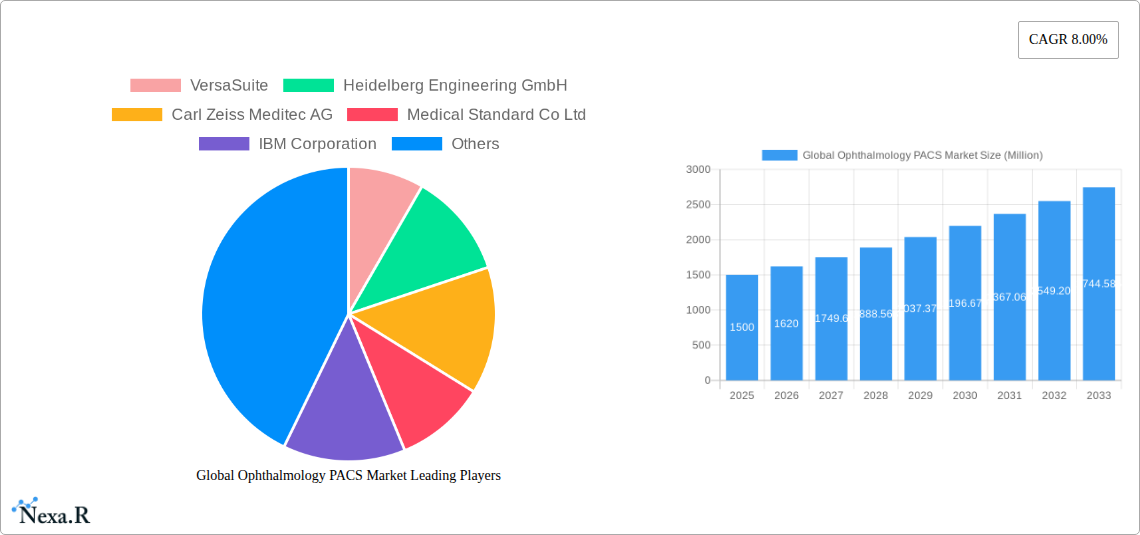
Global Ophthalmology PACS Market Company Market Share
Global Ophthalmology PACS Market: A Comprehensive Report (2019-2033)
This comprehensive report provides an in-depth analysis of the global ophthalmology PACS (Picture Archiving and Communication Systems) market, encompassing market dynamics, growth trends, regional dominance, product landscape, key players, and future outlook. The report covers the period from 2019 to 2033, with a base year of 2025 and a forecast period of 2025-2033. The market is segmented by type (Integrated PACS, Standalone PACS), delivery model (Cloud-Based, On-Premise), and end-user (Hospitals & Clinics, Ambulatory Surgical Centers). This report is essential for ophthalmology professionals, investors, and technology providers seeking to understand and capitalize on the opportunities within this rapidly evolving market. The total market size in 2025 is estimated at XX Million.
Global Ophthalmology PACS Market Dynamics & Structure
The global ophthalmology PACS market is characterized by a moderately concentrated structure, with several key players vying for market share. Technological innovation, particularly in areas like AI-powered image analysis and cloud-based solutions, is a significant driver of market growth. Stringent regulatory frameworks concerning data privacy and security influence market dynamics. Competitive substitutes, such as traditional film-based archiving, are declining in relevance. The end-user demographic is expanding, with increasing adoption by ambulatory surgical centers and smaller clinics. M&A activity remains moderate, with an estimated XX deals in the historical period (2019-2024), reflecting consolidation and strategic expansion.
- Market Concentration: Moderately concentrated, with top 5 players holding approximately xx% market share in 2024.
- Technological Innovation: AI-driven image analysis, cloud-based PACS solutions, and improved image quality are key drivers.
- Regulatory Landscape: HIPAA, GDPR, and other data privacy regulations are shaping market practices.
- Competitive Substitutes: Traditional film-based archiving is being rapidly replaced by digital solutions.
- End-User Demographics: Growth in ambulatory surgical centers and smaller clinics is driving demand.
- M&A Trends: XX M&A deals in 2019-2024, primarily focused on consolidation and expansion into new markets.
Global Ophthalmology PACS Market Growth Trends & Insights
The global ophthalmology PACS market exhibits robust growth, fueled by increasing prevalence of ophthalmic diseases, rising adoption of digital imaging technologies in ophthalmology practices, and the advantages of efficient image management. The market witnessed a CAGR of xx% during the historical period (2019-2024) and is projected to maintain a CAGR of xx% during the forecast period (2025-2033), reaching an estimated value of XX Million by 2033. This growth is driven by the increasing demand for improved diagnostic accuracy, efficient workflow management, and enhanced collaboration among healthcare professionals. Technological advancements, such as AI-powered image analysis and cloud-based solutions, are accelerating market adoption. Shifts in consumer behavior toward digital healthcare solutions further bolster market expansion.
Dominant Regions, Countries, or Segments in Global Ophthalmology PACS Market
North America currently dominates the global ophthalmology PACS market, holding the largest market share in 2025, owing to advanced healthcare infrastructure, high adoption rates of advanced technologies, and substantial investments in healthcare IT. Europe follows as the second-largest market, driven by increasing government initiatives promoting digital healthcare. Within the segments, the Integrated PACS type holds a significant market share due to its comprehensive functionalities, while the cloud-based delivery model witnesses rapid growth due to its scalability and cost-effectiveness. Hospitals & Clinics segment dominates the end-user landscape due to their greater need for efficient image management.
- North America: High adoption rates of advanced technologies and strong healthcare infrastructure.
- Europe: Government initiatives supporting digital healthcare and a robust healthcare system.
- Asia-Pacific: Rapidly growing market due to rising prevalence of ophthalmic diseases and increasing healthcare spending.
- Integrated PACS: Comprehensive functionalities leading to higher adoption.
- Cloud-Based Model: Scalability and cost-effectiveness drive rapid growth.
- Hospitals & Clinics: Significant market share due to greater need for efficient image management.
Global Ophthalmology PACS Market Product Landscape
The ophthalmology PACS market offers a range of solutions, from standalone systems for smaller clinics to integrated PACS solutions for larger hospitals and integrated networks. These systems offer advanced features such as image enhancement, AI-driven analysis, and secure remote access. Key selling propositions include improved diagnostic accuracy, efficient workflow management, enhanced collaboration, and reduced storage costs. Recent advancements include integration with other medical imaging modalities and the incorporation of telehealth capabilities.
Key Drivers, Barriers & Challenges in Global Ophthalmology PACS Market
Key Drivers: The increasing prevalence of age-related eye diseases, advancements in ophthalmic imaging technologies, and rising demand for improved diagnostic accuracy and efficient workflow management are key drivers. Government initiatives promoting digital healthcare and increasing investments in healthcare IT further accelerate market growth.
Challenges & Restraints: High initial investment costs, complex integration with existing systems, concerns about data security and privacy, and the need for skilled personnel to operate and maintain the systems pose significant challenges. The fragmented nature of the healthcare industry can also hinder widespread adoption. Furthermore, stringent regulatory requirements and potential supply chain disruptions could impact market growth.
Emerging Opportunities in Global Ophthalmology PACS Market
Emerging opportunities lie in the integration of AI and machine learning for automated image analysis and diagnostic support, expansion into untapped markets in developing economies, and the development of cloud-based solutions that offer greater scalability and cost-effectiveness. Furthermore, the integration of telehealth capabilities and the development of mobile-friendly applications can create new avenues for market expansion.
Growth Accelerators in the Global Ophthalmology PACS Market Industry
Strategic partnerships between PACS vendors and ophthalmology practices, coupled with technological advancements such as AI-driven image analysis and the expansion of cloud-based solutions are key growth accelerators. Increased investments in research and development, along with the growing adoption of telehealth and remote monitoring solutions, are further propelling market expansion.
Key Players Shaping the Global Ophthalmology PACS Market Market
- VersaSuite
- Heidelberg Engineering GmbH
- Carl Zeiss Meditec AG
- Medical Standard Co Ltd
- IBM Corporation
- Agfa-Gevaert N V
- Visbion Limited
- Sonomed Escalon
Notable Milestones in Global Ophthalmology PACS Market Sector
- May 2022: OMNY Health partnered with community-based ophthalmology practices to launch a real-world data ecosystem, focusing on collaborative research and improved patient outcomes.
- April 2022: ZEISS Medical Technology's QUATERA 700 received FDA approval, increasing surgical workflow efficiency.
In-Depth Global Ophthalmology PACS Market Market Outlook
The global ophthalmology PACS market is poised for sustained growth driven by technological advancements, increasing adoption rates, and expanding applications. The market’s future potential is substantial, particularly in emerging economies with rising healthcare spending. Strategic partnerships, investments in R&D, and the development of innovative solutions will shape the market's future trajectory, creating lucrative opportunities for players in the years to come.
Global Ophthalmology PACS Market Segmentation
-
1. Type
- 1.1. Integrated PACS
- 1.2. Standalone PACS
-
2. Delivery Model
- 2.1. Cloud-Based Model
- 2.2. On-Premise Model
-
3. End User
- 3.1. Hospitals & Clinics
- 3.2. Ambulatory Surgical Centers
Global Ophthalmology PACS Market Segmentation By Geography
-
1. North America
- 1.1. United States
- 1.2. Canada
- 1.3. Mexico
-
2. Europe
- 2.1. Germany
- 2.2. United Kingdom
- 2.3. France
- 2.4. Italy
- 2.5. Spain
- 2.6. Rest of Europe
-
3. Asia Pacific
- 3.1. China
- 3.2. Japan
- 3.3. India
- 3.4. Australia
- 3.5. South Korea
- 3.6. Rest of Asia Pacific
-
4. Middle East and Africa
- 4.1. GCC
- 4.2. South Africa
- 4.3. Rest of Middle East and Africa
-
5. South America
- 5.1. Brazil
- 5.2. Argentina
- 5.3. Rest of South America
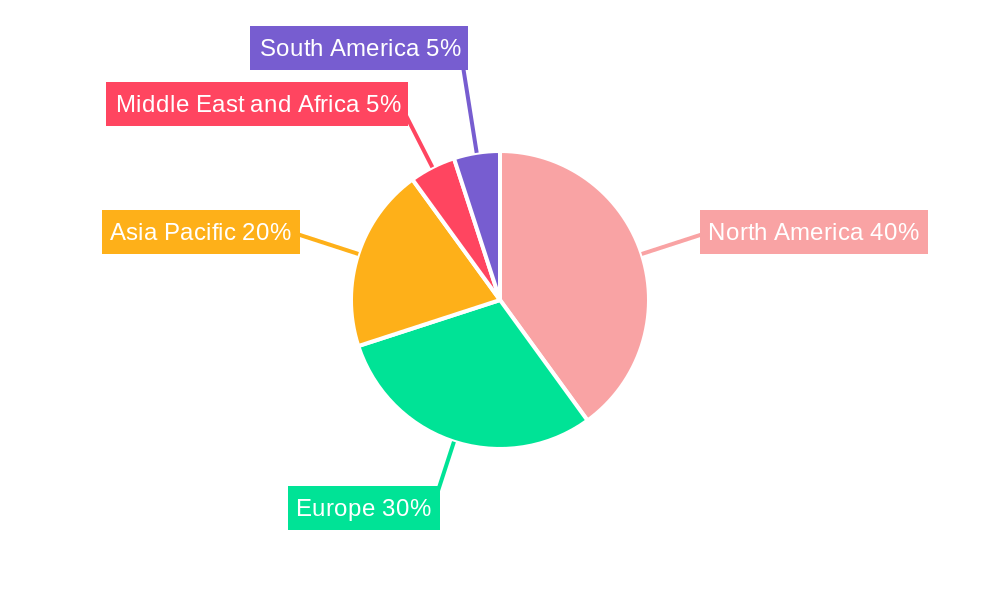
Global Ophthalmology PACS Market Regional Market Share
Geographic Coverage of Global Ophthalmology PACS Market
Global Ophthalmology PACS Market REPORT HIGHLIGHTS
| Aspects | Details |
|---|---|
| Study Period | 2020-2034 |
| Base Year | 2025 |
| Estimated Year | 2026 |
| Forecast Period | 2026-2034 |
| Historical Period | 2020-2025 |
| Growth Rate | CAGR of 8.4% from 2020-2034 |
| Segmentation |
|
Table of Contents
- 1. Introduction
- 1.1. Research Scope
- 1.2. Market Segmentation
- 1.3. Research Methodology
- 1.4. Definitions and Assumptions
- 2. Executive Summary
- 2.1. Introduction
- 3. Market Dynamics
- 3.1. Introduction
- 3.2. Market Drivers
- 3.2.1. High Prevalence of Eye Diseases; Increasing Geriatric Population; Expansion of Teleophthalmology
- 3.3. Market Restrains
- 3.3.1. High Implementation and Maintenance Costs
- 3.4. Market Trends
- 3.4.1. Integrated PACS Segment is Expected to Show Better Growth Over the Forecast Years
- 4. Market Factor Analysis
- 4.1. Porters Five Forces
- 4.2. Supply/Value Chain
- 4.3. PESTEL analysis
- 4.4. Market Entropy
- 4.5. Patent/Trademark Analysis
- 5. Global Ophthalmology PACS Market Analysis, Insights and Forecast, 2020-2032
- 5.1. Market Analysis, Insights and Forecast - by Type
- 5.1.1. Integrated PACS
- 5.1.2. Standalone PACS
- 5.2. Market Analysis, Insights and Forecast - by Delivery Model
- 5.2.1. Cloud-Based Model
- 5.2.2. On-Premise Model
- 5.3. Market Analysis, Insights and Forecast - by End User
- 5.3.1. Hospitals & Clinics
- 5.3.2. Ambulatory Surgical Centers
- 5.4. Market Analysis, Insights and Forecast - by Region
- 5.4.1. North America
- 5.4.2. Europe
- 5.4.3. Asia Pacific
- 5.4.4. Middle East and Africa
- 5.4.5. South America
- 5.1. Market Analysis, Insights and Forecast - by Type
- 6. North America Global Ophthalmology PACS Market Analysis, Insights and Forecast, 2020-2032
- 6.1. Market Analysis, Insights and Forecast - by Type
- 6.1.1. Integrated PACS
- 6.1.2. Standalone PACS
- 6.2. Market Analysis, Insights and Forecast - by Delivery Model
- 6.2.1. Cloud-Based Model
- 6.2.2. On-Premise Model
- 6.3. Market Analysis, Insights and Forecast - by End User
- 6.3.1. Hospitals & Clinics
- 6.3.2. Ambulatory Surgical Centers
- 6.1. Market Analysis, Insights and Forecast - by Type
- 7. Europe Global Ophthalmology PACS Market Analysis, Insights and Forecast, 2020-2032
- 7.1. Market Analysis, Insights and Forecast - by Type
- 7.1.1. Integrated PACS
- 7.1.2. Standalone PACS
- 7.2. Market Analysis, Insights and Forecast - by Delivery Model
- 7.2.1. Cloud-Based Model
- 7.2.2. On-Premise Model
- 7.3. Market Analysis, Insights and Forecast - by End User
- 7.3.1. Hospitals & Clinics
- 7.3.2. Ambulatory Surgical Centers
- 7.1. Market Analysis, Insights and Forecast - by Type
- 8. Asia Pacific Global Ophthalmology PACS Market Analysis, Insights and Forecast, 2020-2032
- 8.1. Market Analysis, Insights and Forecast - by Type
- 8.1.1. Integrated PACS
- 8.1.2. Standalone PACS
- 8.2. Market Analysis, Insights and Forecast - by Delivery Model
- 8.2.1. Cloud-Based Model
- 8.2.2. On-Premise Model
- 8.3. Market Analysis, Insights and Forecast - by End User
- 8.3.1. Hospitals & Clinics
- 8.3.2. Ambulatory Surgical Centers
- 8.1. Market Analysis, Insights and Forecast - by Type
- 9. Middle East and Africa Global Ophthalmology PACS Market Analysis, Insights and Forecast, 2020-2032
- 9.1. Market Analysis, Insights and Forecast - by Type
- 9.1.1. Integrated PACS
- 9.1.2. Standalone PACS
- 9.2. Market Analysis, Insights and Forecast - by Delivery Model
- 9.2.1. Cloud-Based Model
- 9.2.2. On-Premise Model
- 9.3. Market Analysis, Insights and Forecast - by End User
- 9.3.1. Hospitals & Clinics
- 9.3.2. Ambulatory Surgical Centers
- 9.1. Market Analysis, Insights and Forecast - by Type
- 10. South America Global Ophthalmology PACS Market Analysis, Insights and Forecast, 2020-2032
- 10.1. Market Analysis, Insights and Forecast - by Type
- 10.1.1. Integrated PACS
- 10.1.2. Standalone PACS
- 10.2. Market Analysis, Insights and Forecast - by Delivery Model
- 10.2.1. Cloud-Based Model
- 10.2.2. On-Premise Model
- 10.3. Market Analysis, Insights and Forecast - by End User
- 10.3.1. Hospitals & Clinics
- 10.3.2. Ambulatory Surgical Centers
- 10.1. Market Analysis, Insights and Forecast - by Type
- 11. Competitive Analysis
- 11.1. Market Share Analysis 2025
- 11.2. Company Profiles
- 11.2.1 VersaSuite
- 11.2.1.1. Overview
- 11.2.1.2. Products
- 11.2.1.3. SWOT Analysis
- 11.2.1.4. Recent Developments
- 11.2.1.5. Financials (Based on Availability)
- 11.2.2 Heidelberg Engineering GmbH
- 11.2.2.1. Overview
- 11.2.2.2. Products
- 11.2.2.3. SWOT Analysis
- 11.2.2.4. Recent Developments
- 11.2.2.5. Financials (Based on Availability)
- 11.2.3 Carl Zeiss Meditec AG
- 11.2.3.1. Overview
- 11.2.3.2. Products
- 11.2.3.3. SWOT Analysis
- 11.2.3.4. Recent Developments
- 11.2.3.5. Financials (Based on Availability)
- 11.2.4 Medical Standard Co Ltd
- 11.2.4.1. Overview
- 11.2.4.2. Products
- 11.2.4.3. SWOT Analysis
- 11.2.4.4. Recent Developments
- 11.2.4.5. Financials (Based on Availability)
- 11.2.5 IBM Corporation
- 11.2.5.1. Overview
- 11.2.5.2. Products
- 11.2.5.3. SWOT Analysis
- 11.2.5.4. Recent Developments
- 11.2.5.5. Financials (Based on Availability)
- 11.2.6 Agfa-Gevaert N V
- 11.2.6.1. Overview
- 11.2.6.2. Products
- 11.2.6.3. SWOT Analysis
- 11.2.6.4. Recent Developments
- 11.2.6.5. Financials (Based on Availability)
- 11.2.7 Visbion Limited
- 11.2.7.1. Overview
- 11.2.7.2. Products
- 11.2.7.3. SWOT Analysis
- 11.2.7.4. Recent Developments
- 11.2.7.5. Financials (Based on Availability)
- 11.2.8 Sonomed Escalon
- 11.2.8.1. Overview
- 11.2.8.2. Products
- 11.2.8.3. SWOT Analysis
- 11.2.8.4. Recent Developments
- 11.2.8.5. Financials (Based on Availability)
- 11.2.1 VersaSuite
List of Figures
- Figure 1: Global Global Ophthalmology PACS Market Revenue Breakdown (million, %) by Region 2025 & 2033
- Figure 2: Global Global Ophthalmology PACS Market Volume Breakdown (K Unit, %) by Region 2025 & 2033
- Figure 3: North America Global Ophthalmology PACS Market Revenue (million), by Type 2025 & 2033
- Figure 4: North America Global Ophthalmology PACS Market Volume (K Unit), by Type 2025 & 2033
- Figure 5: North America Global Ophthalmology PACS Market Revenue Share (%), by Type 2025 & 2033
- Figure 6: North America Global Ophthalmology PACS Market Volume Share (%), by Type 2025 & 2033
- Figure 7: North America Global Ophthalmology PACS Market Revenue (million), by Delivery Model 2025 & 2033
- Figure 8: North America Global Ophthalmology PACS Market Volume (K Unit), by Delivery Model 2025 & 2033
- Figure 9: North America Global Ophthalmology PACS Market Revenue Share (%), by Delivery Model 2025 & 2033
- Figure 10: North America Global Ophthalmology PACS Market Volume Share (%), by Delivery Model 2025 & 2033
- Figure 11: North America Global Ophthalmology PACS Market Revenue (million), by End User 2025 & 2033
- Figure 12: North America Global Ophthalmology PACS Market Volume (K Unit), by End User 2025 & 2033
- Figure 13: North America Global Ophthalmology PACS Market Revenue Share (%), by End User 2025 & 2033
- Figure 14: North America Global Ophthalmology PACS Market Volume Share (%), by End User 2025 & 2033
- Figure 15: North America Global Ophthalmology PACS Market Revenue (million), by Country 2025 & 2033
- Figure 16: North America Global Ophthalmology PACS Market Volume (K Unit), by Country 2025 & 2033
- Figure 17: North America Global Ophthalmology PACS Market Revenue Share (%), by Country 2025 & 2033
- Figure 18: North America Global Ophthalmology PACS Market Volume Share (%), by Country 2025 & 2033
- Figure 19: Europe Global Ophthalmology PACS Market Revenue (million), by Type 2025 & 2033
- Figure 20: Europe Global Ophthalmology PACS Market Volume (K Unit), by Type 2025 & 2033
- Figure 21: Europe Global Ophthalmology PACS Market Revenue Share (%), by Type 2025 & 2033
- Figure 22: Europe Global Ophthalmology PACS Market Volume Share (%), by Type 2025 & 2033
- Figure 23: Europe Global Ophthalmology PACS Market Revenue (million), by Delivery Model 2025 & 2033
- Figure 24: Europe Global Ophthalmology PACS Market Volume (K Unit), by Delivery Model 2025 & 2033
- Figure 25: Europe Global Ophthalmology PACS Market Revenue Share (%), by Delivery Model 2025 & 2033
- Figure 26: Europe Global Ophthalmology PACS Market Volume Share (%), by Delivery Model 2025 & 2033
- Figure 27: Europe Global Ophthalmology PACS Market Revenue (million), by End User 2025 & 2033
- Figure 28: Europe Global Ophthalmology PACS Market Volume (K Unit), by End User 2025 & 2033
- Figure 29: Europe Global Ophthalmology PACS Market Revenue Share (%), by End User 2025 & 2033
- Figure 30: Europe Global Ophthalmology PACS Market Volume Share (%), by End User 2025 & 2033
- Figure 31: Europe Global Ophthalmology PACS Market Revenue (million), by Country 2025 & 2033
- Figure 32: Europe Global Ophthalmology PACS Market Volume (K Unit), by Country 2025 & 2033
- Figure 33: Europe Global Ophthalmology PACS Market Revenue Share (%), by Country 2025 & 2033
- Figure 34: Europe Global Ophthalmology PACS Market Volume Share (%), by Country 2025 & 2033
- Figure 35: Asia Pacific Global Ophthalmology PACS Market Revenue (million), by Type 2025 & 2033
- Figure 36: Asia Pacific Global Ophthalmology PACS Market Volume (K Unit), by Type 2025 & 2033
- Figure 37: Asia Pacific Global Ophthalmology PACS Market Revenue Share (%), by Type 2025 & 2033
- Figure 38: Asia Pacific Global Ophthalmology PACS Market Volume Share (%), by Type 2025 & 2033
- Figure 39: Asia Pacific Global Ophthalmology PACS Market Revenue (million), by Delivery Model 2025 & 2033
- Figure 40: Asia Pacific Global Ophthalmology PACS Market Volume (K Unit), by Delivery Model 2025 & 2033
- Figure 41: Asia Pacific Global Ophthalmology PACS Market Revenue Share (%), by Delivery Model 2025 & 2033
- Figure 42: Asia Pacific Global Ophthalmology PACS Market Volume Share (%), by Delivery Model 2025 & 2033
- Figure 43: Asia Pacific Global Ophthalmology PACS Market Revenue (million), by End User 2025 & 2033
- Figure 44: Asia Pacific Global Ophthalmology PACS Market Volume (K Unit), by End User 2025 & 2033
- Figure 45: Asia Pacific Global Ophthalmology PACS Market Revenue Share (%), by End User 2025 & 2033
- Figure 46: Asia Pacific Global Ophthalmology PACS Market Volume Share (%), by End User 2025 & 2033
- Figure 47: Asia Pacific Global Ophthalmology PACS Market Revenue (million), by Country 2025 & 2033
- Figure 48: Asia Pacific Global Ophthalmology PACS Market Volume (K Unit), by Country 2025 & 2033
- Figure 49: Asia Pacific Global Ophthalmology PACS Market Revenue Share (%), by Country 2025 & 2033
- Figure 50: Asia Pacific Global Ophthalmology PACS Market Volume Share (%), by Country 2025 & 2033
- Figure 51: Middle East and Africa Global Ophthalmology PACS Market Revenue (million), by Type 2025 & 2033
- Figure 52: Middle East and Africa Global Ophthalmology PACS Market Volume (K Unit), by Type 2025 & 2033
- Figure 53: Middle East and Africa Global Ophthalmology PACS Market Revenue Share (%), by Type 2025 & 2033
- Figure 54: Middle East and Africa Global Ophthalmology PACS Market Volume Share (%), by Type 2025 & 2033
- Figure 55: Middle East and Africa Global Ophthalmology PACS Market Revenue (million), by Delivery Model 2025 & 2033
- Figure 56: Middle East and Africa Global Ophthalmology PACS Market Volume (K Unit), by Delivery Model 2025 & 2033
- Figure 57: Middle East and Africa Global Ophthalmology PACS Market Revenue Share (%), by Delivery Model 2025 & 2033
- Figure 58: Middle East and Africa Global Ophthalmology PACS Market Volume Share (%), by Delivery Model 2025 & 2033
- Figure 59: Middle East and Africa Global Ophthalmology PACS Market Revenue (million), by End User 2025 & 2033
- Figure 60: Middle East and Africa Global Ophthalmology PACS Market Volume (K Unit), by End User 2025 & 2033
- Figure 61: Middle East and Africa Global Ophthalmology PACS Market Revenue Share (%), by End User 2025 & 2033
- Figure 62: Middle East and Africa Global Ophthalmology PACS Market Volume Share (%), by End User 2025 & 2033
- Figure 63: Middle East and Africa Global Ophthalmology PACS Market Revenue (million), by Country 2025 & 2033
- Figure 64: Middle East and Africa Global Ophthalmology PACS Market Volume (K Unit), by Country 2025 & 2033
- Figure 65: Middle East and Africa Global Ophthalmology PACS Market Revenue Share (%), by Country 2025 & 2033
- Figure 66: Middle East and Africa Global Ophthalmology PACS Market Volume Share (%), by Country 2025 & 2033
- Figure 67: South America Global Ophthalmology PACS Market Revenue (million), by Type 2025 & 2033
- Figure 68: South America Global Ophthalmology PACS Market Volume (K Unit), by Type 2025 & 2033
- Figure 69: South America Global Ophthalmology PACS Market Revenue Share (%), by Type 2025 & 2033
- Figure 70: South America Global Ophthalmology PACS Market Volume Share (%), by Type 2025 & 2033
- Figure 71: South America Global Ophthalmology PACS Market Revenue (million), by Delivery Model 2025 & 2033
- Figure 72: South America Global Ophthalmology PACS Market Volume (K Unit), by Delivery Model 2025 & 2033
- Figure 73: South America Global Ophthalmology PACS Market Revenue Share (%), by Delivery Model 2025 & 2033
- Figure 74: South America Global Ophthalmology PACS Market Volume Share (%), by Delivery Model 2025 & 2033
- Figure 75: South America Global Ophthalmology PACS Market Revenue (million), by End User 2025 & 2033
- Figure 76: South America Global Ophthalmology PACS Market Volume (K Unit), by End User 2025 & 2033
- Figure 77: South America Global Ophthalmology PACS Market Revenue Share (%), by End User 2025 & 2033
- Figure 78: South America Global Ophthalmology PACS Market Volume Share (%), by End User 2025 & 2033
- Figure 79: South America Global Ophthalmology PACS Market Revenue (million), by Country 2025 & 2033
- Figure 80: South America Global Ophthalmology PACS Market Volume (K Unit), by Country 2025 & 2033
- Figure 81: South America Global Ophthalmology PACS Market Revenue Share (%), by Country 2025 & 2033
- Figure 82: South America Global Ophthalmology PACS Market Volume Share (%), by Country 2025 & 2033
List of Tables
- Table 1: Global Ophthalmology PACS Market Revenue million Forecast, by Type 2020 & 2033
- Table 2: Global Ophthalmology PACS Market Volume K Unit Forecast, by Type 2020 & 2033
- Table 3: Global Ophthalmology PACS Market Revenue million Forecast, by Delivery Model 2020 & 2033
- Table 4: Global Ophthalmology PACS Market Volume K Unit Forecast, by Delivery Model 2020 & 2033
- Table 5: Global Ophthalmology PACS Market Revenue million Forecast, by End User 2020 & 2033
- Table 6: Global Ophthalmology PACS Market Volume K Unit Forecast, by End User 2020 & 2033
- Table 7: Global Ophthalmology PACS Market Revenue million Forecast, by Region 2020 & 2033
- Table 8: Global Ophthalmology PACS Market Volume K Unit Forecast, by Region 2020 & 2033
- Table 9: Global Ophthalmology PACS Market Revenue million Forecast, by Type 2020 & 2033
- Table 10: Global Ophthalmology PACS Market Volume K Unit Forecast, by Type 2020 & 2033
- Table 11: Global Ophthalmology PACS Market Revenue million Forecast, by Delivery Model 2020 & 2033
- Table 12: Global Ophthalmology PACS Market Volume K Unit Forecast, by Delivery Model 2020 & 2033
- Table 13: Global Ophthalmology PACS Market Revenue million Forecast, by End User 2020 & 2033
- Table 14: Global Ophthalmology PACS Market Volume K Unit Forecast, by End User 2020 & 2033
- Table 15: Global Ophthalmology PACS Market Revenue million Forecast, by Country 2020 & 2033
- Table 16: Global Ophthalmology PACS Market Volume K Unit Forecast, by Country 2020 & 2033
- Table 17: United States Global Ophthalmology PACS Market Revenue (million) Forecast, by Application 2020 & 2033
- Table 18: United States Global Ophthalmology PACS Market Volume (K Unit) Forecast, by Application 2020 & 2033
- Table 19: Canada Global Ophthalmology PACS Market Revenue (million) Forecast, by Application 2020 & 2033
- Table 20: Canada Global Ophthalmology PACS Market Volume (K Unit) Forecast, by Application 2020 & 2033
- Table 21: Mexico Global Ophthalmology PACS Market Revenue (million) Forecast, by Application 2020 & 2033
- Table 22: Mexico Global Ophthalmology PACS Market Volume (K Unit) Forecast, by Application 2020 & 2033
- Table 23: Global Ophthalmology PACS Market Revenue million Forecast, by Type 2020 & 2033
- Table 24: Global Ophthalmology PACS Market Volume K Unit Forecast, by Type 2020 & 2033
- Table 25: Global Ophthalmology PACS Market Revenue million Forecast, by Delivery Model 2020 & 2033
- Table 26: Global Ophthalmology PACS Market Volume K Unit Forecast, by Delivery Model 2020 & 2033
- Table 27: Global Ophthalmology PACS Market Revenue million Forecast, by End User 2020 & 2033
- Table 28: Global Ophthalmology PACS Market Volume K Unit Forecast, by End User 2020 & 2033
- Table 29: Global Ophthalmology PACS Market Revenue million Forecast, by Country 2020 & 2033
- Table 30: Global Ophthalmology PACS Market Volume K Unit Forecast, by Country 2020 & 2033
- Table 31: Germany Global Ophthalmology PACS Market Revenue (million) Forecast, by Application 2020 & 2033
- Table 32: Germany Global Ophthalmology PACS Market Volume (K Unit) Forecast, by Application 2020 & 2033
- Table 33: United Kingdom Global Ophthalmology PACS Market Revenue (million) Forecast, by Application 2020 & 2033
- Table 34: United Kingdom Global Ophthalmology PACS Market Volume (K Unit) Forecast, by Application 2020 & 2033
- Table 35: France Global Ophthalmology PACS Market Revenue (million) Forecast, by Application 2020 & 2033
- Table 36: France Global Ophthalmology PACS Market Volume (K Unit) Forecast, by Application 2020 & 2033
- Table 37: Italy Global Ophthalmology PACS Market Revenue (million) Forecast, by Application 2020 & 2033
- Table 38: Italy Global Ophthalmology PACS Market Volume (K Unit) Forecast, by Application 2020 & 2033
- Table 39: Spain Global Ophthalmology PACS Market Revenue (million) Forecast, by Application 2020 & 2033
- Table 40: Spain Global Ophthalmology PACS Market Volume (K Unit) Forecast, by Application 2020 & 2033
- Table 41: Rest of Europe Global Ophthalmology PACS Market Revenue (million) Forecast, by Application 2020 & 2033
- Table 42: Rest of Europe Global Ophthalmology PACS Market Volume (K Unit) Forecast, by Application 2020 & 2033
- Table 43: Global Ophthalmology PACS Market Revenue million Forecast, by Type 2020 & 2033
- Table 44: Global Ophthalmology PACS Market Volume K Unit Forecast, by Type 2020 & 2033
- Table 45: Global Ophthalmology PACS Market Revenue million Forecast, by Delivery Model 2020 & 2033
- Table 46: Global Ophthalmology PACS Market Volume K Unit Forecast, by Delivery Model 2020 & 2033
- Table 47: Global Ophthalmology PACS Market Revenue million Forecast, by End User 2020 & 2033
- Table 48: Global Ophthalmology PACS Market Volume K Unit Forecast, by End User 2020 & 2033
- Table 49: Global Ophthalmology PACS Market Revenue million Forecast, by Country 2020 & 2033
- Table 50: Global Ophthalmology PACS Market Volume K Unit Forecast, by Country 2020 & 2033
- Table 51: China Global Ophthalmology PACS Market Revenue (million) Forecast, by Application 2020 & 2033
- Table 52: China Global Ophthalmology PACS Market Volume (K Unit) Forecast, by Application 2020 & 2033
- Table 53: Japan Global Ophthalmology PACS Market Revenue (million) Forecast, by Application 2020 & 2033
- Table 54: Japan Global Ophthalmology PACS Market Volume (K Unit) Forecast, by Application 2020 & 2033
- Table 55: India Global Ophthalmology PACS Market Revenue (million) Forecast, by Application 2020 & 2033
- Table 56: India Global Ophthalmology PACS Market Volume (K Unit) Forecast, by Application 2020 & 2033
- Table 57: Australia Global Ophthalmology PACS Market Revenue (million) Forecast, by Application 2020 & 2033
- Table 58: Australia Global Ophthalmology PACS Market Volume (K Unit) Forecast, by Application 2020 & 2033
- Table 59: South Korea Global Ophthalmology PACS Market Revenue (million) Forecast, by Application 2020 & 2033
- Table 60: South Korea Global Ophthalmology PACS Market Volume (K Unit) Forecast, by Application 2020 & 2033
- Table 61: Rest of Asia Pacific Global Ophthalmology PACS Market Revenue (million) Forecast, by Application 2020 & 2033
- Table 62: Rest of Asia Pacific Global Ophthalmology PACS Market Volume (K Unit) Forecast, by Application 2020 & 2033
- Table 63: Global Ophthalmology PACS Market Revenue million Forecast, by Type 2020 & 2033
- Table 64: Global Ophthalmology PACS Market Volume K Unit Forecast, by Type 2020 & 2033
- Table 65: Global Ophthalmology PACS Market Revenue million Forecast, by Delivery Model 2020 & 2033
- Table 66: Global Ophthalmology PACS Market Volume K Unit Forecast, by Delivery Model 2020 & 2033
- Table 67: Global Ophthalmology PACS Market Revenue million Forecast, by End User 2020 & 2033
- Table 68: Global Ophthalmology PACS Market Volume K Unit Forecast, by End User 2020 & 2033
- Table 69: Global Ophthalmology PACS Market Revenue million Forecast, by Country 2020 & 2033
- Table 70: Global Ophthalmology PACS Market Volume K Unit Forecast, by Country 2020 & 2033
- Table 71: GCC Global Ophthalmology PACS Market Revenue (million) Forecast, by Application 2020 & 2033
- Table 72: GCC Global Ophthalmology PACS Market Volume (K Unit) Forecast, by Application 2020 & 2033
- Table 73: South Africa Global Ophthalmology PACS Market Revenue (million) Forecast, by Application 2020 & 2033
- Table 74: South Africa Global Ophthalmology PACS Market Volume (K Unit) Forecast, by Application 2020 & 2033
- Table 75: Rest of Middle East and Africa Global Ophthalmology PACS Market Revenue (million) Forecast, by Application 2020 & 2033
- Table 76: Rest of Middle East and Africa Global Ophthalmology PACS Market Volume (K Unit) Forecast, by Application 2020 & 2033
- Table 77: Global Ophthalmology PACS Market Revenue million Forecast, by Type 2020 & 2033
- Table 78: Global Ophthalmology PACS Market Volume K Unit Forecast, by Type 2020 & 2033
- Table 79: Global Ophthalmology PACS Market Revenue million Forecast, by Delivery Model 2020 & 2033
- Table 80: Global Ophthalmology PACS Market Volume K Unit Forecast, by Delivery Model 2020 & 2033
- Table 81: Global Ophthalmology PACS Market Revenue million Forecast, by End User 2020 & 2033
- Table 82: Global Ophthalmology PACS Market Volume K Unit Forecast, by End User 2020 & 2033
- Table 83: Global Ophthalmology PACS Market Revenue million Forecast, by Country 2020 & 2033
- Table 84: Global Ophthalmology PACS Market Volume K Unit Forecast, by Country 2020 & 2033
- Table 85: Brazil Global Ophthalmology PACS Market Revenue (million) Forecast, by Application 2020 & 2033
- Table 86: Brazil Global Ophthalmology PACS Market Volume (K Unit) Forecast, by Application 2020 & 2033
- Table 87: Argentina Global Ophthalmology PACS Market Revenue (million) Forecast, by Application 2020 & 2033
- Table 88: Argentina Global Ophthalmology PACS Market Volume (K Unit) Forecast, by Application 2020 & 2033
- Table 89: Rest of South America Global Ophthalmology PACS Market Revenue (million) Forecast, by Application 2020 & 2033
- Table 90: Rest of South America Global Ophthalmology PACS Market Volume (K Unit) Forecast, by Application 2020 & 2033
Frequently Asked Questions
1. What is the projected Compound Annual Growth Rate (CAGR) of the Global Ophthalmology PACS Market?
The projected CAGR is approximately 8.4%.
2. Which companies are prominent players in the Global Ophthalmology PACS Market?
Key companies in the market include VersaSuite, Heidelberg Engineering GmbH, Carl Zeiss Meditec AG, Medical Standard Co Ltd, IBM Corporation, Agfa-Gevaert N V, Visbion Limited, Sonomed Escalon.
3. What are the main segments of the Global Ophthalmology PACS Market?
The market segments include Type, Delivery Model, End User.
4. Can you provide details about the market size?
The market size is estimated to be USD 184.4 million as of 2022.
5. What are some drivers contributing to market growth?
High Prevalence of Eye Diseases; Increasing Geriatric Population; Expansion of Teleophthalmology.
6. What are the notable trends driving market growth?
Integrated PACS Segment is Expected to Show Better Growth Over the Forecast Years.
7. Are there any restraints impacting market growth?
High Implementation and Maintenance Costs.
8. Can you provide examples of recent developments in the market?
May 2022: OMNY Health partnered with community-based ophthalmology practices to launch a real-world data ecosystem focused on driving collaborative research partnerships to advance treatments and improve outcomes for patients with ophthalmic disorders.
9. What pricing options are available for accessing the report?
Pricing options include single-user, multi-user, and enterprise licenses priced at USD 4750, USD 5250, and USD 8750 respectively.
10. Is the market size provided in terms of value or volume?
The market size is provided in terms of value, measured in million and volume, measured in K Unit.
11. Are there any specific market keywords associated with the report?
Yes, the market keyword associated with the report is "Global Ophthalmology PACS Market," which aids in identifying and referencing the specific market segment covered.
12. How do I determine which pricing option suits my needs best?
The pricing options vary based on user requirements and access needs. Individual users may opt for single-user licenses, while businesses requiring broader access may choose multi-user or enterprise licenses for cost-effective access to the report.
13. Are there any additional resources or data provided in the Global Ophthalmology PACS Market report?
While the report offers comprehensive insights, it's advisable to review the specific contents or supplementary materials provided to ascertain if additional resources or data are available.
14. How can I stay updated on further developments or reports in the Global Ophthalmology PACS Market?
To stay informed about further developments, trends, and reports in the Global Ophthalmology PACS Market, consider subscribing to industry newsletters, following relevant companies and organizations, or regularly checking reputable industry news sources and publications.
Methodology
Step 1 - Identification of Relevant Samples Size from Population Database


Step 2 - Approaches for Defining Global Market Size (Value, Volume* & Price*)

Note*: In applicable scenarios
Step 3 - Data Sources
Primary Research
- Web Analytics
- Survey Reports
- Research Institute
- Latest Research Reports
- Opinion Leaders
Secondary Research
- Annual Reports
- White Paper
- Latest Press Release
- Industry Association
- Paid Database
- Investor Presentations

Step 4 - Data Triangulation
Involves using different sources of information in order to increase the validity of a study
These sources are likely to be stakeholders in a program - participants, other researchers, program staff, other community members, and so on.
Then we put all data in single framework & apply various statistical tools to find out the dynamic on the market.
During the analysis stage, feedback from the stakeholder groups would be compared to determine areas of agreement as well as areas of divergence