

Key Insights
The global Intravenous Laser Therapy market is poised for significant expansion, projected to reach $0.5 billion in 2025. This growth is fueled by an anticipated Compound Annual Growth Rate (CAGR) of 7.9% over the forecast period of 2025-2033. The increasing adoption of minimally invasive procedures, coupled with advancements in laser technology, is a primary driver. Intravenous laser therapy offers distinct advantages over traditional treatments, including reduced patient recovery times, lower risk of complications, and improved efficacy in managing various vascular and dermatological conditions. Hospitals, ambulatory surgical centers, and specialized clinics are increasingly investing in these innovative therapeutic systems to enhance patient care and outcomes. The market is also benefiting from a growing awareness among healthcare professionals and patients regarding the therapeutic benefits of laser-based treatments.
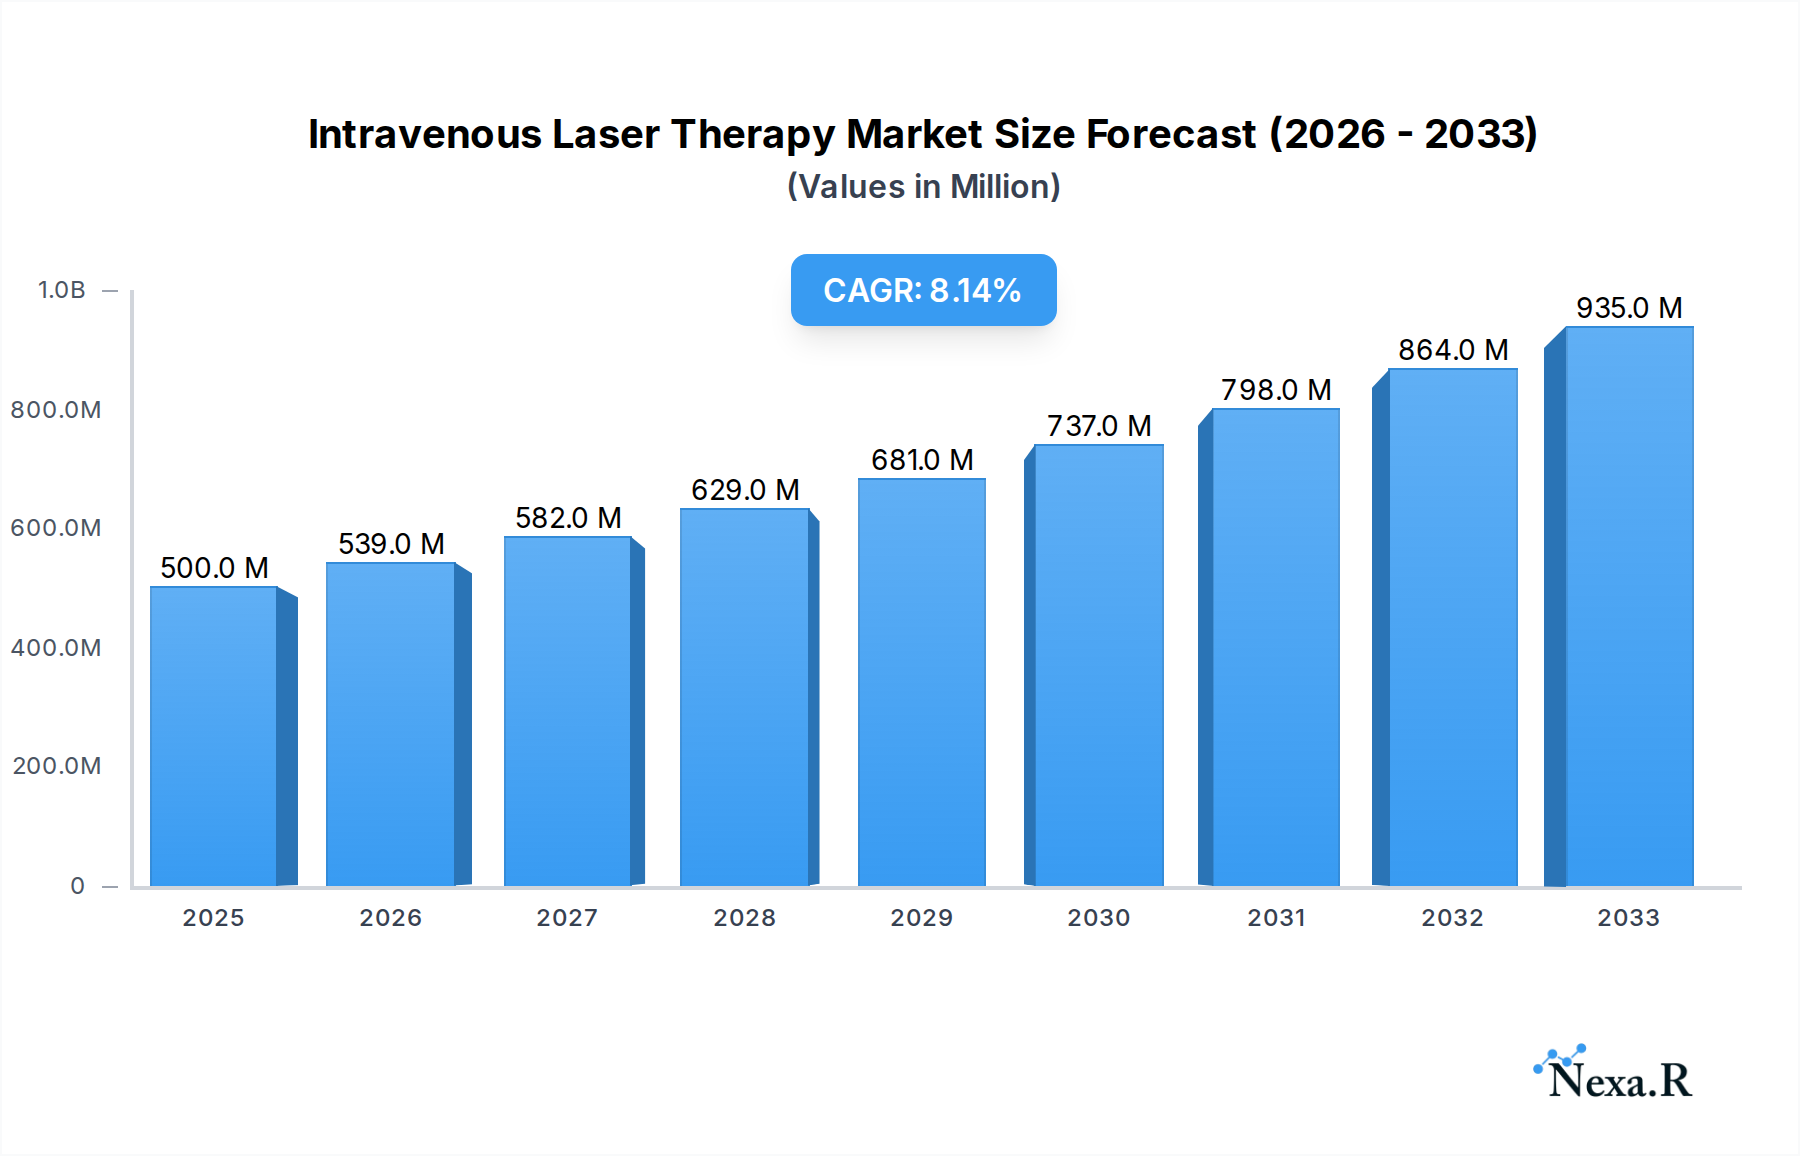
Intravenous Laser Therapy Market Size (In Million)
The market's trajectory is further bolstered by emerging trends such as the development of more sophisticated and targeted laser systems and the expanding applications of intravenous laser therapy beyond traditional uses. While the market exhibits robust growth potential, certain factors could influence its pace. These include the initial cost of advanced laser equipment, the need for specialized training for healthcare providers, and regulatory hurdles in certain regions. However, the persistent demand for effective, safe, and patient-friendly treatments is expected to outweigh these challenges. Key players like AngioDynamics, Syneron Medical, and Dornier MedTech are actively engaged in research and development to introduce novel solutions, thereby shaping the competitive landscape and driving innovation within the intravenous laser therapy sector. The market is segmented by application and type, with Intravenous Laser Systems and Intravenous Laser Fibers representing the primary technological categories.

Intravenous Laser Therapy Company Market Share
Intravenous Laser Therapy Market Dynamics & Structure
The global Intravenous Laser Therapy (IVLT) market is characterized by a moderately concentrated landscape, with key players heavily investing in technological advancements to enhance treatment efficacy and patient outcomes. Innovation drivers are primarily focused on developing more precise laser delivery systems, exploring novel therapeutic applications, and improving the safety profile of IVLT procedures. Robust regulatory frameworks, particularly in developed economies, ensure adherence to strict quality and safety standards, influencing market entry and product development strategies. While competitive product substitutes exist in traditional therapies, IVLT's minimally invasive nature and potential for faster recovery periods offer a distinct advantage. End-user demographics reveal a growing demand from an aging population with increasing prevalence of chronic conditions, alongside a rising interest from younger demographics seeking aesthetic and wellness applications. Merger and acquisition (M&A) trends are anticipated to see strategic consolidation as larger companies seek to expand their product portfolios and market reach.
- Market Concentration: Moderately concentrated, with leading players holding significant market share.
- Technological Innovation: Focus on precision, novel applications, and improved safety.
- Regulatory Frameworks: Stringent regulations in major markets shaping product development.
- Competitive Substitutes: Traditional therapies facing competition from IVLT's benefits.
- End-User Demographics: Aging population and wellness-focused younger demographics driving demand.
- M&A Trends: Strategic consolidation expected to intensify.
Intravenous Laser Therapy Growth Trends & Insights
The Intravenous Laser Therapy market is poised for robust expansion, driven by an escalating global demand for minimally invasive therapeutic solutions and advancements in laser technology. The market size is projected to witness significant growth from $5.5 billion in 2023 to an estimated $12.8 billion by 2033, exhibiting a compound annual growth rate (CAGR) of approximately 8.9% during the forecast period. This upward trajectory is underpinned by increasing adoption rates across various healthcare settings, including hospitals and specialized clinics, as healthcare providers recognize the therapeutic benefits of IVLT for a wide spectrum of conditions. Technological disruptions, such as the development of more sophisticated laser systems with enhanced targeting capabilities and the integration of artificial intelligence for treatment optimization, are expected to further fuel market penetration.
Consumer behavior is also shifting towards proactive health management and aesthetic enhancements, creating new avenues for IVLT applications. The growing awareness among both patients and physicians regarding the efficacy of IVLT in managing pain, inflammation, and promoting tissue regeneration is a critical factor. Furthermore, the increasing preference for outpatient procedures and shorter recovery times aligns perfectly with the inherent advantages of IVLT, positioning it as a preferred treatment modality. The market penetration is expected to deepen as reimbursement policies become more favorable and clinical evidence supporting the diverse applications of IVLT continues to accumulate. The evolving landscape of chronic disease management, coupled with the pursuit of non-pharmacological treatment options, will continue to propel the IVLT market forward, making it an attractive segment for investment and innovation within the broader healthcare industry.
Dominant Regions, Countries, or Segments in Intravenous Laser Therapy
The Intravenous Laser Therapy market is experiencing dynamic growth, with distinct regional and segmental leadership shaping its trajectory. North America is currently the dominant region, propelled by a robust healthcare infrastructure, significant investment in medical technology research and development, and a high prevalence of chronic diseases necessitating advanced therapeutic interventions. The United States, in particular, accounts for a substantial share of the global market, driven by early adoption of innovative medical devices and favorable reimbursement policies for IVLT procedures in hospitals and specialized clinics. Economic policies in North America that encourage technological innovation and market access for advanced medical treatments further solidify its leading position.
Within the application segment, Hospitals represent the largest and most influential category. This dominance stems from the comprehensive diagnostic and treatment capabilities offered by hospital settings, where IVLT can be integrated into broader treatment plans for a wide range of medical conditions. The availability of skilled medical professionals, advanced infrastructure, and a consistent flow of patient volume make hospitals the primary point of IVLT service delivery. Ambulatory Surgical Centers (ASCs) are emerging as a rapidly growing segment, attracting patients seeking cost-effective and convenient IVLT procedures outside of traditional hospital settings.
Regarding product types, Intravenous Laser Systems hold the leading market share. These systems encompass the core technology responsible for delivering laser energy directly into the bloodstream. Continuous advancements in laser technology, including improved wavelength precision, power output, and user-friendly interfaces, contribute to the sustained demand for these systems. While Intravenous Laser Fibers are crucial components, the overall market is more heavily influenced by the innovation and adoption of the complete laser systems. The growth potential in emerging economies, particularly in Asia-Pacific and Latin America, presents significant opportunities due to a burgeoning healthcare sector, increasing disposable incomes, and a growing awareness of advanced medical treatments.
Intravenous Laser Therapy Product Landscape
The product landscape of Intravenous Laser Therapy is defined by continuous innovation, focusing on enhanced efficacy, patient safety, and expanded therapeutic applications. Leading companies are developing advanced Intravenous Laser Systems that offer precise wavelength control, adjustable power outputs, and integrated real-time monitoring capabilities. These systems are designed for minimally invasive procedures, targeting a spectrum of conditions ranging from chronic pain and inflammation to wound healing and cardiovascular support. Unique selling propositions include reduced side effects compared to traditional treatments, faster patient recovery times, and the potential for personalized treatment protocols. Technological advancements are also driving the development of more sophisticated Intravenous Laser Fibers, featuring improved biocompatibility and optimized light delivery for deeper tissue penetration, further expanding the clinical utility of IVLT.
Key Drivers, Barriers & Challenges in Intravenous Laser Therapy
Key Drivers:
The Intravenous Laser Therapy market is primarily propelled by technological advancements in laser device manufacturing, leading to more precise and effective treatment modalities. An increasing global prevalence of chronic diseases, such as cardiovascular disorders and autoimmune conditions, fuels the demand for innovative and minimally invasive therapeutic solutions. Favorable reimbursement policies in key markets, alongside growing physician and patient awareness of IVLT's benefits, are significant growth accelerators. The rising trend towards non-pharmacological treatment options and the pursuit of enhanced aesthetic and wellness outcomes also contribute to market expansion.
Key Barriers & Challenges:
Despite its potential, the IVLT market faces several challenges. High initial investment costs for advanced laser systems can be a barrier for smaller clinics and developing regions. Regulatory hurdles and the need for extensive clinical validation to secure widespread adoption in certain therapeutic areas can slow down market entry. Limited physician awareness and specialized training required for optimal IVLT application present another restraint. Furthermore, the availability of alternative therapies and the ongoing need to establish long-term efficacy data for all potential applications can pose competitive pressures and slow down market penetration. Supply chain disruptions, though often transient, can also impact product availability and pricing.
Emerging Opportunities in Intravenous Laser Therapy
Emerging opportunities in the Intravenous Laser Therapy sector are ripe for exploration, driven by a growing understanding of its diverse therapeutic potential. Untapped markets in developing countries with increasing healthcare expenditure represent a significant growth avenue. Innovative applications in regenerative medicine, such as accelerated tissue repair and nerve regeneration, are gaining traction. Furthermore, the increasing consumer interest in non-invasive cosmetic procedures and wellness treatments, including anti-aging and immune system boosting, presents a burgeoning segment for IVLT. Collaborations between IVLT manufacturers and research institutions are crucial for unlocking these opportunities and expanding the clinical evidence base.
Growth Accelerators in the Intravenous Laser Therapy Industry
Several catalysts are accelerating the growth of the Intravenous Laser Therapy industry. Continuous technological breakthroughs in laser physics and optics are leading to the development of more efficient, targeted, and versatile IVLT devices. Strategic partnerships between IVLT technology providers, research institutions, and healthcare organizations are crucial for driving clinical validation and expanding treatment protocols. Market expansion strategies targeting underserved patient populations and geographical regions are also key growth accelerators. The increasing emphasis on personalized medicine and the ability of IVLT to be tailored to individual patient needs further contribute to its long-term growth trajectory.
Key Players Shaping the Intravenous Laser Therapy Market
- AngioDynamics
- Syneron Medical
- Dornier MedTech
- Alma Lasers
- Alna-Medical System
- LSO Medical
- Wontech
- Intros Medical Laser
- Energist Ltd.
Notable Milestones in Intravenous Laser Therapy Sector
- 2019: Introduction of next-generation low-level laser therapy (LLLT) devices with enhanced precision.
- 2020: Key clinical trial publication demonstrating significant efficacy in chronic pain management.
- 2021: Increased regulatory approvals for IVLT systems for expanded therapeutic indications.
- 2022: Major companies announce strategic partnerships for research and development of advanced IVLT applications.
- 2023: Growing adoption of IVLT in aesthetic and wellness clinics for rejuvenation therapies.
- 2024: Emergence of AI-powered IVLT systems for optimized treatment planning.
- 2025: Significant market growth projected driven by increased awareness and favorable reimbursement.
- 2026-2033: Continued innovation in laser technology and expansion into new therapeutic areas.
In-Depth Intravenous Laser Therapy Market Outlook
The future outlook for the Intravenous Laser Therapy market is exceptionally promising, driven by a confluence of accelerating factors. Ongoing technological innovations in laser systems and fibers will continue to enhance treatment efficacy and broaden the scope of therapeutic applications, particularly in regenerative medicine and chronic disease management. Strategic collaborations between key market players, research institutions, and healthcare providers will be instrumental in driving clinical validation and facilitating market access. Furthermore, expanding into emerging economies with growing healthcare infrastructures and increasing patient demand for advanced treatments presents a significant avenue for growth. The intrinsic benefits of IVLT, including its minimally invasive nature and potential for faster recovery, align perfectly with global healthcare trends, positioning the market for sustained and robust expansion.
Intravenous Laser Therapy Segmentation
-
1. Application
- 1.1. Hospitals
- 1.2. Ambulatory Surgical Centers
- 1.3. Specialized Clinics
- 1.4. Others
-
2. Types
- 2.1. Intravenous Laser Systems
- 2.2. Intravenous Laser Fibers
Intravenous Laser Therapy Segmentation By Geography
-
1. North America
- 1.1. United States
- 1.2. Canada
- 1.3. Mexico
-
2. South America
- 2.1. Brazil
- 2.2. Argentina
- 2.3. Rest of South America
-
3. Europe
- 3.1. United Kingdom
- 3.2. Germany
- 3.3. France
- 3.4. Italy
- 3.5. Spain
- 3.6. Russia
- 3.7. Benelux
- 3.8. Nordics
- 3.9. Rest of Europe
-
4. Middle East & Africa
- 4.1. Turkey
- 4.2. Israel
- 4.3. GCC
- 4.4. North Africa
- 4.5. South Africa
- 4.6. Rest of Middle East & Africa
-
5. Asia Pacific
- 5.1. China
- 5.2. India
- 5.3. Japan
- 5.4. South Korea
- 5.5. ASEAN
- 5.6. Oceania
- 5.7. Rest of Asia Pacific
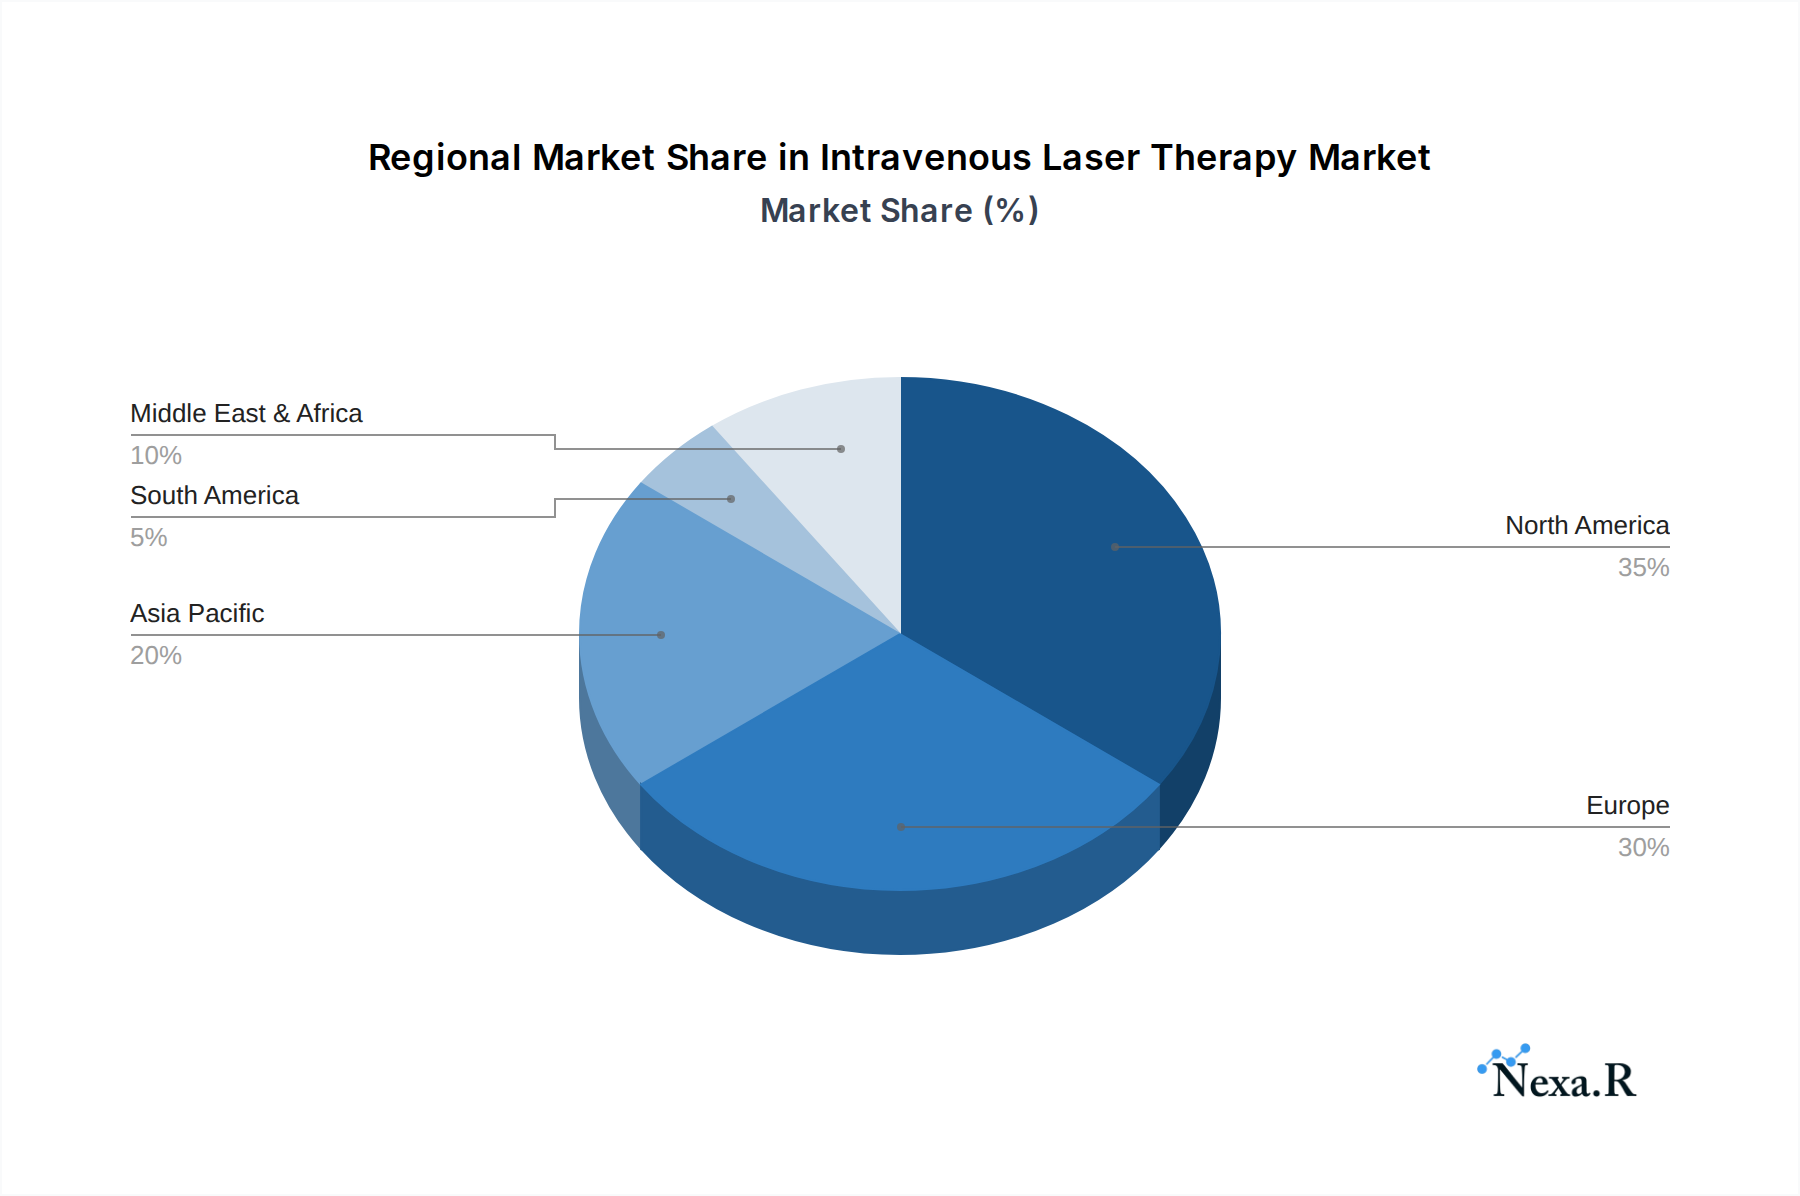
Intravenous Laser Therapy Regional Market Share
Geographic Coverage of Intravenous Laser Therapy
Intravenous Laser Therapy REPORT HIGHLIGHTS
| Aspects | Details |
|---|---|
| Study Period | 2020-2034 |
| Base Year | 2025 |
| Estimated Year | 2026 |
| Forecast Period | 2026-2034 |
| Historical Period | 2020-2025 |
| Growth Rate | CAGR of 7.9% from 2020-2034 |
| Segmentation |
|
Table of Contents
- 1. Introduction
- 1.1. Research Scope
- 1.2. Market Segmentation
- 1.3. Research Methodology
- 1.4. Definitions and Assumptions
- 2. Executive Summary
- 2.1. Introduction
- 3. Market Dynamics
- 3.1. Introduction
- 3.2. Market Drivers
- 3.3. Market Restrains
- 3.4. Market Trends
- 4. Market Factor Analysis
- 4.1. Porters Five Forces
- 4.2. Supply/Value Chain
- 4.3. PESTEL analysis
- 4.4. Market Entropy
- 4.5. Patent/Trademark Analysis
- 5. Global Intravenous Laser Therapy Analysis, Insights and Forecast, 2020-2032
- 5.1. Market Analysis, Insights and Forecast - by Application
- 5.1.1. Hospitals
- 5.1.2. Ambulatory Surgical Centers
- 5.1.3. Specialized Clinics
- 5.1.4. Others
- 5.2. Market Analysis, Insights and Forecast - by Types
- 5.2.1. Intravenous Laser Systems
- 5.2.2. Intravenous Laser Fibers
- 5.3. Market Analysis, Insights and Forecast - by Region
- 5.3.1. North America
- 5.3.2. South America
- 5.3.3. Europe
- 5.3.4. Middle East & Africa
- 5.3.5. Asia Pacific
- 5.1. Market Analysis, Insights and Forecast - by Application
- 6. North America Intravenous Laser Therapy Analysis, Insights and Forecast, 2020-2032
- 6.1. Market Analysis, Insights and Forecast - by Application
- 6.1.1. Hospitals
- 6.1.2. Ambulatory Surgical Centers
- 6.1.3. Specialized Clinics
- 6.1.4. Others
- 6.2. Market Analysis, Insights and Forecast - by Types
- 6.2.1. Intravenous Laser Systems
- 6.2.2. Intravenous Laser Fibers
- 6.1. Market Analysis, Insights and Forecast - by Application
- 7. South America Intravenous Laser Therapy Analysis, Insights and Forecast, 2020-2032
- 7.1. Market Analysis, Insights and Forecast - by Application
- 7.1.1. Hospitals
- 7.1.2. Ambulatory Surgical Centers
- 7.1.3. Specialized Clinics
- 7.1.4. Others
- 7.2. Market Analysis, Insights and Forecast - by Types
- 7.2.1. Intravenous Laser Systems
- 7.2.2. Intravenous Laser Fibers
- 7.1. Market Analysis, Insights and Forecast - by Application
- 8. Europe Intravenous Laser Therapy Analysis, Insights and Forecast, 2020-2032
- 8.1. Market Analysis, Insights and Forecast - by Application
- 8.1.1. Hospitals
- 8.1.2. Ambulatory Surgical Centers
- 8.1.3. Specialized Clinics
- 8.1.4. Others
- 8.2. Market Analysis, Insights and Forecast - by Types
- 8.2.1. Intravenous Laser Systems
- 8.2.2. Intravenous Laser Fibers
- 8.1. Market Analysis, Insights and Forecast - by Application
- 9. Middle East & Africa Intravenous Laser Therapy Analysis, Insights and Forecast, 2020-2032
- 9.1. Market Analysis, Insights and Forecast - by Application
- 9.1.1. Hospitals
- 9.1.2. Ambulatory Surgical Centers
- 9.1.3. Specialized Clinics
- 9.1.4. Others
- 9.2. Market Analysis, Insights and Forecast - by Types
- 9.2.1. Intravenous Laser Systems
- 9.2.2. Intravenous Laser Fibers
- 9.1. Market Analysis, Insights and Forecast - by Application
- 10. Asia Pacific Intravenous Laser Therapy Analysis, Insights and Forecast, 2020-2032
- 10.1. Market Analysis, Insights and Forecast - by Application
- 10.1.1. Hospitals
- 10.1.2. Ambulatory Surgical Centers
- 10.1.3. Specialized Clinics
- 10.1.4. Others
- 10.2. Market Analysis, Insights and Forecast - by Types
- 10.2.1. Intravenous Laser Systems
- 10.2.2. Intravenous Laser Fibers
- 10.1. Market Analysis, Insights and Forecast - by Application
- 11. Competitive Analysis
- 11.1. Global Market Share Analysis 2025
- 11.2. Company Profiles
- 11.2.1 AngioDynamics
- 11.2.1.1. Overview
- 11.2.1.2. Products
- 11.2.1.3. SWOT Analysis
- 11.2.1.4. Recent Developments
- 11.2.1.5. Financials (Based on Availability)
- 11.2.2 Syneron Medical
- 11.2.2.1. Overview
- 11.2.2.2. Products
- 11.2.2.3. SWOT Analysis
- 11.2.2.4. Recent Developments
- 11.2.2.5. Financials (Based on Availability)
- 11.2.3 Dornier MedTech
- 11.2.3.1. Overview
- 11.2.3.2. Products
- 11.2.3.3. SWOT Analysis
- 11.2.3.4. Recent Developments
- 11.2.3.5. Financials (Based on Availability)
- 11.2.4 Alma Lasers
- 11.2.4.1. Overview
- 11.2.4.2. Products
- 11.2.4.3. SWOT Analysis
- 11.2.4.4. Recent Developments
- 11.2.4.5. Financials (Based on Availability)
- 11.2.5 Alna-Medical System
- 11.2.5.1. Overview
- 11.2.5.2. Products
- 11.2.5.3. SWOT Analysis
- 11.2.5.4. Recent Developments
- 11.2.5.5. Financials (Based on Availability)
- 11.2.6 LSO Medical
- 11.2.6.1. Overview
- 11.2.6.2. Products
- 11.2.6.3. SWOT Analysis
- 11.2.6.4. Recent Developments
- 11.2.6.5. Financials (Based on Availability)
- 11.2.7 Wontech
- 11.2.7.1. Overview
- 11.2.7.2. Products
- 11.2.7.3. SWOT Analysis
- 11.2.7.4. Recent Developments
- 11.2.7.5. Financials (Based on Availability)
- 11.2.8 Intros Medical Laser
- 11.2.8.1. Overview
- 11.2.8.2. Products
- 11.2.8.3. SWOT Analysis
- 11.2.8.4. Recent Developments
- 11.2.8.5. Financials (Based on Availability)
- 11.2.9 Energist Ltd.
- 11.2.9.1. Overview
- 11.2.9.2. Products
- 11.2.9.3. SWOT Analysis
- 11.2.9.4. Recent Developments
- 11.2.9.5. Financials (Based on Availability)
- 11.2.1 AngioDynamics
List of Figures
- Figure 1: Global Intravenous Laser Therapy Revenue Breakdown (billion, %) by Region 2025 & 2033
- Figure 2: Global Intravenous Laser Therapy Volume Breakdown (K, %) by Region 2025 & 2033
- Figure 3: North America Intravenous Laser Therapy Revenue (billion), by Application 2025 & 2033
- Figure 4: North America Intravenous Laser Therapy Volume (K), by Application 2025 & 2033
- Figure 5: North America Intravenous Laser Therapy Revenue Share (%), by Application 2025 & 2033
- Figure 6: North America Intravenous Laser Therapy Volume Share (%), by Application 2025 & 2033
- Figure 7: North America Intravenous Laser Therapy Revenue (billion), by Types 2025 & 2033
- Figure 8: North America Intravenous Laser Therapy Volume (K), by Types 2025 & 2033
- Figure 9: North America Intravenous Laser Therapy Revenue Share (%), by Types 2025 & 2033
- Figure 10: North America Intravenous Laser Therapy Volume Share (%), by Types 2025 & 2033
- Figure 11: North America Intravenous Laser Therapy Revenue (billion), by Country 2025 & 2033
- Figure 12: North America Intravenous Laser Therapy Volume (K), by Country 2025 & 2033
- Figure 13: North America Intravenous Laser Therapy Revenue Share (%), by Country 2025 & 2033
- Figure 14: North America Intravenous Laser Therapy Volume Share (%), by Country 2025 & 2033
- Figure 15: South America Intravenous Laser Therapy Revenue (billion), by Application 2025 & 2033
- Figure 16: South America Intravenous Laser Therapy Volume (K), by Application 2025 & 2033
- Figure 17: South America Intravenous Laser Therapy Revenue Share (%), by Application 2025 & 2033
- Figure 18: South America Intravenous Laser Therapy Volume Share (%), by Application 2025 & 2033
- Figure 19: South America Intravenous Laser Therapy Revenue (billion), by Types 2025 & 2033
- Figure 20: South America Intravenous Laser Therapy Volume (K), by Types 2025 & 2033
- Figure 21: South America Intravenous Laser Therapy Revenue Share (%), by Types 2025 & 2033
- Figure 22: South America Intravenous Laser Therapy Volume Share (%), by Types 2025 & 2033
- Figure 23: South America Intravenous Laser Therapy Revenue (billion), by Country 2025 & 2033
- Figure 24: South America Intravenous Laser Therapy Volume (K), by Country 2025 & 2033
- Figure 25: South America Intravenous Laser Therapy Revenue Share (%), by Country 2025 & 2033
- Figure 26: South America Intravenous Laser Therapy Volume Share (%), by Country 2025 & 2033
- Figure 27: Europe Intravenous Laser Therapy Revenue (billion), by Application 2025 & 2033
- Figure 28: Europe Intravenous Laser Therapy Volume (K), by Application 2025 & 2033
- Figure 29: Europe Intravenous Laser Therapy Revenue Share (%), by Application 2025 & 2033
- Figure 30: Europe Intravenous Laser Therapy Volume Share (%), by Application 2025 & 2033
- Figure 31: Europe Intravenous Laser Therapy Revenue (billion), by Types 2025 & 2033
- Figure 32: Europe Intravenous Laser Therapy Volume (K), by Types 2025 & 2033
- Figure 33: Europe Intravenous Laser Therapy Revenue Share (%), by Types 2025 & 2033
- Figure 34: Europe Intravenous Laser Therapy Volume Share (%), by Types 2025 & 2033
- Figure 35: Europe Intravenous Laser Therapy Revenue (billion), by Country 2025 & 2033
- Figure 36: Europe Intravenous Laser Therapy Volume (K), by Country 2025 & 2033
- Figure 37: Europe Intravenous Laser Therapy Revenue Share (%), by Country 2025 & 2033
- Figure 38: Europe Intravenous Laser Therapy Volume Share (%), by Country 2025 & 2033
- Figure 39: Middle East & Africa Intravenous Laser Therapy Revenue (billion), by Application 2025 & 2033
- Figure 40: Middle East & Africa Intravenous Laser Therapy Volume (K), by Application 2025 & 2033
- Figure 41: Middle East & Africa Intravenous Laser Therapy Revenue Share (%), by Application 2025 & 2033
- Figure 42: Middle East & Africa Intravenous Laser Therapy Volume Share (%), by Application 2025 & 2033
- Figure 43: Middle East & Africa Intravenous Laser Therapy Revenue (billion), by Types 2025 & 2033
- Figure 44: Middle East & Africa Intravenous Laser Therapy Volume (K), by Types 2025 & 2033
- Figure 45: Middle East & Africa Intravenous Laser Therapy Revenue Share (%), by Types 2025 & 2033
- Figure 46: Middle East & Africa Intravenous Laser Therapy Volume Share (%), by Types 2025 & 2033
- Figure 47: Middle East & Africa Intravenous Laser Therapy Revenue (billion), by Country 2025 & 2033
- Figure 48: Middle East & Africa Intravenous Laser Therapy Volume (K), by Country 2025 & 2033
- Figure 49: Middle East & Africa Intravenous Laser Therapy Revenue Share (%), by Country 2025 & 2033
- Figure 50: Middle East & Africa Intravenous Laser Therapy Volume Share (%), by Country 2025 & 2033
- Figure 51: Asia Pacific Intravenous Laser Therapy Revenue (billion), by Application 2025 & 2033
- Figure 52: Asia Pacific Intravenous Laser Therapy Volume (K), by Application 2025 & 2033
- Figure 53: Asia Pacific Intravenous Laser Therapy Revenue Share (%), by Application 2025 & 2033
- Figure 54: Asia Pacific Intravenous Laser Therapy Volume Share (%), by Application 2025 & 2033
- Figure 55: Asia Pacific Intravenous Laser Therapy Revenue (billion), by Types 2025 & 2033
- Figure 56: Asia Pacific Intravenous Laser Therapy Volume (K), by Types 2025 & 2033
- Figure 57: Asia Pacific Intravenous Laser Therapy Revenue Share (%), by Types 2025 & 2033
- Figure 58: Asia Pacific Intravenous Laser Therapy Volume Share (%), by Types 2025 & 2033
- Figure 59: Asia Pacific Intravenous Laser Therapy Revenue (billion), by Country 2025 & 2033
- Figure 60: Asia Pacific Intravenous Laser Therapy Volume (K), by Country 2025 & 2033
- Figure 61: Asia Pacific Intravenous Laser Therapy Revenue Share (%), by Country 2025 & 2033
- Figure 62: Asia Pacific Intravenous Laser Therapy Volume Share (%), by Country 2025 & 2033
List of Tables
- Table 1: Global Intravenous Laser Therapy Revenue billion Forecast, by Application 2020 & 2033
- Table 2: Global Intravenous Laser Therapy Volume K Forecast, by Application 2020 & 2033
- Table 3: Global Intravenous Laser Therapy Revenue billion Forecast, by Types 2020 & 2033
- Table 4: Global Intravenous Laser Therapy Volume K Forecast, by Types 2020 & 2033
- Table 5: Global Intravenous Laser Therapy Revenue billion Forecast, by Region 2020 & 2033
- Table 6: Global Intravenous Laser Therapy Volume K Forecast, by Region 2020 & 2033
- Table 7: Global Intravenous Laser Therapy Revenue billion Forecast, by Application 2020 & 2033
- Table 8: Global Intravenous Laser Therapy Volume K Forecast, by Application 2020 & 2033
- Table 9: Global Intravenous Laser Therapy Revenue billion Forecast, by Types 2020 & 2033
- Table 10: Global Intravenous Laser Therapy Volume K Forecast, by Types 2020 & 2033
- Table 11: Global Intravenous Laser Therapy Revenue billion Forecast, by Country 2020 & 2033
- Table 12: Global Intravenous Laser Therapy Volume K Forecast, by Country 2020 & 2033
- Table 13: United States Intravenous Laser Therapy Revenue (billion) Forecast, by Application 2020 & 2033
- Table 14: United States Intravenous Laser Therapy Volume (K) Forecast, by Application 2020 & 2033
- Table 15: Canada Intravenous Laser Therapy Revenue (billion) Forecast, by Application 2020 & 2033
- Table 16: Canada Intravenous Laser Therapy Volume (K) Forecast, by Application 2020 & 2033
- Table 17: Mexico Intravenous Laser Therapy Revenue (billion) Forecast, by Application 2020 & 2033
- Table 18: Mexico Intravenous Laser Therapy Volume (K) Forecast, by Application 2020 & 2033
- Table 19: Global Intravenous Laser Therapy Revenue billion Forecast, by Application 2020 & 2033
- Table 20: Global Intravenous Laser Therapy Volume K Forecast, by Application 2020 & 2033
- Table 21: Global Intravenous Laser Therapy Revenue billion Forecast, by Types 2020 & 2033
- Table 22: Global Intravenous Laser Therapy Volume K Forecast, by Types 2020 & 2033
- Table 23: Global Intravenous Laser Therapy Revenue billion Forecast, by Country 2020 & 2033
- Table 24: Global Intravenous Laser Therapy Volume K Forecast, by Country 2020 & 2033
- Table 25: Brazil Intravenous Laser Therapy Revenue (billion) Forecast, by Application 2020 & 2033
- Table 26: Brazil Intravenous Laser Therapy Volume (K) Forecast, by Application 2020 & 2033
- Table 27: Argentina Intravenous Laser Therapy Revenue (billion) Forecast, by Application 2020 & 2033
- Table 28: Argentina Intravenous Laser Therapy Volume (K) Forecast, by Application 2020 & 2033
- Table 29: Rest of South America Intravenous Laser Therapy Revenue (billion) Forecast, by Application 2020 & 2033
- Table 30: Rest of South America Intravenous Laser Therapy Volume (K) Forecast, by Application 2020 & 2033
- Table 31: Global Intravenous Laser Therapy Revenue billion Forecast, by Application 2020 & 2033
- Table 32: Global Intravenous Laser Therapy Volume K Forecast, by Application 2020 & 2033
- Table 33: Global Intravenous Laser Therapy Revenue billion Forecast, by Types 2020 & 2033
- Table 34: Global Intravenous Laser Therapy Volume K Forecast, by Types 2020 & 2033
- Table 35: Global Intravenous Laser Therapy Revenue billion Forecast, by Country 2020 & 2033
- Table 36: Global Intravenous Laser Therapy Volume K Forecast, by Country 2020 & 2033
- Table 37: United Kingdom Intravenous Laser Therapy Revenue (billion) Forecast, by Application 2020 & 2033
- Table 38: United Kingdom Intravenous Laser Therapy Volume (K) Forecast, by Application 2020 & 2033
- Table 39: Germany Intravenous Laser Therapy Revenue (billion) Forecast, by Application 2020 & 2033
- Table 40: Germany Intravenous Laser Therapy Volume (K) Forecast, by Application 2020 & 2033
- Table 41: France Intravenous Laser Therapy Revenue (billion) Forecast, by Application 2020 & 2033
- Table 42: France Intravenous Laser Therapy Volume (K) Forecast, by Application 2020 & 2033
- Table 43: Italy Intravenous Laser Therapy Revenue (billion) Forecast, by Application 2020 & 2033
- Table 44: Italy Intravenous Laser Therapy Volume (K) Forecast, by Application 2020 & 2033
- Table 45: Spain Intravenous Laser Therapy Revenue (billion) Forecast, by Application 2020 & 2033
- Table 46: Spain Intravenous Laser Therapy Volume (K) Forecast, by Application 2020 & 2033
- Table 47: Russia Intravenous Laser Therapy Revenue (billion) Forecast, by Application 2020 & 2033
- Table 48: Russia Intravenous Laser Therapy Volume (K) Forecast, by Application 2020 & 2033
- Table 49: Benelux Intravenous Laser Therapy Revenue (billion) Forecast, by Application 2020 & 2033
- Table 50: Benelux Intravenous Laser Therapy Volume (K) Forecast, by Application 2020 & 2033
- Table 51: Nordics Intravenous Laser Therapy Revenue (billion) Forecast, by Application 2020 & 2033
- Table 52: Nordics Intravenous Laser Therapy Volume (K) Forecast, by Application 2020 & 2033
- Table 53: Rest of Europe Intravenous Laser Therapy Revenue (billion) Forecast, by Application 2020 & 2033
- Table 54: Rest of Europe Intravenous Laser Therapy Volume (K) Forecast, by Application 2020 & 2033
- Table 55: Global Intravenous Laser Therapy Revenue billion Forecast, by Application 2020 & 2033
- Table 56: Global Intravenous Laser Therapy Volume K Forecast, by Application 2020 & 2033
- Table 57: Global Intravenous Laser Therapy Revenue billion Forecast, by Types 2020 & 2033
- Table 58: Global Intravenous Laser Therapy Volume K Forecast, by Types 2020 & 2033
- Table 59: Global Intravenous Laser Therapy Revenue billion Forecast, by Country 2020 & 2033
- Table 60: Global Intravenous Laser Therapy Volume K Forecast, by Country 2020 & 2033
- Table 61: Turkey Intravenous Laser Therapy Revenue (billion) Forecast, by Application 2020 & 2033
- Table 62: Turkey Intravenous Laser Therapy Volume (K) Forecast, by Application 2020 & 2033
- Table 63: Israel Intravenous Laser Therapy Revenue (billion) Forecast, by Application 2020 & 2033
- Table 64: Israel Intravenous Laser Therapy Volume (K) Forecast, by Application 2020 & 2033
- Table 65: GCC Intravenous Laser Therapy Revenue (billion) Forecast, by Application 2020 & 2033
- Table 66: GCC Intravenous Laser Therapy Volume (K) Forecast, by Application 2020 & 2033
- Table 67: North Africa Intravenous Laser Therapy Revenue (billion) Forecast, by Application 2020 & 2033
- Table 68: North Africa Intravenous Laser Therapy Volume (K) Forecast, by Application 2020 & 2033
- Table 69: South Africa Intravenous Laser Therapy Revenue (billion) Forecast, by Application 2020 & 2033
- Table 70: South Africa Intravenous Laser Therapy Volume (K) Forecast, by Application 2020 & 2033
- Table 71: Rest of Middle East & Africa Intravenous Laser Therapy Revenue (billion) Forecast, by Application 2020 & 2033
- Table 72: Rest of Middle East & Africa Intravenous Laser Therapy Volume (K) Forecast, by Application 2020 & 2033
- Table 73: Global Intravenous Laser Therapy Revenue billion Forecast, by Application 2020 & 2033
- Table 74: Global Intravenous Laser Therapy Volume K Forecast, by Application 2020 & 2033
- Table 75: Global Intravenous Laser Therapy Revenue billion Forecast, by Types 2020 & 2033
- Table 76: Global Intravenous Laser Therapy Volume K Forecast, by Types 2020 & 2033
- Table 77: Global Intravenous Laser Therapy Revenue billion Forecast, by Country 2020 & 2033
- Table 78: Global Intravenous Laser Therapy Volume K Forecast, by Country 2020 & 2033
- Table 79: China Intravenous Laser Therapy Revenue (billion) Forecast, by Application 2020 & 2033
- Table 80: China Intravenous Laser Therapy Volume (K) Forecast, by Application 2020 & 2033
- Table 81: India Intravenous Laser Therapy Revenue (billion) Forecast, by Application 2020 & 2033
- Table 82: India Intravenous Laser Therapy Volume (K) Forecast, by Application 2020 & 2033
- Table 83: Japan Intravenous Laser Therapy Revenue (billion) Forecast, by Application 2020 & 2033
- Table 84: Japan Intravenous Laser Therapy Volume (K) Forecast, by Application 2020 & 2033
- Table 85: South Korea Intravenous Laser Therapy Revenue (billion) Forecast, by Application 2020 & 2033
- Table 86: South Korea Intravenous Laser Therapy Volume (K) Forecast, by Application 2020 & 2033
- Table 87: ASEAN Intravenous Laser Therapy Revenue (billion) Forecast, by Application 2020 & 2033
- Table 88: ASEAN Intravenous Laser Therapy Volume (K) Forecast, by Application 2020 & 2033
- Table 89: Oceania Intravenous Laser Therapy Revenue (billion) Forecast, by Application 2020 & 2033
- Table 90: Oceania Intravenous Laser Therapy Volume (K) Forecast, by Application 2020 & 2033
- Table 91: Rest of Asia Pacific Intravenous Laser Therapy Revenue (billion) Forecast, by Application 2020 & 2033
- Table 92: Rest of Asia Pacific Intravenous Laser Therapy Volume (K) Forecast, by Application 2020 & 2033
Frequently Asked Questions
1. What is the projected Compound Annual Growth Rate (CAGR) of the Intravenous Laser Therapy?
The projected CAGR is approximately 7.9%.
2. Which companies are prominent players in the Intravenous Laser Therapy?
Key companies in the market include AngioDynamics, Syneron Medical, Dornier MedTech, Alma Lasers, Alna-Medical System, LSO Medical, Wontech, Intros Medical Laser, Energist Ltd..
3. What are the main segments of the Intravenous Laser Therapy?
The market segments include Application, Types.
4. Can you provide details about the market size?
The market size is estimated to be USD 0.5 billion as of 2022.
5. What are some drivers contributing to market growth?
N/A
6. What are the notable trends driving market growth?
N/A
7. Are there any restraints impacting market growth?
N/A
8. Can you provide examples of recent developments in the market?
N/A
9. What pricing options are available for accessing the report?
Pricing options include single-user, multi-user, and enterprise licenses priced at USD 3350.00, USD 5025.00, and USD 6700.00 respectively.
10. Is the market size provided in terms of value or volume?
The market size is provided in terms of value, measured in billion and volume, measured in K.
11. Are there any specific market keywords associated with the report?
Yes, the market keyword associated with the report is "Intravenous Laser Therapy," which aids in identifying and referencing the specific market segment covered.
12. How do I determine which pricing option suits my needs best?
The pricing options vary based on user requirements and access needs. Individual users may opt for single-user licenses, while businesses requiring broader access may choose multi-user or enterprise licenses for cost-effective access to the report.
13. Are there any additional resources or data provided in the Intravenous Laser Therapy report?
While the report offers comprehensive insights, it's advisable to review the specific contents or supplementary materials provided to ascertain if additional resources or data are available.
14. How can I stay updated on further developments or reports in the Intravenous Laser Therapy?
To stay informed about further developments, trends, and reports in the Intravenous Laser Therapy, consider subscribing to industry newsletters, following relevant companies and organizations, or regularly checking reputable industry news sources and publications.
Methodology
Step 1 - Identification of Relevant Samples Size from Population Database


Step 2 - Approaches for Defining Global Market Size (Value, Volume* & Price*)

Note*: In applicable scenarios
Step 3 - Data Sources
Primary Research
- Web Analytics
- Survey Reports
- Research Institute
- Latest Research Reports
- Opinion Leaders
Secondary Research
- Annual Reports
- White Paper
- Latest Press Release
- Industry Association
- Paid Database
- Investor Presentations

Step 4 - Data Triangulation
Involves using different sources of information in order to increase the validity of a study
These sources are likely to be stakeholders in a program - participants, other researchers, program staff, other community members, and so on.
Then we put all data in single framework & apply various statistical tools to find out the dynamic on the market.
During the analysis stage, feedback from the stakeholder groups would be compared to determine areas of agreement as well as areas of divergence