

Key Insights
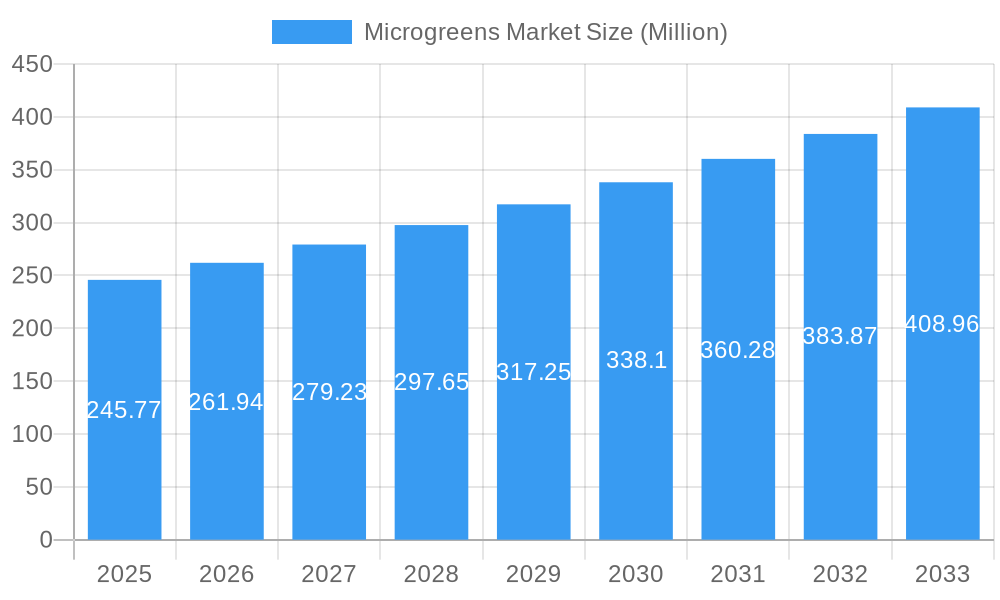
The global microgreens market, valued at $245.77 million in 2025, is projected to experience robust growth, exhibiting a Compound Annual Growth Rate (CAGR) of 6.40% from 2025 to 2033. This expansion is driven by several key factors. The rising consumer demand for healthy and nutritious food, coupled with the increasing awareness of the nutritional benefits of microgreens – high in vitamins, minerals, and antioxidants – is a significant driver. The growing popularity of plant-based diets and the increasing preference for locally sourced and sustainably produced food further contribute to market growth. Furthermore, the versatility of microgreens in culinary applications, from garnishes to main ingredients in salads and other dishes, broadens their market appeal. Innovation in farming techniques, such as indoor and vertical farming, is enabling year-round production and improving efficiency, contributing to market expansion. The expansion of the food service industry, including restaurants and cafes incorporating microgreens into their menus, also fuels market growth.
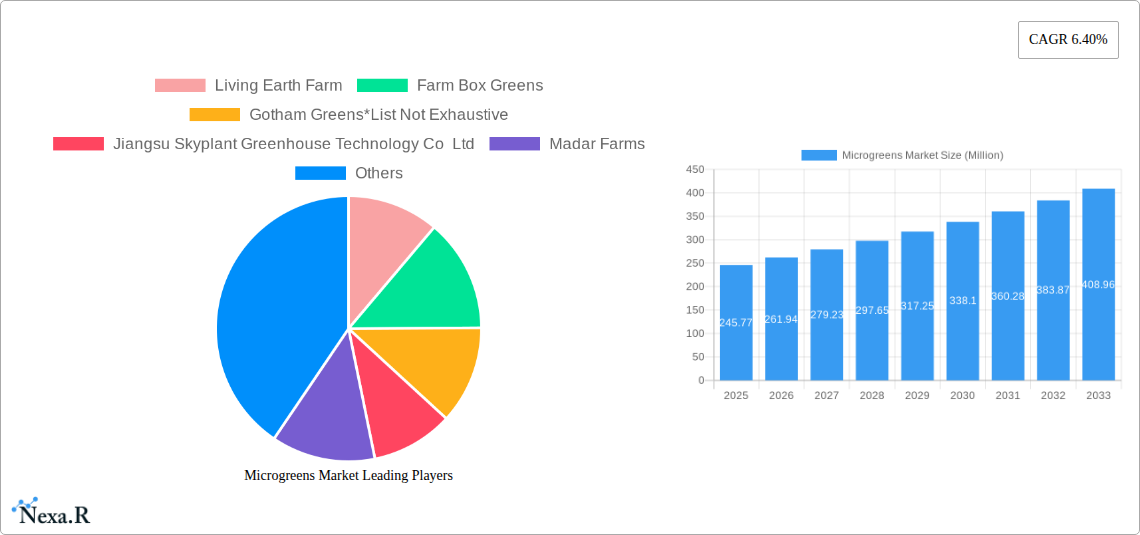
Microgreens Market Market Size (In Million)
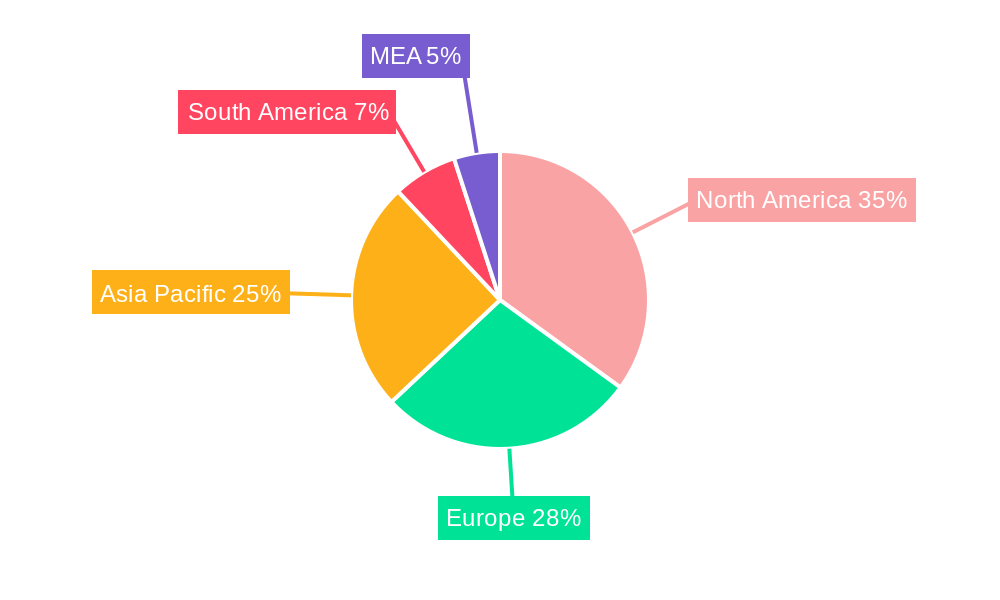
However, the market faces some challenges. The relatively high production costs compared to traditional leafy greens can restrict wider accessibility and affordability. Maintaining consistent quality and freshness throughout the supply chain is crucial, and inconsistent supply due to weather fluctuations or technical issues with controlled environment agriculture can present challenges. Competition from other nutritious food options and the need to educate consumers about the unique benefits of microgreens are also factors impacting market growth. Nevertheless, the market's strong growth trajectory indicates a bright future, particularly with ongoing innovations in cultivation techniques and increasing consumer awareness. The segmentation of the market by distribution channel (hypermarkets/supermarkets, restaurants, etc.), type (broccoli, lettuce, etc.), farming methods (indoor, vertical, etc.), and growth medium (peat moss, soil, etc.) offers opportunities for specialized players and targeted marketing strategies. The significant regional variations in market share will require tailored approaches to maximize market penetration.
Microgreens Market Company Market Share
Microgreens Market Report: A Comprehensive Analysis (2019-2033)
This comprehensive report provides a detailed analysis of the global microgreens market, encompassing market dynamics, growth trends, regional segmentation, product landscape, key players, and future outlook. The study period covers 2019-2033, with 2025 as the base and estimated year. The report offers invaluable insights for industry professionals, investors, and stakeholders seeking to understand and capitalize on the burgeoning opportunities within this dynamic sector. The market is segmented by distribution channel (Hypermarkets/Supermarkets, Restaurants, Other Distribution Channels), type (Broccoli, Lettuce and Chicory, Arugula, Basil, Fennel, Carrots, Sunflower, Radish, Peas, Other Types), farming method (Indoor Farming, Vertical Farming, Commercial Greenhouses, Other Farming), and growth medium (Peat Moss, Soil, Coconut Coir, Tissue Paper, Other Growth Mediums). Key players analyzed include Living Earth Farm, Farm Box Greens, Gotham Greens, Jiangsu Skyplant Greenhouse Technology Co Ltd, Madar Farms, Chef's Garden Inc, Shanghai Dehuan Industry Co Ltd, Metro Microgreens, Goodleaf Farms, and AeroFarms LLC.
Microgreens Market Dynamics & Structure
The microgreens market is characterized by moderate concentration, with a few large players alongside numerous smaller, regional producers. Technological innovation, particularly in vertical farming and hydroponics, is a key driver, improving yields and reducing production costs. Regulatory frameworks concerning food safety and sustainable agricultural practices significantly influence market operations. Competitive product substitutes include traditional leafy greens and sprouts, while the market experiences growing demand from health-conscious consumers. The market has seen a moderate level of M&A activity in recent years, driven by expansion strategies and technological integration. xx% of the market is controlled by the top 5 players in 2025. The number of M&A deals in the past five years has been approximately xx.
- Market Concentration: Moderate, with a mix of large and small players.
- Technological Innovation: Key driver, focusing on vertical farming and hydroponics.
- Regulatory Landscape: Influences production practices and food safety standards.
- Competitive Substitutes: Traditional leafy greens and sprouts.
- End-User Demographics: Health-conscious consumers and food service establishments.
- M&A Activity: Moderate, driven by expansion and technological integration.
Microgreens Market Growth Trends & Insights
The global microgreens market experienced robust growth during the historical period (2019-2024), with a CAGR of xx%. This growth is attributed to increasing consumer awareness of the nutritional benefits of microgreens, coupled with rising demand from the food service industry. Technological advancements, such as vertical farming and improved hydroponic systems, are increasing production efficiency and reducing costs. Consumer preference shifts towards healthier and more convenient food options further fuel market expansion. The market size is projected to reach xx Million by 2025 and xx Million by 2033, exhibiting a CAGR of xx% during the forecast period (2025-2033). Market penetration in key regions is expected to increase significantly as consumer awareness grows. The increasing adoption of sustainable farming practices is expected to propel market growth.
Dominant Regions, Countries, or Segments in Microgreens Market
North America currently dominates the microgreens market, driven by high consumer demand for healthy foods and strong growth in the food service industry. Within North America, the United States holds the largest market share. Europe is also a significant market, with increasing adoption of sustainable agricultural practices. The Hypermarkets/Supermarkets distribution channel holds the largest market share, reflecting the widespread availability of microgreens in major retail outlets. The Broccoli, Lettuce and Chicory segment accounts for xx% of the market, representing the most popular microgreen types. Indoor farming is the most dominant farming method due to its efficiency and controlled environment. Peat Moss is the most commonly used growth medium.
- Key Regional Drivers: High consumer demand (North America), sustainable agriculture trends (Europe).
- Leading Distribution Channel: Hypermarkets/Supermarkets.
- Dominant Microgreen Type: Broccoli, Lettuce and Chicory.
- Preferred Farming Method: Indoor Farming.
- Most Used Growth Medium: Peat Moss.
Microgreens Market Product Landscape
Microgreen product innovation focuses on enhancing nutritional value, extending shelf life, and developing new flavor profiles. Technological advancements are leading to higher yields and improved consistency in product quality. Unique selling propositions include organic certification, specific nutritional benefits, and convenient packaging options. The market witnesses continuous development of new microgreen varieties, catering to specific consumer preferences and culinary applications.
Key Drivers, Barriers & Challenges in Microgreens Market
Key Drivers:
- Growing consumer awareness of health benefits.
- Increased demand from food service industry.
- Technological advancements in farming techniques.
- Growing adoption of sustainable agricultural practices.
Key Challenges:
- Supply chain inefficiencies and logistics.
- Regulatory hurdles and food safety standards.
- Intense competition from established players and new entrants. The presence of xx competitors in 2025 creates pressure on market share and pricing.
Emerging Opportunities in Microgreens Market
- Expanding into untapped markets in developing countries.
- Developing new microgreen varieties with unique flavor profiles.
- Leveraging technology for personalized microgreen production.
- Focusing on sustainable and ethical sourcing.
Growth Accelerators in the Microgreens Market Industry
Strategic partnerships, technological breakthroughs in vertical farming and hydroponics, and expansion into new markets are key drivers for long-term growth. The increasing adoption of automation and data-driven insights enhances production efficiency and reduces operational costs. Developing strong supply chains and building brand recognition are crucial strategies for sustained market success.
Key Players Shaping the Microgreens Market Market
- Living Earth Farm
- Farm Box Greens
- Gotham Greens
- Jiangsu Skyplant Greenhouse Technology Co Ltd
- Madar Farms
- Chef's Garden Inc
- Shanghai Dehuan Industry Co Ltd
- Metro Microgreens
- Goodleaf Farms
- AeroFarms LLC
Notable Milestones in Microgreens Market Sector
- August 2022: AeroFarms expanded its retail presence to 160 Fresh Market stores.
- February 2023: Good Leaf Farm partnered with Unfold to introduce premium microgreens.
- May 2023: AeroFarms launched a nationwide expansion through Amazon Fresh.
In-Depth Microgreens Market Market Outlook
The microgreens market presents significant long-term growth potential, driven by increasing health awareness and technological advancements. Strategic partnerships, expansion into new markets, and continuous product innovation will be key to capturing market share. The market is poised for robust expansion, with considerable opportunities for both established and new players.
Microgreens Market Segmentation
- 1. Production Analysis
- 2. Consumption Analysis
- 3. Import Market Analysis (Value & Volume)
- 4. Export Market Analysis (Value & Volume)
- 5. Price Trend Analysis
Microgreens Market Segmentation By Geography
-
1. North America
- 1.1. United States
- 1.2. Canada
- 1.3. Mexico
-
2. South America
- 2.1. Brazil
- 2.2. Argentina
- 2.3. Rest of South America
-
3. Europe
- 3.1. United Kingdom
- 3.2. Germany
- 3.3. France
- 3.4. Italy
- 3.5. Spain
- 3.6. Russia
- 3.7. Benelux
- 3.8. Nordics
- 3.9. Rest of Europe
-
4. Middle East & Africa
- 4.1. Turkey
- 4.2. Israel
- 4.3. GCC
- 4.4. North Africa
- 4.5. South Africa
- 4.6. Rest of Middle East & Africa
-
5. Asia Pacific
- 5.1. China
- 5.2. India
- 5.3. Japan
- 5.4. South Korea
- 5.5. ASEAN
- 5.6. Oceania
- 5.7. Rest of Asia Pacific
Microgreens Market Regional Market Share
Geographic Coverage of Microgreens Market
Microgreens Market REPORT HIGHLIGHTS
| Aspects | Details |
|---|---|
| Study Period | 2020-2034 |
| Base Year | 2025 |
| Estimated Year | 2026 |
| Forecast Period | 2026-2034 |
| Historical Period | 2020-2025 |
| Growth Rate | CAGR of 6.40% from 2020-2034 |
| Segmentation |
|
Table of Contents
- 1. Introduction
- 1.1. Research Scope
- 1.2. Market Segmentation
- 1.3. Research Methodology
- 1.4. Definitions and Assumptions
- 2. Executive Summary
- 2.1. Introduction
- 3. Market Dynamics
- 3.1. Introduction
- 3.2. Market Drivers
- 3.2.1. Seed Treatment As A Solution To Enhance Yield; Growing Awareness For Seed Treatment Among The Farmers; Rising Trend Of Organic Farming
- 3.3. Market Restrains
- 3.3.1. Limitations Across Farm-Level Seed Treatment; Rising Environmental Concerns
- 3.4. Market Trends
- 3.4.1. Rise in Adoption of Indoor Farming
- 4. Market Factor Analysis
- 4.1. Porters Five Forces
- 4.2. Supply/Value Chain
- 4.3. PESTEL analysis
- 4.4. Market Entropy
- 4.5. Patent/Trademark Analysis
- 5. Global Microgreens Market Analysis, Insights and Forecast, 2020-2032
- 5.1. Market Analysis, Insights and Forecast - by Production Analysis
- 5.2. Market Analysis, Insights and Forecast - by Consumption Analysis
- 5.3. Market Analysis, Insights and Forecast - by Import Market Analysis (Value & Volume)
- 5.4. Market Analysis, Insights and Forecast - by Export Market Analysis (Value & Volume)
- 5.5. Market Analysis, Insights and Forecast - by Price Trend Analysis
- 5.6. Market Analysis, Insights and Forecast - by Region
- 5.6.1. North America
- 5.6.2. South America
- 5.6.3. Europe
- 5.6.4. Middle East & Africa
- 5.6.5. Asia Pacific
- 5.1. Market Analysis, Insights and Forecast - by Production Analysis
- 6. North America Microgreens Market Analysis, Insights and Forecast, 2020-2032
- 6.1. Market Analysis, Insights and Forecast - by Production Analysis
- 6.2. Market Analysis, Insights and Forecast - by Consumption Analysis
- 6.3. Market Analysis, Insights and Forecast - by Import Market Analysis (Value & Volume)
- 6.4. Market Analysis, Insights and Forecast - by Export Market Analysis (Value & Volume)
- 6.5. Market Analysis, Insights and Forecast - by Price Trend Analysis
- 6.1. Market Analysis, Insights and Forecast - by Production Analysis
- 7. South America Microgreens Market Analysis, Insights and Forecast, 2020-2032
- 7.1. Market Analysis, Insights and Forecast - by Production Analysis
- 7.2. Market Analysis, Insights and Forecast - by Consumption Analysis
- 7.3. Market Analysis, Insights and Forecast - by Import Market Analysis (Value & Volume)
- 7.4. Market Analysis, Insights and Forecast - by Export Market Analysis (Value & Volume)
- 7.5. Market Analysis, Insights and Forecast - by Price Trend Analysis
- 7.1. Market Analysis, Insights and Forecast - by Production Analysis
- 8. Europe Microgreens Market Analysis, Insights and Forecast, 2020-2032
- 8.1. Market Analysis, Insights and Forecast - by Production Analysis
- 8.2. Market Analysis, Insights and Forecast - by Consumption Analysis
- 8.3. Market Analysis, Insights and Forecast - by Import Market Analysis (Value & Volume)
- 8.4. Market Analysis, Insights and Forecast - by Export Market Analysis (Value & Volume)
- 8.5. Market Analysis, Insights and Forecast - by Price Trend Analysis
- 8.1. Market Analysis, Insights and Forecast - by Production Analysis
- 9. Middle East & Africa Microgreens Market Analysis, Insights and Forecast, 2020-2032
- 9.1. Market Analysis, Insights and Forecast - by Production Analysis
- 9.2. Market Analysis, Insights and Forecast - by Consumption Analysis
- 9.3. Market Analysis, Insights and Forecast - by Import Market Analysis (Value & Volume)
- 9.4. Market Analysis, Insights and Forecast - by Export Market Analysis (Value & Volume)
- 9.5. Market Analysis, Insights and Forecast - by Price Trend Analysis
- 9.1. Market Analysis, Insights and Forecast - by Production Analysis
- 10. Asia Pacific Microgreens Market Analysis, Insights and Forecast, 2020-2032
- 10.1. Market Analysis, Insights and Forecast - by Production Analysis
- 10.2. Market Analysis, Insights and Forecast - by Consumption Analysis
- 10.3. Market Analysis, Insights and Forecast - by Import Market Analysis (Value & Volume)
- 10.4. Market Analysis, Insights and Forecast - by Export Market Analysis (Value & Volume)
- 10.5. Market Analysis, Insights and Forecast - by Price Trend Analysis
- 10.1. Market Analysis, Insights and Forecast - by Production Analysis
- 11. Competitive Analysis
- 11.1. Global Market Share Analysis 2025
- 11.2. Company Profiles
- 11.2.1 Living Earth Farm
- 11.2.1.1. Overview
- 11.2.1.2. Products
- 11.2.1.3. SWOT Analysis
- 11.2.1.4. Recent Developments
- 11.2.1.5. Financials (Based on Availability)
- 11.2.2 Farm Box Greens
- 11.2.2.1. Overview
- 11.2.2.2. Products
- 11.2.2.3. SWOT Analysis
- 11.2.2.4. Recent Developments
- 11.2.2.5. Financials (Based on Availability)
- 11.2.3 Gotham Greens*List Not Exhaustive
- 11.2.3.1. Overview
- 11.2.3.2. Products
- 11.2.3.3. SWOT Analysis
- 11.2.3.4. Recent Developments
- 11.2.3.5. Financials (Based on Availability)
- 11.2.4 Jiangsu Skyplant Greenhouse Technology Co Ltd
- 11.2.4.1. Overview
- 11.2.4.2. Products
- 11.2.4.3. SWOT Analysis
- 11.2.4.4. Recent Developments
- 11.2.4.5. Financials (Based on Availability)
- 11.2.5 Madar Farms
- 11.2.5.1. Overview
- 11.2.5.2. Products
- 11.2.5.3. SWOT Analysis
- 11.2.5.4. Recent Developments
- 11.2.5.5. Financials (Based on Availability)
- 11.2.6 Chef's Garden Inc
- 11.2.6.1. Overview
- 11.2.6.2. Products
- 11.2.6.3. SWOT Analysis
- 11.2.6.4. Recent Developments
- 11.2.6.5. Financials (Based on Availability)
- 11.2.7 Shanghai Dehuan Industry Co Ltd
- 11.2.7.1. Overview
- 11.2.7.2. Products
- 11.2.7.3. SWOT Analysis
- 11.2.7.4. Recent Developments
- 11.2.7.5. Financials (Based on Availability)
- 11.2.8 Metro Microgreens
- 11.2.8.1. Overview
- 11.2.8.2. Products
- 11.2.8.3. SWOT Analysis
- 11.2.8.4. Recent Developments
- 11.2.8.5. Financials (Based on Availability)
- 11.2.9 Goodleaf Farms
- 11.2.9.1. Overview
- 11.2.9.2. Products
- 11.2.9.3. SWOT Analysis
- 11.2.9.4. Recent Developments
- 11.2.9.5. Financials (Based on Availability)
- 11.2.10 AeroFarms LLC
- 11.2.10.1. Overview
- 11.2.10.2. Products
- 11.2.10.3. SWOT Analysis
- 11.2.10.4. Recent Developments
- 11.2.10.5. Financials (Based on Availability)
- 11.2.1 Living Earth Farm
List of Figures
- Figure 1: Global Microgreens Market Revenue Breakdown (Million, %) by Region 2025 & 2033
- Figure 2: North America Microgreens Market Revenue (Million), by Production Analysis 2025 & 2033
- Figure 3: North America Microgreens Market Revenue Share (%), by Production Analysis 2025 & 2033
- Figure 4: North America Microgreens Market Revenue (Million), by Consumption Analysis 2025 & 2033
- Figure 5: North America Microgreens Market Revenue Share (%), by Consumption Analysis 2025 & 2033
- Figure 6: North America Microgreens Market Revenue (Million), by Import Market Analysis (Value & Volume) 2025 & 2033
- Figure 7: North America Microgreens Market Revenue Share (%), by Import Market Analysis (Value & Volume) 2025 & 2033
- Figure 8: North America Microgreens Market Revenue (Million), by Export Market Analysis (Value & Volume) 2025 & 2033
- Figure 9: North America Microgreens Market Revenue Share (%), by Export Market Analysis (Value & Volume) 2025 & 2033
- Figure 10: North America Microgreens Market Revenue (Million), by Price Trend Analysis 2025 & 2033
- Figure 11: North America Microgreens Market Revenue Share (%), by Price Trend Analysis 2025 & 2033
- Figure 12: North America Microgreens Market Revenue (Million), by Country 2025 & 2033
- Figure 13: North America Microgreens Market Revenue Share (%), by Country 2025 & 2033
- Figure 14: South America Microgreens Market Revenue (Million), by Production Analysis 2025 & 2033
- Figure 15: South America Microgreens Market Revenue Share (%), by Production Analysis 2025 & 2033
- Figure 16: South America Microgreens Market Revenue (Million), by Consumption Analysis 2025 & 2033
- Figure 17: South America Microgreens Market Revenue Share (%), by Consumption Analysis 2025 & 2033
- Figure 18: South America Microgreens Market Revenue (Million), by Import Market Analysis (Value & Volume) 2025 & 2033
- Figure 19: South America Microgreens Market Revenue Share (%), by Import Market Analysis (Value & Volume) 2025 & 2033
- Figure 20: South America Microgreens Market Revenue (Million), by Export Market Analysis (Value & Volume) 2025 & 2033
- Figure 21: South America Microgreens Market Revenue Share (%), by Export Market Analysis (Value & Volume) 2025 & 2033
- Figure 22: South America Microgreens Market Revenue (Million), by Price Trend Analysis 2025 & 2033
- Figure 23: South America Microgreens Market Revenue Share (%), by Price Trend Analysis 2025 & 2033
- Figure 24: South America Microgreens Market Revenue (Million), by Country 2025 & 2033
- Figure 25: South America Microgreens Market Revenue Share (%), by Country 2025 & 2033
- Figure 26: Europe Microgreens Market Revenue (Million), by Production Analysis 2025 & 2033
- Figure 27: Europe Microgreens Market Revenue Share (%), by Production Analysis 2025 & 2033
- Figure 28: Europe Microgreens Market Revenue (Million), by Consumption Analysis 2025 & 2033
- Figure 29: Europe Microgreens Market Revenue Share (%), by Consumption Analysis 2025 & 2033
- Figure 30: Europe Microgreens Market Revenue (Million), by Import Market Analysis (Value & Volume) 2025 & 2033
- Figure 31: Europe Microgreens Market Revenue Share (%), by Import Market Analysis (Value & Volume) 2025 & 2033
- Figure 32: Europe Microgreens Market Revenue (Million), by Export Market Analysis (Value & Volume) 2025 & 2033
- Figure 33: Europe Microgreens Market Revenue Share (%), by Export Market Analysis (Value & Volume) 2025 & 2033
- Figure 34: Europe Microgreens Market Revenue (Million), by Price Trend Analysis 2025 & 2033
- Figure 35: Europe Microgreens Market Revenue Share (%), by Price Trend Analysis 2025 & 2033
- Figure 36: Europe Microgreens Market Revenue (Million), by Country 2025 & 2033
- Figure 37: Europe Microgreens Market Revenue Share (%), by Country 2025 & 2033
- Figure 38: Middle East & Africa Microgreens Market Revenue (Million), by Production Analysis 2025 & 2033
- Figure 39: Middle East & Africa Microgreens Market Revenue Share (%), by Production Analysis 2025 & 2033
- Figure 40: Middle East & Africa Microgreens Market Revenue (Million), by Consumption Analysis 2025 & 2033
- Figure 41: Middle East & Africa Microgreens Market Revenue Share (%), by Consumption Analysis 2025 & 2033
- Figure 42: Middle East & Africa Microgreens Market Revenue (Million), by Import Market Analysis (Value & Volume) 2025 & 2033
- Figure 43: Middle East & Africa Microgreens Market Revenue Share (%), by Import Market Analysis (Value & Volume) 2025 & 2033
- Figure 44: Middle East & Africa Microgreens Market Revenue (Million), by Export Market Analysis (Value & Volume) 2025 & 2033
- Figure 45: Middle East & Africa Microgreens Market Revenue Share (%), by Export Market Analysis (Value & Volume) 2025 & 2033
- Figure 46: Middle East & Africa Microgreens Market Revenue (Million), by Price Trend Analysis 2025 & 2033
- Figure 47: Middle East & Africa Microgreens Market Revenue Share (%), by Price Trend Analysis 2025 & 2033
- Figure 48: Middle East & Africa Microgreens Market Revenue (Million), by Country 2025 & 2033
- Figure 49: Middle East & Africa Microgreens Market Revenue Share (%), by Country 2025 & 2033
- Figure 50: Asia Pacific Microgreens Market Revenue (Million), by Production Analysis 2025 & 2033
- Figure 51: Asia Pacific Microgreens Market Revenue Share (%), by Production Analysis 2025 & 2033
- Figure 52: Asia Pacific Microgreens Market Revenue (Million), by Consumption Analysis 2025 & 2033
- Figure 53: Asia Pacific Microgreens Market Revenue Share (%), by Consumption Analysis 2025 & 2033
- Figure 54: Asia Pacific Microgreens Market Revenue (Million), by Import Market Analysis (Value & Volume) 2025 & 2033
- Figure 55: Asia Pacific Microgreens Market Revenue Share (%), by Import Market Analysis (Value & Volume) 2025 & 2033
- Figure 56: Asia Pacific Microgreens Market Revenue (Million), by Export Market Analysis (Value & Volume) 2025 & 2033
- Figure 57: Asia Pacific Microgreens Market Revenue Share (%), by Export Market Analysis (Value & Volume) 2025 & 2033
- Figure 58: Asia Pacific Microgreens Market Revenue (Million), by Price Trend Analysis 2025 & 2033
- Figure 59: Asia Pacific Microgreens Market Revenue Share (%), by Price Trend Analysis 2025 & 2033
- Figure 60: Asia Pacific Microgreens Market Revenue (Million), by Country 2025 & 2033
- Figure 61: Asia Pacific Microgreens Market Revenue Share (%), by Country 2025 & 2033
List of Tables
- Table 1: Global Microgreens Market Revenue Million Forecast, by Production Analysis 2020 & 2033
- Table 2: Global Microgreens Market Revenue Million Forecast, by Consumption Analysis 2020 & 2033
- Table 3: Global Microgreens Market Revenue Million Forecast, by Import Market Analysis (Value & Volume) 2020 & 2033
- Table 4: Global Microgreens Market Revenue Million Forecast, by Export Market Analysis (Value & Volume) 2020 & 2033
- Table 5: Global Microgreens Market Revenue Million Forecast, by Price Trend Analysis 2020 & 2033
- Table 6: Global Microgreens Market Revenue Million Forecast, by Region 2020 & 2033
- Table 7: Global Microgreens Market Revenue Million Forecast, by Production Analysis 2020 & 2033
- Table 8: Global Microgreens Market Revenue Million Forecast, by Consumption Analysis 2020 & 2033
- Table 9: Global Microgreens Market Revenue Million Forecast, by Import Market Analysis (Value & Volume) 2020 & 2033
- Table 10: Global Microgreens Market Revenue Million Forecast, by Export Market Analysis (Value & Volume) 2020 & 2033
- Table 11: Global Microgreens Market Revenue Million Forecast, by Price Trend Analysis 2020 & 2033
- Table 12: Global Microgreens Market Revenue Million Forecast, by Country 2020 & 2033
- Table 13: United States Microgreens Market Revenue (Million) Forecast, by Application 2020 & 2033
- Table 14: Canada Microgreens Market Revenue (Million) Forecast, by Application 2020 & 2033
- Table 15: Mexico Microgreens Market Revenue (Million) Forecast, by Application 2020 & 2033
- Table 16: Global Microgreens Market Revenue Million Forecast, by Production Analysis 2020 & 2033
- Table 17: Global Microgreens Market Revenue Million Forecast, by Consumption Analysis 2020 & 2033
- Table 18: Global Microgreens Market Revenue Million Forecast, by Import Market Analysis (Value & Volume) 2020 & 2033
- Table 19: Global Microgreens Market Revenue Million Forecast, by Export Market Analysis (Value & Volume) 2020 & 2033
- Table 20: Global Microgreens Market Revenue Million Forecast, by Price Trend Analysis 2020 & 2033
- Table 21: Global Microgreens Market Revenue Million Forecast, by Country 2020 & 2033
- Table 22: Brazil Microgreens Market Revenue (Million) Forecast, by Application 2020 & 2033
- Table 23: Argentina Microgreens Market Revenue (Million) Forecast, by Application 2020 & 2033
- Table 24: Rest of South America Microgreens Market Revenue (Million) Forecast, by Application 2020 & 2033
- Table 25: Global Microgreens Market Revenue Million Forecast, by Production Analysis 2020 & 2033
- Table 26: Global Microgreens Market Revenue Million Forecast, by Consumption Analysis 2020 & 2033
- Table 27: Global Microgreens Market Revenue Million Forecast, by Import Market Analysis (Value & Volume) 2020 & 2033
- Table 28: Global Microgreens Market Revenue Million Forecast, by Export Market Analysis (Value & Volume) 2020 & 2033
- Table 29: Global Microgreens Market Revenue Million Forecast, by Price Trend Analysis 2020 & 2033
- Table 30: Global Microgreens Market Revenue Million Forecast, by Country 2020 & 2033
- Table 31: United Kingdom Microgreens Market Revenue (Million) Forecast, by Application 2020 & 2033
- Table 32: Germany Microgreens Market Revenue (Million) Forecast, by Application 2020 & 2033
- Table 33: France Microgreens Market Revenue (Million) Forecast, by Application 2020 & 2033
- Table 34: Italy Microgreens Market Revenue (Million) Forecast, by Application 2020 & 2033
- Table 35: Spain Microgreens Market Revenue (Million) Forecast, by Application 2020 & 2033
- Table 36: Russia Microgreens Market Revenue (Million) Forecast, by Application 2020 & 2033
- Table 37: Benelux Microgreens Market Revenue (Million) Forecast, by Application 2020 & 2033
- Table 38: Nordics Microgreens Market Revenue (Million) Forecast, by Application 2020 & 2033
- Table 39: Rest of Europe Microgreens Market Revenue (Million) Forecast, by Application 2020 & 2033
- Table 40: Global Microgreens Market Revenue Million Forecast, by Production Analysis 2020 & 2033
- Table 41: Global Microgreens Market Revenue Million Forecast, by Consumption Analysis 2020 & 2033
- Table 42: Global Microgreens Market Revenue Million Forecast, by Import Market Analysis (Value & Volume) 2020 & 2033
- Table 43: Global Microgreens Market Revenue Million Forecast, by Export Market Analysis (Value & Volume) 2020 & 2033
- Table 44: Global Microgreens Market Revenue Million Forecast, by Price Trend Analysis 2020 & 2033
- Table 45: Global Microgreens Market Revenue Million Forecast, by Country 2020 & 2033
- Table 46: Turkey Microgreens Market Revenue (Million) Forecast, by Application 2020 & 2033
- Table 47: Israel Microgreens Market Revenue (Million) Forecast, by Application 2020 & 2033
- Table 48: GCC Microgreens Market Revenue (Million) Forecast, by Application 2020 & 2033
- Table 49: North Africa Microgreens Market Revenue (Million) Forecast, by Application 2020 & 2033
- Table 50: South Africa Microgreens Market Revenue (Million) Forecast, by Application 2020 & 2033
- Table 51: Rest of Middle East & Africa Microgreens Market Revenue (Million) Forecast, by Application 2020 & 2033
- Table 52: Global Microgreens Market Revenue Million Forecast, by Production Analysis 2020 & 2033
- Table 53: Global Microgreens Market Revenue Million Forecast, by Consumption Analysis 2020 & 2033
- Table 54: Global Microgreens Market Revenue Million Forecast, by Import Market Analysis (Value & Volume) 2020 & 2033
- Table 55: Global Microgreens Market Revenue Million Forecast, by Export Market Analysis (Value & Volume) 2020 & 2033
- Table 56: Global Microgreens Market Revenue Million Forecast, by Price Trend Analysis 2020 & 2033
- Table 57: Global Microgreens Market Revenue Million Forecast, by Country 2020 & 2033
- Table 58: China Microgreens Market Revenue (Million) Forecast, by Application 2020 & 2033
- Table 59: India Microgreens Market Revenue (Million) Forecast, by Application 2020 & 2033
- Table 60: Japan Microgreens Market Revenue (Million) Forecast, by Application 2020 & 2033
- Table 61: South Korea Microgreens Market Revenue (Million) Forecast, by Application 2020 & 2033
- Table 62: ASEAN Microgreens Market Revenue (Million) Forecast, by Application 2020 & 2033
- Table 63: Oceania Microgreens Market Revenue (Million) Forecast, by Application 2020 & 2033
- Table 64: Rest of Asia Pacific Microgreens Market Revenue (Million) Forecast, by Application 2020 & 2033
Frequently Asked Questions
1. What is the projected Compound Annual Growth Rate (CAGR) of the Microgreens Market?
The projected CAGR is approximately 6.40%.
2. Which companies are prominent players in the Microgreens Market?
Key companies in the market include Living Earth Farm, Farm Box Greens, Gotham Greens*List Not Exhaustive, Jiangsu Skyplant Greenhouse Technology Co Ltd, Madar Farms, Chef's Garden Inc, Shanghai Dehuan Industry Co Ltd, Metro Microgreens, Goodleaf Farms, AeroFarms LLC.
3. What are the main segments of the Microgreens Market?
The market segments include Production Analysis, Consumption Analysis, Import Market Analysis (Value & Volume), Export Market Analysis (Value & Volume), Price Trend Analysis.
4. Can you provide details about the market size?
The market size is estimated to be USD 245.77 Million as of 2022.
5. What are some drivers contributing to market growth?
Seed Treatment As A Solution To Enhance Yield; Growing Awareness For Seed Treatment Among The Farmers; Rising Trend Of Organic Farming.
6. What are the notable trends driving market growth?
Rise in Adoption of Indoor Farming.
7. Are there any restraints impacting market growth?
Limitations Across Farm-Level Seed Treatment; Rising Environmental Concerns.
8. Can you provide examples of recent developments in the market?
May 2023: AeroFarms, a Certified B Corporation and a prominent figure in indoor vertical farming took a significant step forward by launching a nationwide expansion through a collaboration with Amazon Fresh. This partnership aims to enhance the high-tech consumer grocery experience. Building on their prior success with Whole Foods Market in 2022, AeroFarms became the first indoor leafy greens grower to be included in Whole Foods Market's Global Planogram, setting an industry precedent.
9. What pricing options are available for accessing the report?
Pricing options include single-user, multi-user, and enterprise licenses priced at USD 4750, USD 5250, and USD 8750 respectively.
10. Is the market size provided in terms of value or volume?
The market size is provided in terms of value, measured in Million.
11. Are there any specific market keywords associated with the report?
Yes, the market keyword associated with the report is "Microgreens Market," which aids in identifying and referencing the specific market segment covered.
12. How do I determine which pricing option suits my needs best?
The pricing options vary based on user requirements and access needs. Individual users may opt for single-user licenses, while businesses requiring broader access may choose multi-user or enterprise licenses for cost-effective access to the report.
13. Are there any additional resources or data provided in the Microgreens Market report?
While the report offers comprehensive insights, it's advisable to review the specific contents or supplementary materials provided to ascertain if additional resources or data are available.
14. How can I stay updated on further developments or reports in the Microgreens Market?
To stay informed about further developments, trends, and reports in the Microgreens Market, consider subscribing to industry newsletters, following relevant companies and organizations, or regularly checking reputable industry news sources and publications.
Methodology
Step 1 - Identification of Relevant Samples Size from Population Database


Step 2 - Approaches for Defining Global Market Size (Value, Volume* & Price*)

Note*: In applicable scenarios
Step 3 - Data Sources
Primary Research
- Web Analytics
- Survey Reports
- Research Institute
- Latest Research Reports
- Opinion Leaders
Secondary Research
- Annual Reports
- White Paper
- Latest Press Release
- Industry Association
- Paid Database
- Investor Presentations

Step 4 - Data Triangulation
Involves using different sources of information in order to increase the validity of a study
These sources are likely to be stakeholders in a program - participants, other researchers, program staff, other community members, and so on.
Then we put all data in single framework & apply various statistical tools to find out the dynamic on the market.
During the analysis stage, feedback from the stakeholder groups would be compared to determine areas of agreement as well as areas of divergence