

Key Insights
The global nematicides market, projected at 289.36 million in 2025, is poised for significant expansion with a Compound Annual Growth Rate (CAGR) of 4.2% from 2025 to 2033. Key growth drivers include escalating global food demand, necessitating increased crop yields and effective nematode control for optimal agricultural productivity. The rising incidence of nematode infestations across diverse crops, such as fruits, vegetables, grains, and pulses, is further stimulating demand for efficacious nematicide solutions. The market is also benefiting from the development of innovative, environmentally conscious nematicides, including bio-nematicides, aligning with global trends toward sustainable agriculture and reduced chemical pesticide reliance. However, stringent regulatory frameworks and growing consumer concern regarding the health and environmental impacts of chemical nematicides present considerable market restraints.
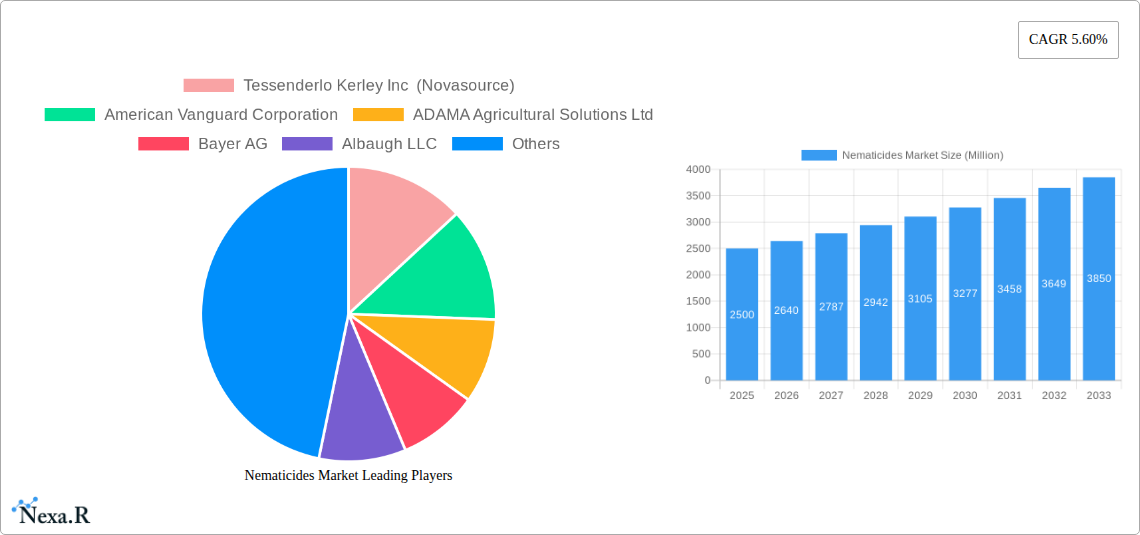
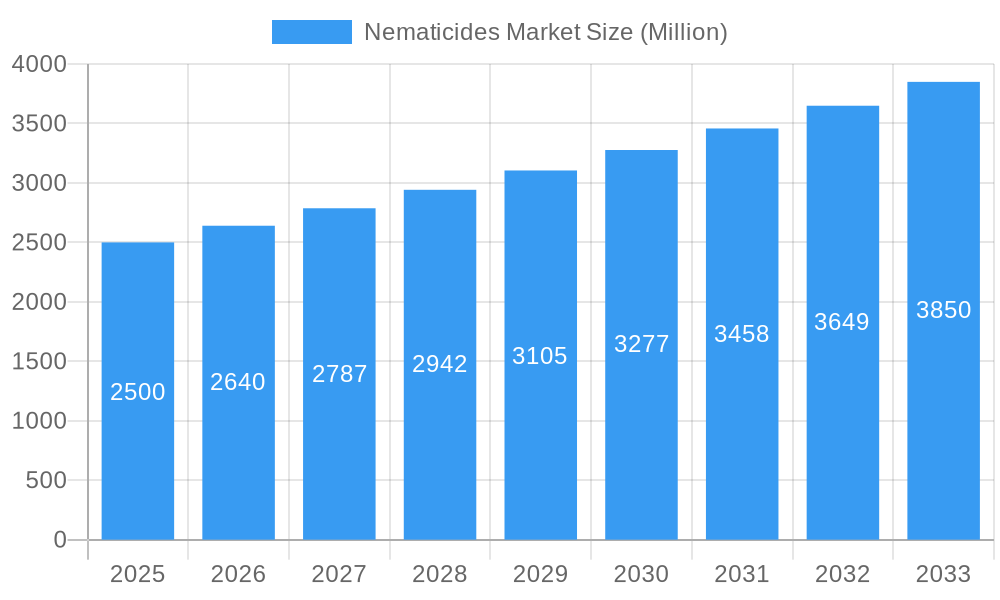
Nematicides Market Market Size (In Million)
Market segmentation highlights significant diversity. Soil treatment applications dominate due to their proven efficacy against soil-borne nematodes, with chemigation, foliar, and seed treatments also playing crucial roles. Commercial crops, fruits and vegetables, and grains & cereals represent the primary consumers of nematicides, attributed to their high economic value and susceptibility to nematode damage. Leading market participants, including Tessenderlo Kerley Inc (Novasource), American Vanguard Corporation, ADAMA Agricultural Solutions Ltd, Bayer AG, Albaugh LLC, Syngenta Group, UPL Limited, Corteva Agriscience, and Vive Crop Protection, are actively engaged in developing and marketing advanced nematicide solutions, fostering market competition and innovation. The historical period (2019-2024) likely witnessed similar, though potentially lower, growth influenced by agricultural price fluctuations and regional regulatory variations. The forecast period (2025-2033) anticipates sustained growth driven by the aforementioned factors.
Nematicides Market Company Market Share
Nematicides Market: A Comprehensive Report (2019-2033)
This comprehensive report provides an in-depth analysis of the Nematicides Market, encompassing market dynamics, growth trends, regional dominance, product landscape, key players, and future outlook. The study period spans from 2019 to 2033, with 2025 serving as the base and estimated year. The report segments the market by application mode (Chemigation, Foliar, Fumigation, Seed Treatment, Soil Treatment) and crop type (Commercial Crops, Fruits & Vegetables, Grains & Cereals, Pulses & Oilseeds, Turf & Ornamental), offering granular insights into this crucial agricultural input market. The market is projected to reach xx Million units by 2033.
Nematicides Market Dynamics & Structure
The Nematicides market is characterized by moderate concentration, with key players like Bayer AG, Syngenta Group, and Corteva Agriscience holding significant market share. Technological innovation, driven by the need for more effective and sustainable nematicide solutions, is a key growth driver. Stringent regulatory frameworks governing pesticide use influence market dynamics, alongside the emergence of bio-nematicides as competitive substitutes. The market is also influenced by evolving end-user demographics, with a shift towards larger commercial farms adopting advanced application methods. Mergers and acquisitions (M&A) activity has been significant, with xx deals recorded between 2019 and 2024, indicating consolidation trends.
- Market Concentration: Moderately concentrated, with top 5 players holding approximately xx% market share in 2024.
- Technological Innovation: Focus on developing eco-friendly, targeted nematicides with reduced environmental impact.
- Regulatory Landscape: Stringent regulations regarding pesticide use impacting product approvals and market access.
- Competitive Substitutes: Bio-nematicides and integrated pest management (IPM) strategies pose growing competition.
- End-User Demographics: Increasing adoption by large commercial farms driving demand for high-efficiency products.
- M&A Activity: xx M&A deals between 2019 and 2024, indicating consolidation and strategic expansion within the industry.
Nematicides Market Growth Trends & Insights
The Nematicides market witnessed a CAGR of xx% during the historical period (2019-2024), driven by factors such as increasing crop yields and rising demand from both developing and developed economies. The market size is estimated at xx Million units in 2025. The adoption of advanced application technologies, like chemigation and seed treatment, has contributed significantly to market growth. Technological disruptions, including the development of novel nematicide formulations and bio-based alternatives, are reshaping the competitive landscape. Changing consumer preferences toward sustainable agriculture are further influencing market trends. The market is projected to witness a CAGR of xx% from 2025 to 2033, reaching xx Million units by 2033. Market penetration of new nematicide technologies is expected to increase from xx% in 2025 to xx% by 2033.
Dominant Regions, Countries, or Segments in Nematicides Market
The North American nematicide market is currently the dominant region, holding a xx% market share in 2024, driven by factors such as large-scale agricultural operations and favorable regulatory policies. Within application modes, soil treatment holds the largest market share (xx%), followed by seed treatment (xx%), reflecting the importance of protecting crops at early growth stages. The Fruits & Vegetables crop segment dominates overall market demand (xx%), owing to high vulnerability to nematode infestations.
- Key Drivers for North America: High adoption of modern agricultural practices, extensive commercial crop farming, and favorable regulatory environments.
- Dominance Factors for Soil Treatment: Effectiveness in controlling soil-borne nematodes, widespread acceptance across various crops.
- Growth Potential of Seed Treatment: Increasing demand for improved seed health and early crop protection contributes to strong growth prospects.
- Fruits & Vegetables Dominance: High value crops and high susceptibility to nematode damage driving strong demand.
Nematicides Market Product Landscape
The nematicides market features a diverse range of chemical and biological products, each with specific applications and performance characteristics. Recent innovations focus on developing targeted nematicides with improved efficacy and reduced environmental impact. Key advancements include the introduction of novel formulations with enhanced bioactivity, reduced leaching potential and improved crop compatibility. Unique selling propositions (USPs) often center around improved efficiency, reduced application rates, and enhanced safety profiles.
Key Drivers, Barriers & Challenges in Nematicides Market
Key Drivers: Increasing demand for food security, growing acreage under cultivation, the rise of intensive agricultural practices, and technological advancements pushing for effective and sustainable nematicide solutions.
Key Challenges & Restraints: Stringent regulatory approvals, environmental concerns related to chemical nematicide use, and the emergence of resistant nematode populations impose significant hurdles on market growth. Supply chain disruptions and price volatility of raw materials also pose considerable challenges. The cost of developing and commercializing new nematicides presents a major barrier to innovation.
Emerging Opportunities in Nematicides Market
Emerging opportunities exist in developing bio-nematicides, exploring integrated pest management (IPM) strategies, and addressing specific nematode problems affecting niche crops. Untapped markets in developing countries with high nematode infestations offer significant growth potential. The development of novel formulations compatible with precision agriculture practices further presents considerable opportunities.
Growth Accelerators in the Nematicides Market Industry
Technological advancements in formulation chemistry and delivery systems are driving market growth. Strategic partnerships between agrochemical companies and biotech firms are fostering innovation. Market expansion into new geographic regions with high pest pressure is another crucial growth driver.
Key Players Shaping the Nematicides Market Market
- Tessenderlo Kerley Inc (Novasource)
- American Vanguard Corporation
- ADAMA Agricultural Solutions Ltd
- Bayer AG
- Albaugh LLC
- Syngenta Group
- UPL Limited
- Corteva Agriscience
- Vive Crop Protection
Notable Milestones in Nematicides Market Sector
- May 2022: Corteva Agriscience expands its seed treatment portfolio and infrastructure in Brazil.
- June 2022: ADAMA Ltd acquires AgriNova New Zealand Ltd, expanding its product line in the New Zealand market.
- January 2023: Bayer partners with Oerth Bio to develop eco-friendly crop protection solutions.
In-Depth Nematicides Market Market Outlook
The Nematicides market is poised for robust growth over the forecast period (2025-2033), driven by continuous innovation in product development, expanding agricultural practices, and increasing demand for high-yielding crops. Strategic partnerships and market expansion into high-growth regions will further fuel market expansion. The focus on sustainable and environmentally friendly nematicide solutions will shape the industry's future trajectory, creating lucrative opportunities for companies embracing innovation and sustainability.
Nematicides Market Segmentation
-
1. Application Mode
- 1.1. Chemigation
- 1.2. Foliar
- 1.3. Fumigation
- 1.4. Seed Treatment
- 1.5. Soil Treatment
-
2. Crop Type
- 2.1. Commercial Crops
- 2.2. Fruits & Vegetables
- 2.3. Grains & Cereals
- 2.4. Pulses & Oilseeds
- 2.5. Turf & Ornamental
-
3. Application Mode
- 3.1. Chemigation
- 3.2. Foliar
- 3.3. Fumigation
- 3.4. Seed Treatment
- 3.5. Soil Treatment
-
4. Crop Type
- 4.1. Commercial Crops
- 4.2. Fruits & Vegetables
- 4.3. Grains & Cereals
- 4.4. Pulses & Oilseeds
- 4.5. Turf & Ornamental
Nematicides Market Segmentation By Geography
-
1. North America
- 1.1. United States
- 1.2. Canada
- 1.3. Mexico
-
2. South America
- 2.1. Brazil
- 2.2. Argentina
- 2.3. Rest of South America
-
3. Europe
- 3.1. United Kingdom
- 3.2. Germany
- 3.3. France
- 3.4. Italy
- 3.5. Spain
- 3.6. Russia
- 3.7. Benelux
- 3.8. Nordics
- 3.9. Rest of Europe
-
4. Middle East & Africa
- 4.1. Turkey
- 4.2. Israel
- 4.3. GCC
- 4.4. North Africa
- 4.5. South Africa
- 4.6. Rest of Middle East & Africa
-
5. Asia Pacific
- 5.1. China
- 5.2. India
- 5.3. Japan
- 5.4. South Korea
- 5.5. ASEAN
- 5.6. Oceania
- 5.7. Rest of Asia Pacific
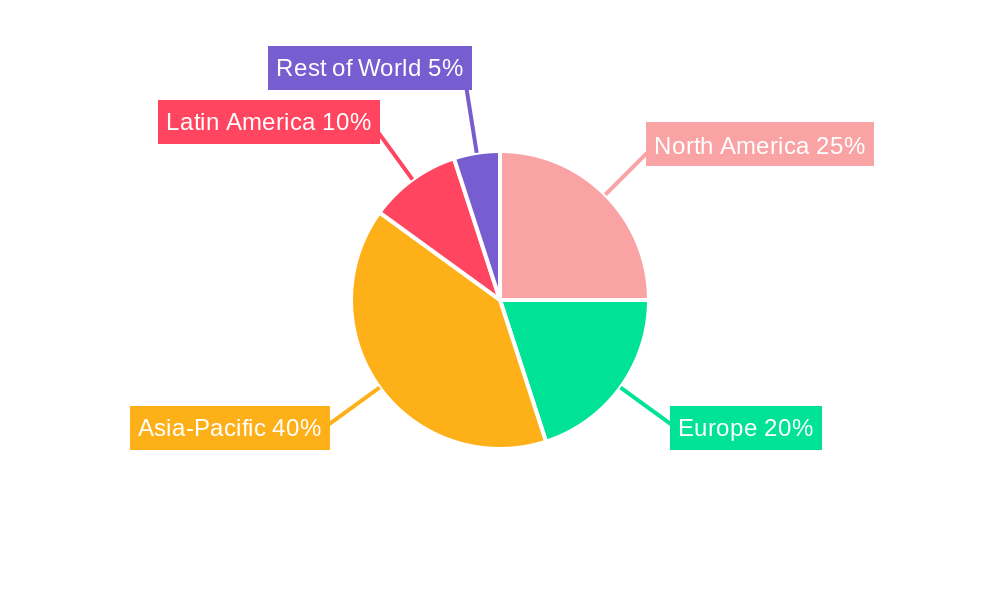
Nematicides Market Regional Market Share
Geographic Coverage of Nematicides Market
Nematicides Market REPORT HIGHLIGHTS
| Aspects | Details |
|---|---|
| Study Period | 2020-2034 |
| Base Year | 2025 |
| Estimated Year | 2026 |
| Forecast Period | 2026-2034 |
| Historical Period | 2020-2025 |
| Growth Rate | CAGR of 4.2% from 2020-2034 |
| Segmentation |
|
Table of Contents
- 1. Introduction
- 1.1. Research Scope
- 1.2. Market Segmentation
- 1.3. Research Objective
- 1.4. Definitions and Assumptions
- 2. Executive Summary
- 2.1. Market Snapshot
- 3. Market Dynamics
- 3.1. Market Drivers
- 3.2. Market Restrains
- 3.3. Market Trends
- 3.4. Market Opportunities
- 4. Market Factor Analysis
- 4.1. Porters Five Forces
- 4.1.1. Bargaining Power of Suppliers
- 4.1.2. Bargaining Power of Buyers
- 4.1.3. Threat of New Entrants
- 4.1.4. Threat of Substitutes
- 4.1.5. Competitive Rivalry
- 4.2. PESTEL analysis
- 4.3. BCG Analysis
- 4.3.1. Stars (High Growth, High Market Share)
- 4.3.2. Cash Cows (Low Growth, High Market Share)
- 4.3.3. Question Mark (High Growth, Low Market Share)
- 4.3.4. Dogs (Low Growth, Low Market Share)
- 4.4. Ansoff Matrix Analysis
- 4.5. Supply Chain Analysis
- 4.6. Regulatory Landscape
- 4.7. Current Market Potential and Opportunity Assessment (TAM–SAM–SOM Framework)
- 4.8. NRP Analyst Note
- 4.1. Porters Five Forces
- 5. Market Analysis, Insights and Forecast 2021-2033
- 5.1. Market Analysis, Insights and Forecast - by Application Mode
- 5.1.1. Chemigation
- 5.1.2. Foliar
- 5.1.3. Fumigation
- 5.1.4. Seed Treatment
- 5.1.5. Soil Treatment
- 5.2. Market Analysis, Insights and Forecast - by Crop Type
- 5.2.1. Commercial Crops
- 5.2.2. Fruits & Vegetables
- 5.2.3. Grains & Cereals
- 5.2.4. Pulses & Oilseeds
- 5.2.5. Turf & Ornamental
- 5.3. Market Analysis, Insights and Forecast - by Application Mode
- 5.3.1. Chemigation
- 5.3.2. Foliar
- 5.3.3. Fumigation
- 5.3.4. Seed Treatment
- 5.3.5. Soil Treatment
- 5.4. Market Analysis, Insights and Forecast - by Crop Type
- 5.4.1. Commercial Crops
- 5.4.2. Fruits & Vegetables
- 5.4.3. Grains & Cereals
- 5.4.4. Pulses & Oilseeds
- 5.4.5. Turf & Ornamental
- 5.5. Market Analysis, Insights and Forecast - by Region
- 5.5.1. North America
- 5.5.2. South America
- 5.5.3. Europe
- 5.5.4. Middle East & Africa
- 5.5.5. Asia Pacific
- 5.1. Market Analysis, Insights and Forecast - by Application Mode
- 6. Global Nematicides Market Analysis, Insights and Forecast, 2021-2033
- 6.1. Market Analysis, Insights and Forecast - by Application Mode
- 6.1.1. Chemigation
- 6.1.2. Foliar
- 6.1.3. Fumigation
- 6.1.4. Seed Treatment
- 6.1.5. Soil Treatment
- 6.2. Market Analysis, Insights and Forecast - by Crop Type
- 6.2.1. Commercial Crops
- 6.2.2. Fruits & Vegetables
- 6.2.3. Grains & Cereals
- 6.2.4. Pulses & Oilseeds
- 6.2.5. Turf & Ornamental
- 6.3. Market Analysis, Insights and Forecast - by Application Mode
- 6.3.1. Chemigation
- 6.3.2. Foliar
- 6.3.3. Fumigation
- 6.3.4. Seed Treatment
- 6.3.5. Soil Treatment
- 6.4. Market Analysis, Insights and Forecast - by Crop Type
- 6.4.1. Commercial Crops
- 6.4.2. Fruits & Vegetables
- 6.4.3. Grains & Cereals
- 6.4.4. Pulses & Oilseeds
- 6.4.5. Turf & Ornamental
- 6.1. Market Analysis, Insights and Forecast - by Application Mode
- 7. North America Nematicides Market Analysis, Insights and Forecast, 2020-2032
- 7.1. Market Analysis, Insights and Forecast - by Application Mode
- 7.1.1. Chemigation
- 7.1.2. Foliar
- 7.1.3. Fumigation
- 7.1.4. Seed Treatment
- 7.1.5. Soil Treatment
- 7.2. Market Analysis, Insights and Forecast - by Crop Type
- 7.2.1. Commercial Crops
- 7.2.2. Fruits & Vegetables
- 7.2.3. Grains & Cereals
- 7.2.4. Pulses & Oilseeds
- 7.2.5. Turf & Ornamental
- 7.3. Market Analysis, Insights and Forecast - by Application Mode
- 7.3.1. Chemigation
- 7.3.2. Foliar
- 7.3.3. Fumigation
- 7.3.4. Seed Treatment
- 7.3.5. Soil Treatment
- 7.4. Market Analysis, Insights and Forecast - by Crop Type
- 7.4.1. Commercial Crops
- 7.4.2. Fruits & Vegetables
- 7.4.3. Grains & Cereals
- 7.4.4. Pulses & Oilseeds
- 7.4.5. Turf & Ornamental
- 7.1. Market Analysis, Insights and Forecast - by Application Mode
- 8. South America Nematicides Market Analysis, Insights and Forecast, 2020-2032
- 8.1. Market Analysis, Insights and Forecast - by Application Mode
- 8.1.1. Chemigation
- 8.1.2. Foliar
- 8.1.3. Fumigation
- 8.1.4. Seed Treatment
- 8.1.5. Soil Treatment
- 8.2. Market Analysis, Insights and Forecast - by Crop Type
- 8.2.1. Commercial Crops
- 8.2.2. Fruits & Vegetables
- 8.2.3. Grains & Cereals
- 8.2.4. Pulses & Oilseeds
- 8.2.5. Turf & Ornamental
- 8.3. Market Analysis, Insights and Forecast - by Application Mode
- 8.3.1. Chemigation
- 8.3.2. Foliar
- 8.3.3. Fumigation
- 8.3.4. Seed Treatment
- 8.3.5. Soil Treatment
- 8.4. Market Analysis, Insights and Forecast - by Crop Type
- 8.4.1. Commercial Crops
- 8.4.2. Fruits & Vegetables
- 8.4.3. Grains & Cereals
- 8.4.4. Pulses & Oilseeds
- 8.4.5. Turf & Ornamental
- 8.1. Market Analysis, Insights and Forecast - by Application Mode
- 9. Europe Nematicides Market Analysis, Insights and Forecast, 2020-2032
- 9.1. Market Analysis, Insights and Forecast - by Application Mode
- 9.1.1. Chemigation
- 9.1.2. Foliar
- 9.1.3. Fumigation
- 9.1.4. Seed Treatment
- 9.1.5. Soil Treatment
- 9.2. Market Analysis, Insights and Forecast - by Crop Type
- 9.2.1. Commercial Crops
- 9.2.2. Fruits & Vegetables
- 9.2.3. Grains & Cereals
- 9.2.4. Pulses & Oilseeds
- 9.2.5. Turf & Ornamental
- 9.3. Market Analysis, Insights and Forecast - by Application Mode
- 9.3.1. Chemigation
- 9.3.2. Foliar
- 9.3.3. Fumigation
- 9.3.4. Seed Treatment
- 9.3.5. Soil Treatment
- 9.4. Market Analysis, Insights and Forecast - by Crop Type
- 9.4.1. Commercial Crops
- 9.4.2. Fruits & Vegetables
- 9.4.3. Grains & Cereals
- 9.4.4. Pulses & Oilseeds
- 9.4.5. Turf & Ornamental
- 9.1. Market Analysis, Insights and Forecast - by Application Mode
- 10. Middle East & Africa Nematicides Market Analysis, Insights and Forecast, 2020-2032
- 10.1. Market Analysis, Insights and Forecast - by Application Mode
- 10.1.1. Chemigation
- 10.1.2. Foliar
- 10.1.3. Fumigation
- 10.1.4. Seed Treatment
- 10.1.5. Soil Treatment
- 10.2. Market Analysis, Insights and Forecast - by Crop Type
- 10.2.1. Commercial Crops
- 10.2.2. Fruits & Vegetables
- 10.2.3. Grains & Cereals
- 10.2.4. Pulses & Oilseeds
- 10.2.5. Turf & Ornamental
- 10.3. Market Analysis, Insights and Forecast - by Application Mode
- 10.3.1. Chemigation
- 10.3.2. Foliar
- 10.3.3. Fumigation
- 10.3.4. Seed Treatment
- 10.3.5. Soil Treatment
- 10.4. Market Analysis, Insights and Forecast - by Crop Type
- 10.4.1. Commercial Crops
- 10.4.2. Fruits & Vegetables
- 10.4.3. Grains & Cereals
- 10.4.4. Pulses & Oilseeds
- 10.4.5. Turf & Ornamental
- 10.1. Market Analysis, Insights and Forecast - by Application Mode
- 11. Asia Pacific Nematicides Market Analysis, Insights and Forecast, 2020-2032
- 11.1. Market Analysis, Insights and Forecast - by Application Mode
- 11.1.1. Chemigation
- 11.1.2. Foliar
- 11.1.3. Fumigation
- 11.1.4. Seed Treatment
- 11.1.5. Soil Treatment
- 11.2. Market Analysis, Insights and Forecast - by Crop Type
- 11.2.1. Commercial Crops
- 11.2.2. Fruits & Vegetables
- 11.2.3. Grains & Cereals
- 11.2.4. Pulses & Oilseeds
- 11.2.5. Turf & Ornamental
- 11.3. Market Analysis, Insights and Forecast - by Application Mode
- 11.3.1. Chemigation
- 11.3.2. Foliar
- 11.3.3. Fumigation
- 11.3.4. Seed Treatment
- 11.3.5. Soil Treatment
- 11.4. Market Analysis, Insights and Forecast - by Crop Type
- 11.4.1. Commercial Crops
- 11.4.2. Fruits & Vegetables
- 11.4.3. Grains & Cereals
- 11.4.4. Pulses & Oilseeds
- 11.4.5. Turf & Ornamental
- 11.1. Market Analysis, Insights and Forecast - by Application Mode
- 12. Competitive Analysis
- 12.1. Company Profiles
- 12.1.1 Tessenderlo Kerley Inc (Novasource)
- 12.1.1.1. Company Overview
- 12.1.1.2. Products
- 12.1.1.3. Company Financials
- 12.1.1.4. SWOT Analysis
- 12.1.2 American Vanguard Corporation
- 12.1.2.1. Company Overview
- 12.1.2.2. Products
- 12.1.2.3. Company Financials
- 12.1.2.4. SWOT Analysis
- 12.1.3 ADAMA Agricultural Solutions Ltd
- 12.1.3.1. Company Overview
- 12.1.3.2. Products
- 12.1.3.3. Company Financials
- 12.1.3.4. SWOT Analysis
- 12.1.4 Bayer AG
- 12.1.4.1. Company Overview
- 12.1.4.2. Products
- 12.1.4.3. Company Financials
- 12.1.4.4. SWOT Analysis
- 12.1.5 Albaugh LLC
- 12.1.5.1. Company Overview
- 12.1.5.2. Products
- 12.1.5.3. Company Financials
- 12.1.5.4. SWOT Analysis
- 12.1.6 Syngenta Group
- 12.1.6.1. Company Overview
- 12.1.6.2. Products
- 12.1.6.3. Company Financials
- 12.1.6.4. SWOT Analysis
- 12.1.7 Upl Limited
- 12.1.7.1. Company Overview
- 12.1.7.2. Products
- 12.1.7.3. Company Financials
- 12.1.7.4. SWOT Analysis
- 12.1.8 Corteva Agriscience
- 12.1.8.1. Company Overview
- 12.1.8.2. Products
- 12.1.8.3. Company Financials
- 12.1.8.4. SWOT Analysis
- 12.1.9 Vive Crop Protectio
- 12.1.9.1. Company Overview
- 12.1.9.2. Products
- 12.1.9.3. Company Financials
- 12.1.9.4. SWOT Analysis
- 12.1.1 Tessenderlo Kerley Inc (Novasource)
- 12.2. Market Entropy
- 12.2.1 Company's Key Areas Served
- 12.2.2 Recent Developments
- 12.3. Company Market Share Analysis 2025
- 12.3.1 Top 5 Companies Market Share Analysis
- 12.3.2 Top 3 Companies Market Share Analysis
- 12.4. List of Potential Customers
- 13. Research Methodology
List of Figures
- Figure 1: Global Nematicides Market Revenue Breakdown (million, %) by Region 2025 & 2033
- Figure 2: North America Nematicides Market Revenue (million), by Application Mode 2025 & 2033
- Figure 3: North America Nematicides Market Revenue Share (%), by Application Mode 2025 & 2033
- Figure 4: North America Nematicides Market Revenue (million), by Crop Type 2025 & 2033
- Figure 5: North America Nematicides Market Revenue Share (%), by Crop Type 2025 & 2033
- Figure 6: North America Nematicides Market Revenue (million), by Application Mode 2025 & 2033
- Figure 7: North America Nematicides Market Revenue Share (%), by Application Mode 2025 & 2033
- Figure 8: North America Nematicides Market Revenue (million), by Crop Type 2025 & 2033
- Figure 9: North America Nematicides Market Revenue Share (%), by Crop Type 2025 & 2033
- Figure 10: North America Nematicides Market Revenue (million), by Country 2025 & 2033
- Figure 11: North America Nematicides Market Revenue Share (%), by Country 2025 & 2033
- Figure 12: South America Nematicides Market Revenue (million), by Application Mode 2025 & 2033
- Figure 13: South America Nematicides Market Revenue Share (%), by Application Mode 2025 & 2033
- Figure 14: South America Nematicides Market Revenue (million), by Crop Type 2025 & 2033
- Figure 15: South America Nematicides Market Revenue Share (%), by Crop Type 2025 & 2033
- Figure 16: South America Nematicides Market Revenue (million), by Application Mode 2025 & 2033
- Figure 17: South America Nematicides Market Revenue Share (%), by Application Mode 2025 & 2033
- Figure 18: South America Nematicides Market Revenue (million), by Crop Type 2025 & 2033
- Figure 19: South America Nematicides Market Revenue Share (%), by Crop Type 2025 & 2033
- Figure 20: South America Nematicides Market Revenue (million), by Country 2025 & 2033
- Figure 21: South America Nematicides Market Revenue Share (%), by Country 2025 & 2033
- Figure 22: Europe Nematicides Market Revenue (million), by Application Mode 2025 & 2033
- Figure 23: Europe Nematicides Market Revenue Share (%), by Application Mode 2025 & 2033
- Figure 24: Europe Nematicides Market Revenue (million), by Crop Type 2025 & 2033
- Figure 25: Europe Nematicides Market Revenue Share (%), by Crop Type 2025 & 2033
- Figure 26: Europe Nematicides Market Revenue (million), by Application Mode 2025 & 2033
- Figure 27: Europe Nematicides Market Revenue Share (%), by Application Mode 2025 & 2033
- Figure 28: Europe Nematicides Market Revenue (million), by Crop Type 2025 & 2033
- Figure 29: Europe Nematicides Market Revenue Share (%), by Crop Type 2025 & 2033
- Figure 30: Europe Nematicides Market Revenue (million), by Country 2025 & 2033
- Figure 31: Europe Nematicides Market Revenue Share (%), by Country 2025 & 2033
- Figure 32: Middle East & Africa Nematicides Market Revenue (million), by Application Mode 2025 & 2033
- Figure 33: Middle East & Africa Nematicides Market Revenue Share (%), by Application Mode 2025 & 2033
- Figure 34: Middle East & Africa Nematicides Market Revenue (million), by Crop Type 2025 & 2033
- Figure 35: Middle East & Africa Nematicides Market Revenue Share (%), by Crop Type 2025 & 2033
- Figure 36: Middle East & Africa Nematicides Market Revenue (million), by Application Mode 2025 & 2033
- Figure 37: Middle East & Africa Nematicides Market Revenue Share (%), by Application Mode 2025 & 2033
- Figure 38: Middle East & Africa Nematicides Market Revenue (million), by Crop Type 2025 & 2033
- Figure 39: Middle East & Africa Nematicides Market Revenue Share (%), by Crop Type 2025 & 2033
- Figure 40: Middle East & Africa Nematicides Market Revenue (million), by Country 2025 & 2033
- Figure 41: Middle East & Africa Nematicides Market Revenue Share (%), by Country 2025 & 2033
- Figure 42: Asia Pacific Nematicides Market Revenue (million), by Application Mode 2025 & 2033
- Figure 43: Asia Pacific Nematicides Market Revenue Share (%), by Application Mode 2025 & 2033
- Figure 44: Asia Pacific Nematicides Market Revenue (million), by Crop Type 2025 & 2033
- Figure 45: Asia Pacific Nematicides Market Revenue Share (%), by Crop Type 2025 & 2033
- Figure 46: Asia Pacific Nematicides Market Revenue (million), by Application Mode 2025 & 2033
- Figure 47: Asia Pacific Nematicides Market Revenue Share (%), by Application Mode 2025 & 2033
- Figure 48: Asia Pacific Nematicides Market Revenue (million), by Crop Type 2025 & 2033
- Figure 49: Asia Pacific Nematicides Market Revenue Share (%), by Crop Type 2025 & 2033
- Figure 50: Asia Pacific Nematicides Market Revenue (million), by Country 2025 & 2033
- Figure 51: Asia Pacific Nematicides Market Revenue Share (%), by Country 2025 & 2033
List of Tables
- Table 1: Global Nematicides Market Revenue million Forecast, by Application Mode 2020 & 2033
- Table 2: Global Nematicides Market Revenue million Forecast, by Crop Type 2020 & 2033
- Table 3: Global Nematicides Market Revenue million Forecast, by Application Mode 2020 & 2033
- Table 4: Global Nematicides Market Revenue million Forecast, by Crop Type 2020 & 2033
- Table 5: Global Nematicides Market Revenue million Forecast, by Region 2020 & 2033
- Table 6: Global Nematicides Market Revenue million Forecast, by Application Mode 2020 & 2033
- Table 7: Global Nematicides Market Revenue million Forecast, by Crop Type 2020 & 2033
- Table 8: Global Nematicides Market Revenue million Forecast, by Application Mode 2020 & 2033
- Table 9: Global Nematicides Market Revenue million Forecast, by Crop Type 2020 & 2033
- Table 10: Global Nematicides Market Revenue million Forecast, by Country 2020 & 2033
- Table 11: United States Nematicides Market Revenue (million) Forecast, by Application 2020 & 2033
- Table 12: Canada Nematicides Market Revenue (million) Forecast, by Application 2020 & 2033
- Table 13: Mexico Nematicides Market Revenue (million) Forecast, by Application 2020 & 2033
- Table 14: Global Nematicides Market Revenue million Forecast, by Application Mode 2020 & 2033
- Table 15: Global Nematicides Market Revenue million Forecast, by Crop Type 2020 & 2033
- Table 16: Global Nematicides Market Revenue million Forecast, by Application Mode 2020 & 2033
- Table 17: Global Nematicides Market Revenue million Forecast, by Crop Type 2020 & 2033
- Table 18: Global Nematicides Market Revenue million Forecast, by Country 2020 & 2033
- Table 19: Brazil Nematicides Market Revenue (million) Forecast, by Application 2020 & 2033
- Table 20: Argentina Nematicides Market Revenue (million) Forecast, by Application 2020 & 2033
- Table 21: Rest of South America Nematicides Market Revenue (million) Forecast, by Application 2020 & 2033
- Table 22: Global Nematicides Market Revenue million Forecast, by Application Mode 2020 & 2033
- Table 23: Global Nematicides Market Revenue million Forecast, by Crop Type 2020 & 2033
- Table 24: Global Nematicides Market Revenue million Forecast, by Application Mode 2020 & 2033
- Table 25: Global Nematicides Market Revenue million Forecast, by Crop Type 2020 & 2033
- Table 26: Global Nematicides Market Revenue million Forecast, by Country 2020 & 2033
- Table 27: United Kingdom Nematicides Market Revenue (million) Forecast, by Application 2020 & 2033
- Table 28: Germany Nematicides Market Revenue (million) Forecast, by Application 2020 & 2033
- Table 29: France Nematicides Market Revenue (million) Forecast, by Application 2020 & 2033
- Table 30: Italy Nematicides Market Revenue (million) Forecast, by Application 2020 & 2033
- Table 31: Spain Nematicides Market Revenue (million) Forecast, by Application 2020 & 2033
- Table 32: Russia Nematicides Market Revenue (million) Forecast, by Application 2020 & 2033
- Table 33: Benelux Nematicides Market Revenue (million) Forecast, by Application 2020 & 2033
- Table 34: Nordics Nematicides Market Revenue (million) Forecast, by Application 2020 & 2033
- Table 35: Rest of Europe Nematicides Market Revenue (million) Forecast, by Application 2020 & 2033
- Table 36: Global Nematicides Market Revenue million Forecast, by Application Mode 2020 & 2033
- Table 37: Global Nematicides Market Revenue million Forecast, by Crop Type 2020 & 2033
- Table 38: Global Nematicides Market Revenue million Forecast, by Application Mode 2020 & 2033
- Table 39: Global Nematicides Market Revenue million Forecast, by Crop Type 2020 & 2033
- Table 40: Global Nematicides Market Revenue million Forecast, by Country 2020 & 2033
- Table 41: Turkey Nematicides Market Revenue (million) Forecast, by Application 2020 & 2033
- Table 42: Israel Nematicides Market Revenue (million) Forecast, by Application 2020 & 2033
- Table 43: GCC Nematicides Market Revenue (million) Forecast, by Application 2020 & 2033
- Table 44: North Africa Nematicides Market Revenue (million) Forecast, by Application 2020 & 2033
- Table 45: South Africa Nematicides Market Revenue (million) Forecast, by Application 2020 & 2033
- Table 46: Rest of Middle East & Africa Nematicides Market Revenue (million) Forecast, by Application 2020 & 2033
- Table 47: Global Nematicides Market Revenue million Forecast, by Application Mode 2020 & 2033
- Table 48: Global Nematicides Market Revenue million Forecast, by Crop Type 2020 & 2033
- Table 49: Global Nematicides Market Revenue million Forecast, by Application Mode 2020 & 2033
- Table 50: Global Nematicides Market Revenue million Forecast, by Crop Type 2020 & 2033
- Table 51: Global Nematicides Market Revenue million Forecast, by Country 2020 & 2033
- Table 52: China Nematicides Market Revenue (million) Forecast, by Application 2020 & 2033
- Table 53: India Nematicides Market Revenue (million) Forecast, by Application 2020 & 2033
- Table 54: Japan Nematicides Market Revenue (million) Forecast, by Application 2020 & 2033
- Table 55: South Korea Nematicides Market Revenue (million) Forecast, by Application 2020 & 2033
- Table 56: ASEAN Nematicides Market Revenue (million) Forecast, by Application 2020 & 2033
- Table 57: Oceania Nematicides Market Revenue (million) Forecast, by Application 2020 & 2033
- Table 58: Rest of Asia Pacific Nematicides Market Revenue (million) Forecast, by Application 2020 & 2033
Frequently Asked Questions
1. What is the projected Compound Annual Growth Rate (CAGR) of the Nematicides Market?
The projected CAGR is approximately 4.2%.
2. Which companies are prominent players in the Nematicides Market?
Key companies in the market include Tessenderlo Kerley Inc (Novasource), American Vanguard Corporation, ADAMA Agricultural Solutions Ltd, Bayer AG, Albaugh LLC, Syngenta Group, Upl Limited, Corteva Agriscience, Vive Crop Protectio.
3. What are the main segments of the Nematicides Market?
The market segments include Application Mode, Crop Type, Application Mode, Crop Type.
4. Can you provide details about the market size?
The market size is estimated to be USD 289.36 million as of 2022.
5. What are some drivers contributing to market growth?
Seed Treatment As A Solution To Enhance Yield; Growing Awareness For Seed Treatment Among The Farmers; Rising Trend Of Organic Farming.
6. What are the notable trends driving market growth?
Increased nematode infestations and the growing adoption of nematicides stood South America in prominent position.
7. Are there any restraints impacting market growth?
Limitations Across Farm-Level Seed Treatment; Rising Environmental Concerns.
8. Can you provide examples of recent developments in the market?
January 2023: Bayer formed a new partnership with Oerth Bio to enhance crop protection technology and create more eco-friendly crop protection solutions.June 2022: AgriNova New Zealand Ltd was acquired by ADAMA Ltd. With this acquisition, ADAMA expanded its product line in the New Zealand market.May 2022: Corteva Agriscience in Brazil expanded its portfolio, services, and industrial infrastructure to commercial partners to strengthen its activities in the seed treatment industry. For instance, the company strengthened its operations in the area of seed treatment with the new global brands LumiGEN and Ampl.
9. What pricing options are available for accessing the report?
Pricing options include single-user, multi-user, and enterprise licenses priced at USD 3800, USD 4500, and USD 5800 respectively.
10. Is the market size provided in terms of value or volume?
The market size is provided in terms of value, measured in million.
11. Are there any specific market keywords associated with the report?
Yes, the market keyword associated with the report is "Nematicides Market," which aids in identifying and referencing the specific market segment covered.
12. How do I determine which pricing option suits my needs best?
The pricing options vary based on user requirements and access needs. Individual users may opt for single-user licenses, while businesses requiring broader access may choose multi-user or enterprise licenses for cost-effective access to the report.
13. Are there any additional resources or data provided in the Nematicides Market report?
While the report offers comprehensive insights, it's advisable to review the specific contents or supplementary materials provided to ascertain if additional resources or data are available.
14. How can I stay updated on further developments or reports in the Nematicides Market?
To stay informed about further developments, trends, and reports in the Nematicides Market, consider subscribing to industry newsletters, following relevant companies and organizations, or regularly checking reputable industry news sources and publications.
Methodology
Step 1 - Identification of Relevant Samples Size from Population Database


Step 2 - Approaches for Defining Global Market Size (Value, Volume* & Price*)

Note*: In applicable scenarios
Step 3 - Data Sources
Primary Research
- Web Analytics
- Survey Reports
- Research Institute
- Latest Research Reports
- Opinion Leaders
Secondary Research
- Annual Reports
- White Paper
- Latest Press Release
- Industry Association
- Paid Database
- Investor Presentations

Step 4 - Data Triangulation
Involves using different sources of information in order to increase the validity of a study
These sources are likely to be stakeholders in a program - participants, other researchers, program staff, other community members, and so on.
Then we put all data in single framework & apply various statistical tools to find out the dynamic on the market.
During the analysis stage, feedback from the stakeholder groups would be compared to determine areas of agreement as well as areas of divergence