

Key Insights
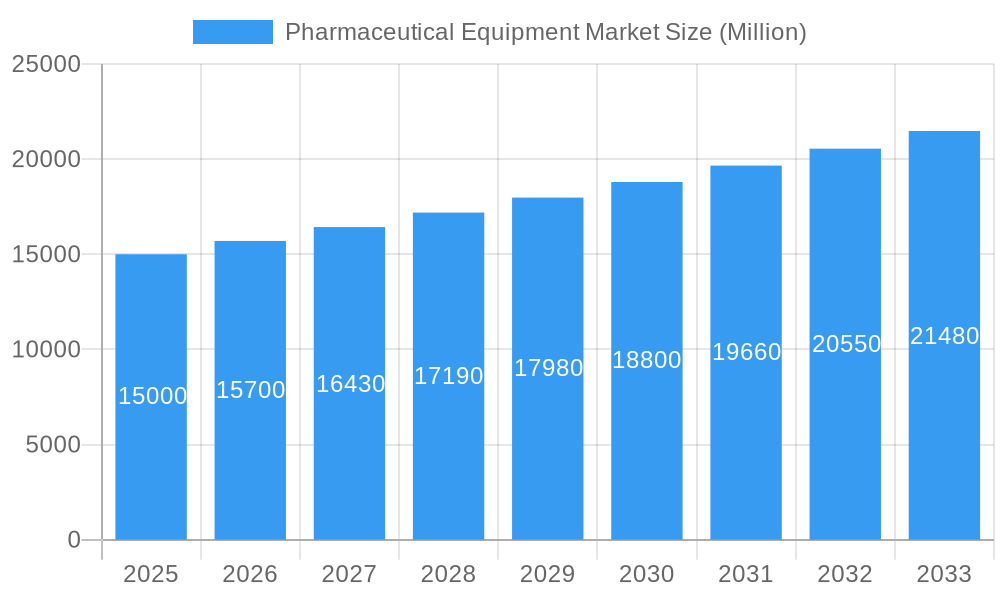
The global pharmaceutical equipment market is poised for substantial expansion, driven by escalating chronic disease prevalence worldwide, necessitating heightened pharmaceutical production and advanced equipment across all manufacturing segments. Innovations in automation and digitalization are significantly boosting manufacturing efficiency. The adoption of technologies like lyophilization and single-use systems, which enhance product quality and minimize contamination risks, further fuels market growth. Adherence to stringent Good Manufacturing Practices (GMP) and quality control mandates is also driving investment in sophisticated equipment. The market is segmented by formulation, end-user, and equipment type. Projecting from a Compound Annual Growth Rate (CAGR) of 4.62%, the market size, estimated at $25.39 billion in the base year of 2025, is expected to witness considerable growth.

Pharmaceutical Equipment Market Market Size (In Billion)
Despite strong growth prospects, market expansion faces challenges including substantial initial investment costs for advanced equipment, particularly for smaller enterprises. Intense competition among established players and the rapid emergence of new technologies are continuously transforming the market. Additionally, reliance on global supply chains presents risks of disruption from geopolitical events or unforeseen circumstances. Nonetheless, the long-term outlook remains optimistic, propelled by sustained growth in the pharmaceutical sector and continuous technological advancements. While North America and Europe currently lead in market share, the Asia-Pacific region is anticipated to experience significant growth, driven by expanding pharmaceutical manufacturing capacities in India and China. Ongoing research and development, alongside strategic collaborations and mergers & acquisitions, will continue to shape the competitive dynamics.
Pharmaceutical Equipment Market Company Market Share
Pharmaceutical Equipment Market: A Comprehensive Report (2019-2033)
This in-depth report provides a comprehensive analysis of the Pharmaceutical Equipment Market, encompassing market dynamics, growth trends, regional dominance, product landscape, key players, and future outlook. The study period covers 2019-2033, with 2025 as the base year and a forecast period of 2025-2033. The report segments the market by formulation (Tablets, Capsules, Injectables, Other Formulations), end-user (Pharmaceutical Manufacturing Companies, Contract Manufacturing Companies, Others), and equipment type (Weighing Equipment, Lyophilizers, Pharmaceutical Water Equipment, Granulating Equipment, Packaging Equipment, Others). The total market value in 2025 is estimated at xx Million units.
Pharmaceutical Equipment Market Dynamics & Structure
The Pharmaceutical Equipment market is characterized by moderate concentration, with several key players holding significant market share. Technological innovation, driven by the need for increased efficiency, automation, and improved product quality, is a major driver. Stringent regulatory frameworks and compliance requirements influence market dynamics, while the emergence of innovative substitute technologies presents both opportunities and challenges. The end-user demographic is primarily comprised of large pharmaceutical manufacturing companies and contract manufacturing organizations (CMOs), with a growing contribution from smaller players. Mergers and acquisitions (M&A) activity is relatively frequent, with companies seeking to expand their product portfolios and geographical reach.
- Market Concentration: Moderately concentrated, with top 5 players holding approximately xx% market share in 2025.
- Technological Innovation: Focus on automation, advanced analytics, and digitalization driving market growth.
- Regulatory Framework: Stringent regulations regarding GMP (Good Manufacturing Practices) and safety standards impact equipment design and adoption.
- Competitive Substitutes: Advancements in alternative technologies present competitive pressure.
- End-User Demographics: Dominated by large pharmaceutical and CMOs, with increasing participation from smaller companies.
- M&A Activity: Consistent M&A activity observed in recent years, approximately xx deals annually.
Pharmaceutical Equipment Market Growth Trends & Insights
The Pharmaceutical Equipment market experienced steady growth during the historical period (2019-2024). Driven by factors such as increasing pharmaceutical production, rising demand for advanced equipment, and technological advancements, the market is projected to maintain a healthy Compound Annual Growth Rate (CAGR) of xx% during the forecast period (2025-2033). This growth is fueled by the adoption of innovative technologies, increasing automation in manufacturing processes, and a growing preference for improved product quality and efficiency. Market penetration of advanced equipment, particularly in emerging markets, is expected to increase significantly. Consumer behavior is shifting towards greater preference for technologically advanced and efficient equipment.
Dominant Regions, Countries, or Segments in Pharmaceutical Equipment Market
North America currently holds the largest market share in the pharmaceutical equipment market, followed by Europe and Asia-Pacific. Within the segments, the demand for packaging equipment is substantial, driven by increasing production volumes and stringent packaging regulations. The injectables formulation segment exhibits strong growth potential due to the rising demand for injectable drugs. Pharmaceutical manufacturing companies constitute the largest end-user segment, reflecting their significant investments in advanced manufacturing capabilities. Growth is further fueled by supportive government policies, rising healthcare expenditure, and expanding pharmaceutical manufacturing infrastructure in emerging economies.
- Key Drivers: Favorable economic policies supporting pharmaceutical manufacturing, robust healthcare infrastructure, and increasing R&D investments.
- Dominance Factors: North America's well-established pharmaceutical industry, high levels of automation adoption in Europe, and rapid growth in the Asia-Pacific region.
Pharmaceutical Equipment Market Product Landscape
The pharmaceutical equipment market offers a diverse range of products, including weighing equipment, lyophilizers, pharmaceutical water equipment, granulating equipment, and packaging equipment. Recent innovations focus on enhanced automation, improved precision, and reduced operational costs. Unique selling propositions often center around superior performance, ease of use, and compliance with stringent regulatory standards. Technological advancements are continually improving efficiency, accuracy, and overall production output.
Key Drivers, Barriers & Challenges in Pharmaceutical Equipment Market
Key Drivers: Increasing demand for pharmaceuticals globally, stringent regulatory requirements necessitating advanced equipment, growing adoption of automation and digital technologies in manufacturing processes, and the need for improved product quality and efficiency.
Key Challenges & Restraints: High initial investment costs for advanced equipment, complex regulatory approvals and compliance processes, potential supply chain disruptions impacting procurement, and intense competition among market players. These factors could collectively reduce the market growth rate by approximately xx% in the forecast period if not addressed properly.
Emerging Opportunities in Pharmaceutical Equipment Market
Emerging opportunities include the growing demand for personalized medicine requiring specialized equipment, increased focus on sterile manufacturing techniques leading to a higher demand for cleanroom technologies, untapped markets in developing economies, and expansion into new applications such as cell and gene therapy manufacturing.
Growth Accelerators in the Pharmaceutical Equipment Market Industry
Technological breakthroughs in automation, AI, and data analytics are significantly boosting efficiency and productivity. Strategic partnerships and collaborations between equipment manufacturers and pharmaceutical companies are facilitating the development of customized solutions and accelerate market expansion. Expansion into emerging markets with substantial growth potential is a major accelerator, driving overall market growth further.
Key Players Shaping the Pharmaceutical Equipment Market Market
- Alexanderwerk
- ALFA LAVAL
- Pharmalab India Pvt Ltd
- LFA Machines Oxford LTD
- Bausch+Strobel SE + Co KG
- Syntegon Technology GmbH
- GEA Group
- Azbil Corporation (Telstar)
- Labconco
- Korber AG
- Honeyman Group Limited
- Spraying Systems Co
- Anchor Mark Pvt Ltd
Notable Milestones in Pharmaceutical Equipment Market Sector
- November 2022: Telstar expanded its process laboratory service for freeze-drying and sterilization, incorporating cold sterilization methods. This broadened its service offerings and caters to a wider range of pharmaceutical products.
- May 2022: Fluid Air technology (Spraying Systems Co.) was selected by Sferalp SA for its research laboratory in Switzerland, signifying the technology's growing adoption in research and development.
In-Depth Pharmaceutical Equipment Market Market Outlook
The pharmaceutical equipment market is poised for robust growth in the coming years, driven by continuous technological advancements, expanding pharmaceutical production, and the growing adoption of advanced equipment across various regions. Strategic partnerships and expansion into untapped markets will further fuel this growth. The market presents substantial opportunities for innovative players and those who effectively adapt to evolving industry dynamics. This report serves as a valuable resource for businesses navigating and capitalizing on these opportunities.
Pharmaceutical Equipment Market Segmentation
-
1. Type
- 1.1. Weighing Equipment
- 1.2. Lyophilizer
- 1.3. Pharmaceutical Water Equipment
- 1.4. Granulating Equipment
- 1.5. Packaging Equipment
- 1.6. Others
-
2. Formulation
- 2.1. Tablets
- 2.2. Capsules
- 2.3. Injectables
- 2.4. Other Formulations
-
3. End User
- 3.1. Pharmaceutical Manufacturing Companies
- 3.2. Contract Manufacturing Companies
- 3.3. Others
Pharmaceutical Equipment Market Segmentation By Geography
-
1. North America
- 1.1. United States
- 1.2. Canada
- 1.3. Mexico
-
2. Europe
- 2.1. Germany
- 2.2. United Kingdom
- 2.3. France
- 2.4. Italy
- 2.5. Spain
- 2.6. Rest of Europe
-
3. Asia Pacific
- 3.1. China
- 3.2. Japan
- 3.3. India
- 3.4. Australia
- 3.5. South Korea
- 3.6. Rest of Asia Pacific
-
4. Middle East and Africa
- 4.1. GCC
- 4.2. South Africa
- 4.3. Rest of Middle East and Africa
-
5. South America
- 5.1. Brazil
- 5.2. Argentina
- 5.3. Rest of South America

Pharmaceutical Equipment Market Regional Market Share
Geographic Coverage of Pharmaceutical Equipment Market
Pharmaceutical Equipment Market REPORT HIGHLIGHTS
| Aspects | Details |
|---|---|
| Study Period | 2020-2034 |
| Base Year | 2025 |
| Estimated Year | 2026 |
| Forecast Period | 2026-2034 |
| Historical Period | 2020-2025 |
| Growth Rate | CAGR of 4.62% from 2020-2034 |
| Segmentation |
|
Table of Contents
- 1. Introduction
- 1.1. Research Scope
- 1.2. Market Segmentation
- 1.3. Research Methodology
- 1.4. Definitions and Assumptions
- 2. Executive Summary
- 2.1. Introduction
- 3. Market Dynamics
- 3.1. Introduction
- 3.2. Market Drivers
- 3.2.1. High Growth in Pharmaceutical and Biopharmaceutical Industry; Technological Advancements
- 3.3. Market Restrains
- 3.3.1. High Cost of Equipment
- 3.4. Market Trends
- 3.4.1. Lyophilizer Segment is Expected to be Dominant in Pharmaceutical Equipment Market Over the Forecast Period
- 4. Market Factor Analysis
- 4.1. Porters Five Forces
- 4.2. Supply/Value Chain
- 4.3. PESTEL analysis
- 4.4. Market Entropy
- 4.5. Patent/Trademark Analysis
- 5. Global Pharmaceutical Equipment Market Analysis, Insights and Forecast, 2020-2032
- 5.1. Market Analysis, Insights and Forecast - by Type
- 5.1.1. Weighing Equipment
- 5.1.2. Lyophilizer
- 5.1.3. Pharmaceutical Water Equipment
- 5.1.4. Granulating Equipment
- 5.1.5. Packaging Equipment
- 5.1.6. Others
- 5.2. Market Analysis, Insights and Forecast - by Formulation
- 5.2.1. Tablets
- 5.2.2. Capsules
- 5.2.3. Injectables
- 5.2.4. Other Formulations
- 5.3. Market Analysis, Insights and Forecast - by End User
- 5.3.1. Pharmaceutical Manufacturing Companies
- 5.3.2. Contract Manufacturing Companies
- 5.3.3. Others
- 5.4. Market Analysis, Insights and Forecast - by Region
- 5.4.1. North America
- 5.4.2. Europe
- 5.4.3. Asia Pacific
- 5.4.4. Middle East and Africa
- 5.4.5. South America
- 5.1. Market Analysis, Insights and Forecast - by Type
- 6. North America Pharmaceutical Equipment Market Analysis, Insights and Forecast, 2020-2032
- 6.1. Market Analysis, Insights and Forecast - by Type
- 6.1.1. Weighing Equipment
- 6.1.2. Lyophilizer
- 6.1.3. Pharmaceutical Water Equipment
- 6.1.4. Granulating Equipment
- 6.1.5. Packaging Equipment
- 6.1.6. Others
- 6.2. Market Analysis, Insights and Forecast - by Formulation
- 6.2.1. Tablets
- 6.2.2. Capsules
- 6.2.3. Injectables
- 6.2.4. Other Formulations
- 6.3. Market Analysis, Insights and Forecast - by End User
- 6.3.1. Pharmaceutical Manufacturing Companies
- 6.3.2. Contract Manufacturing Companies
- 6.3.3. Others
- 6.1. Market Analysis, Insights and Forecast - by Type
- 7. Europe Pharmaceutical Equipment Market Analysis, Insights and Forecast, 2020-2032
- 7.1. Market Analysis, Insights and Forecast - by Type
- 7.1.1. Weighing Equipment
- 7.1.2. Lyophilizer
- 7.1.3. Pharmaceutical Water Equipment
- 7.1.4. Granulating Equipment
- 7.1.5. Packaging Equipment
- 7.1.6. Others
- 7.2. Market Analysis, Insights and Forecast - by Formulation
- 7.2.1. Tablets
- 7.2.2. Capsules
- 7.2.3. Injectables
- 7.2.4. Other Formulations
- 7.3. Market Analysis, Insights and Forecast - by End User
- 7.3.1. Pharmaceutical Manufacturing Companies
- 7.3.2. Contract Manufacturing Companies
- 7.3.3. Others
- 7.1. Market Analysis, Insights and Forecast - by Type
- 8. Asia Pacific Pharmaceutical Equipment Market Analysis, Insights and Forecast, 2020-2032
- 8.1. Market Analysis, Insights and Forecast - by Type
- 8.1.1. Weighing Equipment
- 8.1.2. Lyophilizer
- 8.1.3. Pharmaceutical Water Equipment
- 8.1.4. Granulating Equipment
- 8.1.5. Packaging Equipment
- 8.1.6. Others
- 8.2. Market Analysis, Insights and Forecast - by Formulation
- 8.2.1. Tablets
- 8.2.2. Capsules
- 8.2.3. Injectables
- 8.2.4. Other Formulations
- 8.3. Market Analysis, Insights and Forecast - by End User
- 8.3.1. Pharmaceutical Manufacturing Companies
- 8.3.2. Contract Manufacturing Companies
- 8.3.3. Others
- 8.1. Market Analysis, Insights and Forecast - by Type
- 9. Middle East and Africa Pharmaceutical Equipment Market Analysis, Insights and Forecast, 2020-2032
- 9.1. Market Analysis, Insights and Forecast - by Type
- 9.1.1. Weighing Equipment
- 9.1.2. Lyophilizer
- 9.1.3. Pharmaceutical Water Equipment
- 9.1.4. Granulating Equipment
- 9.1.5. Packaging Equipment
- 9.1.6. Others
- 9.2. Market Analysis, Insights and Forecast - by Formulation
- 9.2.1. Tablets
- 9.2.2. Capsules
- 9.2.3. Injectables
- 9.2.4. Other Formulations
- 9.3. Market Analysis, Insights and Forecast - by End User
- 9.3.1. Pharmaceutical Manufacturing Companies
- 9.3.2. Contract Manufacturing Companies
- 9.3.3. Others
- 9.1. Market Analysis, Insights and Forecast - by Type
- 10. South America Pharmaceutical Equipment Market Analysis, Insights and Forecast, 2020-2032
- 10.1. Market Analysis, Insights and Forecast - by Type
- 10.1.1. Weighing Equipment
- 10.1.2. Lyophilizer
- 10.1.3. Pharmaceutical Water Equipment
- 10.1.4. Granulating Equipment
- 10.1.5. Packaging Equipment
- 10.1.6. Others
- 10.2. Market Analysis, Insights and Forecast - by Formulation
- 10.2.1. Tablets
- 10.2.2. Capsules
- 10.2.3. Injectables
- 10.2.4. Other Formulations
- 10.3. Market Analysis, Insights and Forecast - by End User
- 10.3.1. Pharmaceutical Manufacturing Companies
- 10.3.2. Contract Manufacturing Companies
- 10.3.3. Others
- 10.1. Market Analysis, Insights and Forecast - by Type
- 11. Competitive Analysis
- 11.1. Global Market Share Analysis 2025
- 11.2. Company Profiles
- 11.2.1 Alexanderwerk
- 11.2.1.1. Overview
- 11.2.1.2. Products
- 11.2.1.3. SWOT Analysis
- 11.2.1.4. Recent Developments
- 11.2.1.5. Financials (Based on Availability)
- 11.2.2 ALFA LAVAL
- 11.2.2.1. Overview
- 11.2.2.2. Products
- 11.2.2.3. SWOT Analysis
- 11.2.2.4. Recent Developments
- 11.2.2.5. Financials (Based on Availability)
- 11.2.3 Pharmalab India Pvt Ltd
- 11.2.3.1. Overview
- 11.2.3.2. Products
- 11.2.3.3. SWOT Analysis
- 11.2.3.4. Recent Developments
- 11.2.3.5. Financials (Based on Availability)
- 11.2.4 LFA Machines Oxford LTD
- 11.2.4.1. Overview
- 11.2.4.2. Products
- 11.2.4.3. SWOT Analysis
- 11.2.4.4. Recent Developments
- 11.2.4.5. Financials (Based on Availability)
- 11.2.5 Bausch+Strobel SE + Co KG
- 11.2.5.1. Overview
- 11.2.5.2. Products
- 11.2.5.3. SWOT Analysis
- 11.2.5.4. Recent Developments
- 11.2.5.5. Financials (Based on Availability)
- 11.2.6 Syntegon Technology GmbH
- 11.2.6.1. Overview
- 11.2.6.2. Products
- 11.2.6.3. SWOT Analysis
- 11.2.6.4. Recent Developments
- 11.2.6.5. Financials (Based on Availability)
- 11.2.7 GEA Group
- 11.2.7.1. Overview
- 11.2.7.2. Products
- 11.2.7.3. SWOT Analysis
- 11.2.7.4. Recent Developments
- 11.2.7.5. Financials (Based on Availability)
- 11.2.8 Azbil Corporation (Telstar)
- 11.2.8.1. Overview
- 11.2.8.2. Products
- 11.2.8.3. SWOT Analysis
- 11.2.8.4. Recent Developments
- 11.2.8.5. Financials (Based on Availability)
- 11.2.9 Labconco
- 11.2.9.1. Overview
- 11.2.9.2. Products
- 11.2.9.3. SWOT Analysis
- 11.2.9.4. Recent Developments
- 11.2.9.5. Financials (Based on Availability)
- 11.2.10 Korber AG
- 11.2.10.1. Overview
- 11.2.10.2. Products
- 11.2.10.3. SWOT Analysis
- 11.2.10.4. Recent Developments
- 11.2.10.5. Financials (Based on Availability)
- 11.2.11 Honeyman Group Limited
- 11.2.11.1. Overview
- 11.2.11.2. Products
- 11.2.11.3. SWOT Analysis
- 11.2.11.4. Recent Developments
- 11.2.11.5. Financials (Based on Availability)
- 11.2.12 Spraying Systems Co
- 11.2.12.1. Overview
- 11.2.12.2. Products
- 11.2.12.3. SWOT Analysis
- 11.2.12.4. Recent Developments
- 11.2.12.5. Financials (Based on Availability)
- 11.2.13 Anchor Mark Pvt Ltd
- 11.2.13.1. Overview
- 11.2.13.2. Products
- 11.2.13.3. SWOT Analysis
- 11.2.13.4. Recent Developments
- 11.2.13.5. Financials (Based on Availability)
- 11.2.1 Alexanderwerk
List of Figures
- Figure 1: Global Pharmaceutical Equipment Market Revenue Breakdown (billion, %) by Region 2025 & 2033
- Figure 2: Global Pharmaceutical Equipment Market Volume Breakdown (K Unit, %) by Region 2025 & 2033
- Figure 3: North America Pharmaceutical Equipment Market Revenue (billion), by Type 2025 & 2033
- Figure 4: North America Pharmaceutical Equipment Market Volume (K Unit), by Type 2025 & 2033
- Figure 5: North America Pharmaceutical Equipment Market Revenue Share (%), by Type 2025 & 2033
- Figure 6: North America Pharmaceutical Equipment Market Volume Share (%), by Type 2025 & 2033
- Figure 7: North America Pharmaceutical Equipment Market Revenue (billion), by Formulation 2025 & 2033
- Figure 8: North America Pharmaceutical Equipment Market Volume (K Unit), by Formulation 2025 & 2033
- Figure 9: North America Pharmaceutical Equipment Market Revenue Share (%), by Formulation 2025 & 2033
- Figure 10: North America Pharmaceutical Equipment Market Volume Share (%), by Formulation 2025 & 2033
- Figure 11: North America Pharmaceutical Equipment Market Revenue (billion), by End User 2025 & 2033
- Figure 12: North America Pharmaceutical Equipment Market Volume (K Unit), by End User 2025 & 2033
- Figure 13: North America Pharmaceutical Equipment Market Revenue Share (%), by End User 2025 & 2033
- Figure 14: North America Pharmaceutical Equipment Market Volume Share (%), by End User 2025 & 2033
- Figure 15: North America Pharmaceutical Equipment Market Revenue (billion), by Country 2025 & 2033
- Figure 16: North America Pharmaceutical Equipment Market Volume (K Unit), by Country 2025 & 2033
- Figure 17: North America Pharmaceutical Equipment Market Revenue Share (%), by Country 2025 & 2033
- Figure 18: North America Pharmaceutical Equipment Market Volume Share (%), by Country 2025 & 2033
- Figure 19: Europe Pharmaceutical Equipment Market Revenue (billion), by Type 2025 & 2033
- Figure 20: Europe Pharmaceutical Equipment Market Volume (K Unit), by Type 2025 & 2033
- Figure 21: Europe Pharmaceutical Equipment Market Revenue Share (%), by Type 2025 & 2033
- Figure 22: Europe Pharmaceutical Equipment Market Volume Share (%), by Type 2025 & 2033
- Figure 23: Europe Pharmaceutical Equipment Market Revenue (billion), by Formulation 2025 & 2033
- Figure 24: Europe Pharmaceutical Equipment Market Volume (K Unit), by Formulation 2025 & 2033
- Figure 25: Europe Pharmaceutical Equipment Market Revenue Share (%), by Formulation 2025 & 2033
- Figure 26: Europe Pharmaceutical Equipment Market Volume Share (%), by Formulation 2025 & 2033
- Figure 27: Europe Pharmaceutical Equipment Market Revenue (billion), by End User 2025 & 2033
- Figure 28: Europe Pharmaceutical Equipment Market Volume (K Unit), by End User 2025 & 2033
- Figure 29: Europe Pharmaceutical Equipment Market Revenue Share (%), by End User 2025 & 2033
- Figure 30: Europe Pharmaceutical Equipment Market Volume Share (%), by End User 2025 & 2033
- Figure 31: Europe Pharmaceutical Equipment Market Revenue (billion), by Country 2025 & 2033
- Figure 32: Europe Pharmaceutical Equipment Market Volume (K Unit), by Country 2025 & 2033
- Figure 33: Europe Pharmaceutical Equipment Market Revenue Share (%), by Country 2025 & 2033
- Figure 34: Europe Pharmaceutical Equipment Market Volume Share (%), by Country 2025 & 2033
- Figure 35: Asia Pacific Pharmaceutical Equipment Market Revenue (billion), by Type 2025 & 2033
- Figure 36: Asia Pacific Pharmaceutical Equipment Market Volume (K Unit), by Type 2025 & 2033
- Figure 37: Asia Pacific Pharmaceutical Equipment Market Revenue Share (%), by Type 2025 & 2033
- Figure 38: Asia Pacific Pharmaceutical Equipment Market Volume Share (%), by Type 2025 & 2033
- Figure 39: Asia Pacific Pharmaceutical Equipment Market Revenue (billion), by Formulation 2025 & 2033
- Figure 40: Asia Pacific Pharmaceutical Equipment Market Volume (K Unit), by Formulation 2025 & 2033
- Figure 41: Asia Pacific Pharmaceutical Equipment Market Revenue Share (%), by Formulation 2025 & 2033
- Figure 42: Asia Pacific Pharmaceutical Equipment Market Volume Share (%), by Formulation 2025 & 2033
- Figure 43: Asia Pacific Pharmaceutical Equipment Market Revenue (billion), by End User 2025 & 2033
- Figure 44: Asia Pacific Pharmaceutical Equipment Market Volume (K Unit), by End User 2025 & 2033
- Figure 45: Asia Pacific Pharmaceutical Equipment Market Revenue Share (%), by End User 2025 & 2033
- Figure 46: Asia Pacific Pharmaceutical Equipment Market Volume Share (%), by End User 2025 & 2033
- Figure 47: Asia Pacific Pharmaceutical Equipment Market Revenue (billion), by Country 2025 & 2033
- Figure 48: Asia Pacific Pharmaceutical Equipment Market Volume (K Unit), by Country 2025 & 2033
- Figure 49: Asia Pacific Pharmaceutical Equipment Market Revenue Share (%), by Country 2025 & 2033
- Figure 50: Asia Pacific Pharmaceutical Equipment Market Volume Share (%), by Country 2025 & 2033
- Figure 51: Middle East and Africa Pharmaceutical Equipment Market Revenue (billion), by Type 2025 & 2033
- Figure 52: Middle East and Africa Pharmaceutical Equipment Market Volume (K Unit), by Type 2025 & 2033
- Figure 53: Middle East and Africa Pharmaceutical Equipment Market Revenue Share (%), by Type 2025 & 2033
- Figure 54: Middle East and Africa Pharmaceutical Equipment Market Volume Share (%), by Type 2025 & 2033
- Figure 55: Middle East and Africa Pharmaceutical Equipment Market Revenue (billion), by Formulation 2025 & 2033
- Figure 56: Middle East and Africa Pharmaceutical Equipment Market Volume (K Unit), by Formulation 2025 & 2033
- Figure 57: Middle East and Africa Pharmaceutical Equipment Market Revenue Share (%), by Formulation 2025 & 2033
- Figure 58: Middle East and Africa Pharmaceutical Equipment Market Volume Share (%), by Formulation 2025 & 2033
- Figure 59: Middle East and Africa Pharmaceutical Equipment Market Revenue (billion), by End User 2025 & 2033
- Figure 60: Middle East and Africa Pharmaceutical Equipment Market Volume (K Unit), by End User 2025 & 2033
- Figure 61: Middle East and Africa Pharmaceutical Equipment Market Revenue Share (%), by End User 2025 & 2033
- Figure 62: Middle East and Africa Pharmaceutical Equipment Market Volume Share (%), by End User 2025 & 2033
- Figure 63: Middle East and Africa Pharmaceutical Equipment Market Revenue (billion), by Country 2025 & 2033
- Figure 64: Middle East and Africa Pharmaceutical Equipment Market Volume (K Unit), by Country 2025 & 2033
- Figure 65: Middle East and Africa Pharmaceutical Equipment Market Revenue Share (%), by Country 2025 & 2033
- Figure 66: Middle East and Africa Pharmaceutical Equipment Market Volume Share (%), by Country 2025 & 2033
- Figure 67: South America Pharmaceutical Equipment Market Revenue (billion), by Type 2025 & 2033
- Figure 68: South America Pharmaceutical Equipment Market Volume (K Unit), by Type 2025 & 2033
- Figure 69: South America Pharmaceutical Equipment Market Revenue Share (%), by Type 2025 & 2033
- Figure 70: South America Pharmaceutical Equipment Market Volume Share (%), by Type 2025 & 2033
- Figure 71: South America Pharmaceutical Equipment Market Revenue (billion), by Formulation 2025 & 2033
- Figure 72: South America Pharmaceutical Equipment Market Volume (K Unit), by Formulation 2025 & 2033
- Figure 73: South America Pharmaceutical Equipment Market Revenue Share (%), by Formulation 2025 & 2033
- Figure 74: South America Pharmaceutical Equipment Market Volume Share (%), by Formulation 2025 & 2033
- Figure 75: South America Pharmaceutical Equipment Market Revenue (billion), by End User 2025 & 2033
- Figure 76: South America Pharmaceutical Equipment Market Volume (K Unit), by End User 2025 & 2033
- Figure 77: South America Pharmaceutical Equipment Market Revenue Share (%), by End User 2025 & 2033
- Figure 78: South America Pharmaceutical Equipment Market Volume Share (%), by End User 2025 & 2033
- Figure 79: South America Pharmaceutical Equipment Market Revenue (billion), by Country 2025 & 2033
- Figure 80: South America Pharmaceutical Equipment Market Volume (K Unit), by Country 2025 & 2033
- Figure 81: South America Pharmaceutical Equipment Market Revenue Share (%), by Country 2025 & 2033
- Figure 82: South America Pharmaceutical Equipment Market Volume Share (%), by Country 2025 & 2033
List of Tables
- Table 1: Global Pharmaceutical Equipment Market Revenue billion Forecast, by Type 2020 & 2033
- Table 2: Global Pharmaceutical Equipment Market Volume K Unit Forecast, by Type 2020 & 2033
- Table 3: Global Pharmaceutical Equipment Market Revenue billion Forecast, by Formulation 2020 & 2033
- Table 4: Global Pharmaceutical Equipment Market Volume K Unit Forecast, by Formulation 2020 & 2033
- Table 5: Global Pharmaceutical Equipment Market Revenue billion Forecast, by End User 2020 & 2033
- Table 6: Global Pharmaceutical Equipment Market Volume K Unit Forecast, by End User 2020 & 2033
- Table 7: Global Pharmaceutical Equipment Market Revenue billion Forecast, by Region 2020 & 2033
- Table 8: Global Pharmaceutical Equipment Market Volume K Unit Forecast, by Region 2020 & 2033
- Table 9: Global Pharmaceutical Equipment Market Revenue billion Forecast, by Type 2020 & 2033
- Table 10: Global Pharmaceutical Equipment Market Volume K Unit Forecast, by Type 2020 & 2033
- Table 11: Global Pharmaceutical Equipment Market Revenue billion Forecast, by Formulation 2020 & 2033
- Table 12: Global Pharmaceutical Equipment Market Volume K Unit Forecast, by Formulation 2020 & 2033
- Table 13: Global Pharmaceutical Equipment Market Revenue billion Forecast, by End User 2020 & 2033
- Table 14: Global Pharmaceutical Equipment Market Volume K Unit Forecast, by End User 2020 & 2033
- Table 15: Global Pharmaceutical Equipment Market Revenue billion Forecast, by Country 2020 & 2033
- Table 16: Global Pharmaceutical Equipment Market Volume K Unit Forecast, by Country 2020 & 2033
- Table 17: United States Pharmaceutical Equipment Market Revenue (billion) Forecast, by Application 2020 & 2033
- Table 18: United States Pharmaceutical Equipment Market Volume (K Unit) Forecast, by Application 2020 & 2033
- Table 19: Canada Pharmaceutical Equipment Market Revenue (billion) Forecast, by Application 2020 & 2033
- Table 20: Canada Pharmaceutical Equipment Market Volume (K Unit) Forecast, by Application 2020 & 2033
- Table 21: Mexico Pharmaceutical Equipment Market Revenue (billion) Forecast, by Application 2020 & 2033
- Table 22: Mexico Pharmaceutical Equipment Market Volume (K Unit) Forecast, by Application 2020 & 2033
- Table 23: Global Pharmaceutical Equipment Market Revenue billion Forecast, by Type 2020 & 2033
- Table 24: Global Pharmaceutical Equipment Market Volume K Unit Forecast, by Type 2020 & 2033
- Table 25: Global Pharmaceutical Equipment Market Revenue billion Forecast, by Formulation 2020 & 2033
- Table 26: Global Pharmaceutical Equipment Market Volume K Unit Forecast, by Formulation 2020 & 2033
- Table 27: Global Pharmaceutical Equipment Market Revenue billion Forecast, by End User 2020 & 2033
- Table 28: Global Pharmaceutical Equipment Market Volume K Unit Forecast, by End User 2020 & 2033
- Table 29: Global Pharmaceutical Equipment Market Revenue billion Forecast, by Country 2020 & 2033
- Table 30: Global Pharmaceutical Equipment Market Volume K Unit Forecast, by Country 2020 & 2033
- Table 31: Germany Pharmaceutical Equipment Market Revenue (billion) Forecast, by Application 2020 & 2033
- Table 32: Germany Pharmaceutical Equipment Market Volume (K Unit) Forecast, by Application 2020 & 2033
- Table 33: United Kingdom Pharmaceutical Equipment Market Revenue (billion) Forecast, by Application 2020 & 2033
- Table 34: United Kingdom Pharmaceutical Equipment Market Volume (K Unit) Forecast, by Application 2020 & 2033
- Table 35: France Pharmaceutical Equipment Market Revenue (billion) Forecast, by Application 2020 & 2033
- Table 36: France Pharmaceutical Equipment Market Volume (K Unit) Forecast, by Application 2020 & 2033
- Table 37: Italy Pharmaceutical Equipment Market Revenue (billion) Forecast, by Application 2020 & 2033
- Table 38: Italy Pharmaceutical Equipment Market Volume (K Unit) Forecast, by Application 2020 & 2033
- Table 39: Spain Pharmaceutical Equipment Market Revenue (billion) Forecast, by Application 2020 & 2033
- Table 40: Spain Pharmaceutical Equipment Market Volume (K Unit) Forecast, by Application 2020 & 2033
- Table 41: Rest of Europe Pharmaceutical Equipment Market Revenue (billion) Forecast, by Application 2020 & 2033
- Table 42: Rest of Europe Pharmaceutical Equipment Market Volume (K Unit) Forecast, by Application 2020 & 2033
- Table 43: Global Pharmaceutical Equipment Market Revenue billion Forecast, by Type 2020 & 2033
- Table 44: Global Pharmaceutical Equipment Market Volume K Unit Forecast, by Type 2020 & 2033
- Table 45: Global Pharmaceutical Equipment Market Revenue billion Forecast, by Formulation 2020 & 2033
- Table 46: Global Pharmaceutical Equipment Market Volume K Unit Forecast, by Formulation 2020 & 2033
- Table 47: Global Pharmaceutical Equipment Market Revenue billion Forecast, by End User 2020 & 2033
- Table 48: Global Pharmaceutical Equipment Market Volume K Unit Forecast, by End User 2020 & 2033
- Table 49: Global Pharmaceutical Equipment Market Revenue billion Forecast, by Country 2020 & 2033
- Table 50: Global Pharmaceutical Equipment Market Volume K Unit Forecast, by Country 2020 & 2033
- Table 51: China Pharmaceutical Equipment Market Revenue (billion) Forecast, by Application 2020 & 2033
- Table 52: China Pharmaceutical Equipment Market Volume (K Unit) Forecast, by Application 2020 & 2033
- Table 53: Japan Pharmaceutical Equipment Market Revenue (billion) Forecast, by Application 2020 & 2033
- Table 54: Japan Pharmaceutical Equipment Market Volume (K Unit) Forecast, by Application 2020 & 2033
- Table 55: India Pharmaceutical Equipment Market Revenue (billion) Forecast, by Application 2020 & 2033
- Table 56: India Pharmaceutical Equipment Market Volume (K Unit) Forecast, by Application 2020 & 2033
- Table 57: Australia Pharmaceutical Equipment Market Revenue (billion) Forecast, by Application 2020 & 2033
- Table 58: Australia Pharmaceutical Equipment Market Volume (K Unit) Forecast, by Application 2020 & 2033
- Table 59: South Korea Pharmaceutical Equipment Market Revenue (billion) Forecast, by Application 2020 & 2033
- Table 60: South Korea Pharmaceutical Equipment Market Volume (K Unit) Forecast, by Application 2020 & 2033
- Table 61: Rest of Asia Pacific Pharmaceutical Equipment Market Revenue (billion) Forecast, by Application 2020 & 2033
- Table 62: Rest of Asia Pacific Pharmaceutical Equipment Market Volume (K Unit) Forecast, by Application 2020 & 2033
- Table 63: Global Pharmaceutical Equipment Market Revenue billion Forecast, by Type 2020 & 2033
- Table 64: Global Pharmaceutical Equipment Market Volume K Unit Forecast, by Type 2020 & 2033
- Table 65: Global Pharmaceutical Equipment Market Revenue billion Forecast, by Formulation 2020 & 2033
- Table 66: Global Pharmaceutical Equipment Market Volume K Unit Forecast, by Formulation 2020 & 2033
- Table 67: Global Pharmaceutical Equipment Market Revenue billion Forecast, by End User 2020 & 2033
- Table 68: Global Pharmaceutical Equipment Market Volume K Unit Forecast, by End User 2020 & 2033
- Table 69: Global Pharmaceutical Equipment Market Revenue billion Forecast, by Country 2020 & 2033
- Table 70: Global Pharmaceutical Equipment Market Volume K Unit Forecast, by Country 2020 & 2033
- Table 71: GCC Pharmaceutical Equipment Market Revenue (billion) Forecast, by Application 2020 & 2033
- Table 72: GCC Pharmaceutical Equipment Market Volume (K Unit) Forecast, by Application 2020 & 2033
- Table 73: South Africa Pharmaceutical Equipment Market Revenue (billion) Forecast, by Application 2020 & 2033
- Table 74: South Africa Pharmaceutical Equipment Market Volume (K Unit) Forecast, by Application 2020 & 2033
- Table 75: Rest of Middle East and Africa Pharmaceutical Equipment Market Revenue (billion) Forecast, by Application 2020 & 2033
- Table 76: Rest of Middle East and Africa Pharmaceutical Equipment Market Volume (K Unit) Forecast, by Application 2020 & 2033
- Table 77: Global Pharmaceutical Equipment Market Revenue billion Forecast, by Type 2020 & 2033
- Table 78: Global Pharmaceutical Equipment Market Volume K Unit Forecast, by Type 2020 & 2033
- Table 79: Global Pharmaceutical Equipment Market Revenue billion Forecast, by Formulation 2020 & 2033
- Table 80: Global Pharmaceutical Equipment Market Volume K Unit Forecast, by Formulation 2020 & 2033
- Table 81: Global Pharmaceutical Equipment Market Revenue billion Forecast, by End User 2020 & 2033
- Table 82: Global Pharmaceutical Equipment Market Volume K Unit Forecast, by End User 2020 & 2033
- Table 83: Global Pharmaceutical Equipment Market Revenue billion Forecast, by Country 2020 & 2033
- Table 84: Global Pharmaceutical Equipment Market Volume K Unit Forecast, by Country 2020 & 2033
- Table 85: Brazil Pharmaceutical Equipment Market Revenue (billion) Forecast, by Application 2020 & 2033
- Table 86: Brazil Pharmaceutical Equipment Market Volume (K Unit) Forecast, by Application 2020 & 2033
- Table 87: Argentina Pharmaceutical Equipment Market Revenue (billion) Forecast, by Application 2020 & 2033
- Table 88: Argentina Pharmaceutical Equipment Market Volume (K Unit) Forecast, by Application 2020 & 2033
- Table 89: Rest of South America Pharmaceutical Equipment Market Revenue (billion) Forecast, by Application 2020 & 2033
- Table 90: Rest of South America Pharmaceutical Equipment Market Volume (K Unit) Forecast, by Application 2020 & 2033
Frequently Asked Questions
1. What is the projected Compound Annual Growth Rate (CAGR) of the Pharmaceutical Equipment Market?
The projected CAGR is approximately 4.62%.
2. Which companies are prominent players in the Pharmaceutical Equipment Market?
Key companies in the market include Alexanderwerk, ALFA LAVAL, Pharmalab India Pvt Ltd, LFA Machines Oxford LTD, Bausch+Strobel SE + Co KG, Syntegon Technology GmbH, GEA Group, Azbil Corporation (Telstar), Labconco, Korber AG, Honeyman Group Limited, Spraying Systems Co, Anchor Mark Pvt Ltd.
3. What are the main segments of the Pharmaceutical Equipment Market?
The market segments include Type, Formulation, End User.
4. Can you provide details about the market size?
The market size is estimated to be USD 25.39 billion as of 2022.
5. What are some drivers contributing to market growth?
High Growth in Pharmaceutical and Biopharmaceutical Industry; Technological Advancements.
6. What are the notable trends driving market growth?
Lyophilizer Segment is Expected to be Dominant in Pharmaceutical Equipment Market Over the Forecast Period.
7. Are there any restraints impacting market growth?
High Cost of Equipment.
8. Can you provide examples of recent developments in the market?
In November 2022, Telstar expanded the process laboratory service for freeze-drying and sterilization by incorporating cold sterilization methods for non-compatible medical and pharmaceutical products with conventional high-temperature sterilization.
9. What pricing options are available for accessing the report?
Pricing options include single-user, multi-user, and enterprise licenses priced at USD 4750, USD 5250, and USD 8750 respectively.
10. Is the market size provided in terms of value or volume?
The market size is provided in terms of value, measured in billion and volume, measured in K Unit.
11. Are there any specific market keywords associated with the report?
Yes, the market keyword associated with the report is "Pharmaceutical Equipment Market," which aids in identifying and referencing the specific market segment covered.
12. How do I determine which pricing option suits my needs best?
The pricing options vary based on user requirements and access needs. Individual users may opt for single-user licenses, while businesses requiring broader access may choose multi-user or enterprise licenses for cost-effective access to the report.
13. Are there any additional resources or data provided in the Pharmaceutical Equipment Market report?
While the report offers comprehensive insights, it's advisable to review the specific contents or supplementary materials provided to ascertain if additional resources or data are available.
14. How can I stay updated on further developments or reports in the Pharmaceutical Equipment Market?
To stay informed about further developments, trends, and reports in the Pharmaceutical Equipment Market, consider subscribing to industry newsletters, following relevant companies and organizations, or regularly checking reputable industry news sources and publications.
Methodology
Step 1 - Identification of Relevant Samples Size from Population Database


Step 2 - Approaches for Defining Global Market Size (Value, Volume* & Price*)

Note*: In applicable scenarios
Step 3 - Data Sources
Primary Research
- Web Analytics
- Survey Reports
- Research Institute
- Latest Research Reports
- Opinion Leaders
Secondary Research
- Annual Reports
- White Paper
- Latest Press Release
- Industry Association
- Paid Database
- Investor Presentations

Step 4 - Data Triangulation
Involves using different sources of information in order to increase the validity of a study
These sources are likely to be stakeholders in a program - participants, other researchers, program staff, other community members, and so on.
Then we put all data in single framework & apply various statistical tools to find out the dynamic on the market.
During the analysis stage, feedback from the stakeholder groups would be compared to determine areas of agreement as well as areas of divergence