

Key Insights
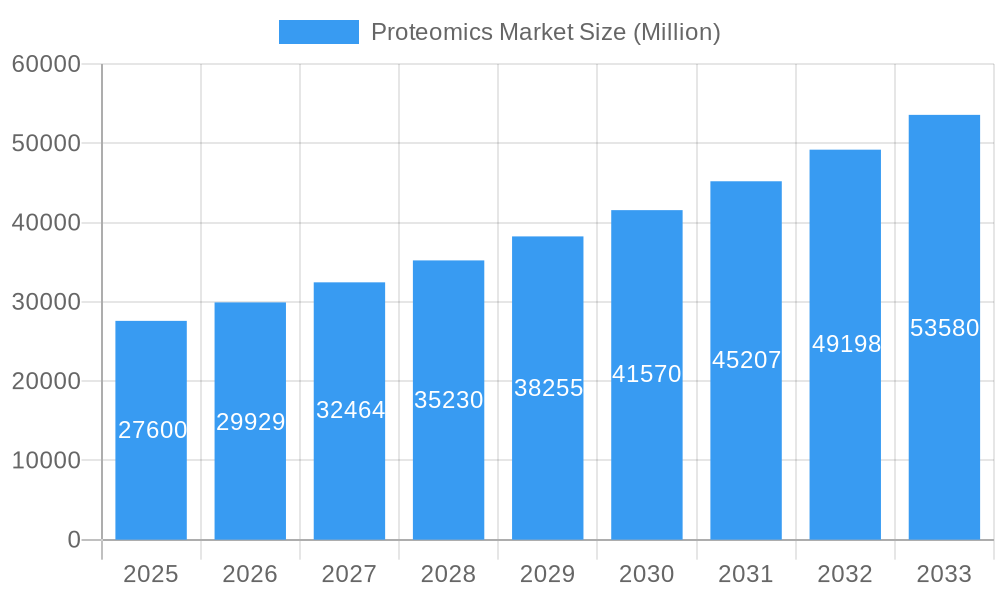
The global proteomics market, valued at $27.60 billion in 2025, is projected to experience robust growth, driven by the increasing prevalence of chronic diseases, the rising demand for personalized medicine, and advancements in proteomic technologies. The market's Compound Annual Growth Rate (CAGR) of 8.42% from 2019 to 2024 indicates a significant upward trajectory, expected to continue through 2033. Key drivers include the development of sophisticated mass spectrometry techniques, improved bioinformatics tools for data analysis, and the expanding application of proteomics in drug discovery and clinical diagnostics. The instrumentation technology segment, encompassing advanced mass spectrometers and related equipment, dominates the product and services landscape, followed by reagents and software solutions crucial for sample preparation and data interpretation. Clinical diagnostics represent a major application area, fueled by the need for accurate and early disease detection, while drug discovery benefits from proteomics' ability to identify novel drug targets and biomarkers. North America currently holds a significant market share, attributed to its robust healthcare infrastructure and extensive research funding, but the Asia-Pacific region is anticipated to witness the fastest growth due to rising healthcare spending and increasing investments in life sciences research within countries like China and India. Competitive landscape analysis reveals key players such as Thermo Fisher Scientific, Bio-Rad, and Agilent Technologies are driving innovation and expanding their market presence through strategic acquisitions and collaborations.

Proteomics Market Market Size (In Billion)
The continued expansion of the proteomics market is expected to be influenced by factors such as increased government funding for research and development, the growing adoption of high-throughput proteomics platforms, and the integration of artificial intelligence for data analysis. However, challenges remain including the high cost of instrumentation and specialized expertise required for data interpretation. Nevertheless, the long-term prospects for the proteomics market are highly positive, driven by the immense potential of proteomics in advancing healthcare and biotechnology. Further development and accessibility of cost-effective technologies will likely accelerate market expansion in developing regions.
Proteomics Market Company Market Share
Proteomics Market: A Comprehensive Report (2019-2033)
This in-depth report provides a comprehensive analysis of the global Proteomics Market, offering invaluable insights for industry professionals, investors, and researchers. The report covers the period 2019-2033, with a base year of 2025 and a forecast period of 2025-2033. The market is segmented by product & services (Instrumentation Technology, Reagents, Software and Services), application (Clinical Diagnostics, Drug Discovery, Other Applications), and key geographical regions. The market size is presented in million units.
Proteomics Market Dynamics & Structure
The global proteomics market is characterized by a moderately concentrated landscape, with key players like Thermo Fisher Scientific Inc, Danaher Corporation, and Agilent Technologies Inc holding significant market share. The market is witnessing robust growth driven by technological advancements in mass spectrometry, chromatography, and bioinformatics. Stringent regulatory frameworks, particularly concerning clinical diagnostics applications, influence market dynamics. The market also faces competition from alternative technologies in diagnostics and drug discovery. Furthermore, the increasing prevalence of chronic diseases is driving demand for proteomics-based diagnostic tools. Mergers and acquisitions (M&A) activity has been moderate, with strategic partnerships playing a more significant role in expanding market reach and technological capabilities.
- Market Concentration: Moderately concentrated, with the top 5 players holding approximately XX% market share in 2025.
- Technological Innovation: Rapid advancements in mass spectrometry and bioinformatics are key drivers.
- Regulatory Landscape: Stringent regulations, particularly in clinical diagnostics, impact market growth.
- Competitive Substitutes: Alternative technologies pose some competitive pressure, but the specificity of proteomics offers a significant advantage.
- M&A Activity: Moderate M&A activity, with a focus on strategic partnerships and technological integration. Approximately XX deals were recorded between 2019 and 2024.
- End-User Demographics: Growth driven by increasing prevalence of chronic diseases and rising demand for personalized medicine.
Proteomics Market Growth Trends & Insights
The global proteomics market exhibited a Compound Annual Growth Rate (CAGR) of XX% during the historical period (2019-2024) and is projected to maintain a CAGR of XX% during the forecast period (2025-2033), reaching a market value of XXX million by 2033. This growth is primarily attributed to the increasing adoption of proteomics technologies in various applications, including clinical diagnostics, drug discovery, and academic research. Technological advancements, such as the development of high-throughput technologies and sophisticated bioinformatics tools, have significantly improved the efficiency and accuracy of proteomics analysis. Furthermore, the growing awareness of personalized medicine and the need for early disease detection are contributing to the market's expansion. Market penetration is steadily increasing across diverse healthcare settings, driven by technological improvements, increased funding, and the growing availability of skilled professionals.
Dominant Regions, Countries, or Segments in Proteomics Market
North America currently holds the largest market share in the proteomics market, driven by significant investments in research and development, robust healthcare infrastructure, and a strong presence of major players. Within this region, the United States dominates, followed by Canada. Europe is also a significant market, with Germany and the UK as leading countries. In terms of segments, the instrumentation technology segment holds the largest market share, followed by reagents and software & services. The clinical diagnostics application segment is experiencing the highest growth rate, driven by the increasing need for accurate and early disease detection.
- North America: Strong R&D investment, advanced healthcare infrastructure, and a large number of key players contribute to its dominance.
- Europe: Significant market share, with Germany and the UK as leading countries. Strong regulatory frameworks impact growth.
- Asia-Pacific: Rapidly growing market, driven by increasing healthcare spending and technological advancements.
- Instrumentation Technology: Largest segment due to high demand for advanced instruments.
- Clinical Diagnostics: Fastest-growing application segment due to rising prevalence of chronic diseases and demand for early disease detection.
Proteomics Market Product Landscape
The proteomics market features a range of innovative products, including advanced mass spectrometers, high-performance liquid chromatography (HPLC) systems, and sophisticated software solutions for data analysis. These products boast improved sensitivity, higher throughput, and enhanced data analysis capabilities compared to their predecessors. Key selling propositions include increased accuracy, reduced analysis times, and comprehensive data interpretation tools. Recent advancements have focused on miniaturization, automation, and integration of multiple technologies for streamlined workflows.
Key Drivers, Barriers & Challenges in Proteomics Market
Key Drivers:
- Technological advancements in mass spectrometry and bioinformatics.
- Increasing prevalence of chronic diseases driving demand for advanced diagnostics.
- Rising investments in R&D and government funding for proteomics research.
- Growing adoption of personalized medicine approaches.
Key Challenges:
- High cost of instrumentation and reagents, limiting accessibility in resource-constrained settings.
- Complex data analysis requiring specialized expertise.
- Stringent regulatory requirements for clinical applications.
- Competition from alternative diagnostic technologies. The market faces competition from XX million units annually.
Emerging Opportunities in Proteomics Market
The proteomics market presents significant opportunities in areas such as early disease detection, personalized medicine, and biomarker discovery. Untapped markets in developing countries with increasing healthcare spending represent substantial growth potential. The integration of artificial intelligence and machine learning in data analysis offers opportunities to enhance the accuracy and efficiency of proteomics workflows. Furthermore, the application of proteomics in areas like environmental monitoring and agricultural research present new avenues for expansion.
Growth Accelerators in the Proteomics Market Industry
Strategic collaborations between instrument manufacturers, software developers, and research institutions are accelerating market growth. Technological breakthroughs in areas such as single-cell proteomics and label-free quantification techniques are enhancing the capabilities of proteomics analysis. Expansion into new therapeutic areas, such as immunotherapy and gene therapy, will further drive market growth. Government initiatives supporting proteomics research are providing significant impetus.
Key Players Shaping the Proteomics Market Market
Notable Milestones in Proteomics Market Sector
- 2020, Q4: Thermo Fisher Scientific launched a new high-resolution mass spectrometer.
- 2021, Q2: Bio-Rad Laboratories acquired a smaller proteomics company specializing in software.
- 2022, Q3: A major clinical trial utilizing a proteomics-based diagnostic tool was completed.
- 2023, Q1: Significant advancements in single-cell proteomics were reported.
- 2024, Q4: A new regulatory guideline for proteomics-based clinical diagnostics was published.
In-Depth Proteomics Market Market Outlook
The proteomics market is poised for continued robust growth, driven by ongoing technological advancements, expanding applications, and increasing demand for personalized medicine. Strategic partnerships, acquisitions, and the development of innovative products will shape future market dynamics. The untapped potential in developing countries and emerging applications in various sectors present substantial opportunities for market expansion and growth. The market's future hinges on continued innovation, regulatory approvals, and the ongoing integration of AI and machine learning to facilitate better data analysis and insights.
Proteomics Market Segmentation
-
1. Product & Services
-
1.1. Instrumentation Technology
- 1.1.1. Spectroscopy
- 1.1.2. Chromatography
- 1.1.3. Electrophoresis
- 1.1.4. Protein Microarrays
- 1.1.5. X-Ray Crystallography
- 1.1.6. Other Instrumentation Technologies
- 1.2. Reagents
- 1.3. Software and Services
-
1.1. Instrumentation Technology
-
2. Application
- 2.1. Clinical Diagnostics
- 2.2. Drug Discovery
- 2.3. Other Applications
Proteomics Market Segmentation By Geography
-
1. North America
- 1.1. United States
- 1.2. Canada
- 1.3. Mexico
-
2. Europe
- 2.1. Germany
- 2.2. United Kingdom
- 2.3. France
- 2.4. Italy
- 2.5. Spain
- 2.6. Rest of Europe
-
3. Asia Pacific
- 3.1. China
- 3.2. Japan
- 3.3. India
- 3.4. Australia
- 3.5. South Korea
- 3.6. Rest of Asia Pacific
- 4. Middle East
-
5. GCC
- 5.1. South Africa
- 5.2. Rest of Middle East
-
6. South America
- 6.1. Brazil
- 6.2. Argentina
- 6.3. Rest of South America

Proteomics Market Regional Market Share
Geographic Coverage of Proteomics Market
Proteomics Market REPORT HIGHLIGHTS
| Aspects | Details |
|---|---|
| Study Period | 2020-2034 |
| Base Year | 2025 |
| Estimated Year | 2026 |
| Forecast Period | 2026-2034 |
| Historical Period | 2020-2025 |
| Growth Rate | CAGR of 8.42% from 2020-2034 |
| Segmentation |
|
Table of Contents
- 1. Introduction
- 1.1. Research Scope
- 1.2. Market Segmentation
- 1.3. Research Methodology
- 1.4. Definitions and Assumptions
- 2. Executive Summary
- 2.1. Introduction
- 3. Market Dynamics
- 3.1. Introduction
- 3.2. Market Drivers
- 3.2.1. Rising Demand for Personalized Medicine; Increasing R&D Expenditure and Government Funding for Proteomics; Technological Advancements
- 3.3. Market Restrains
- 3.3.1. High Cost of Instruments
- 3.4. Market Trends
- 3.4.1. Drug Discovery is Expected to Witness Healthy CAGR in Future
- 4. Market Factor Analysis
- 4.1. Porters Five Forces
- 4.2. Supply/Value Chain
- 4.3. PESTEL analysis
- 4.4. Market Entropy
- 4.5. Patent/Trademark Analysis
- 5. Global Proteomics Market Analysis, Insights and Forecast, 2020-2032
- 5.1. Market Analysis, Insights and Forecast - by Product & Services
- 5.1.1. Instrumentation Technology
- 5.1.1.1. Spectroscopy
- 5.1.1.2. Chromatography
- 5.1.1.3. Electrophoresis
- 5.1.1.4. Protein Microarrays
- 5.1.1.5. X-Ray Crystallography
- 5.1.1.6. Other Instrumentation Technologies
- 5.1.2. Reagents
- 5.1.3. Software and Services
- 5.1.1. Instrumentation Technology
- 5.2. Market Analysis, Insights and Forecast - by Application
- 5.2.1. Clinical Diagnostics
- 5.2.2. Drug Discovery
- 5.2.3. Other Applications
- 5.3. Market Analysis, Insights and Forecast - by Region
- 5.3.1. North America
- 5.3.2. Europe
- 5.3.3. Asia Pacific
- 5.3.4. Middle East
- 5.3.5. GCC
- 5.3.6. South America
- 5.1. Market Analysis, Insights and Forecast - by Product & Services
- 6. North America Proteomics Market Analysis, Insights and Forecast, 2020-2032
- 6.1. Market Analysis, Insights and Forecast - by Product & Services
- 6.1.1. Instrumentation Technology
- 6.1.1.1. Spectroscopy
- 6.1.1.2. Chromatography
- 6.1.1.3. Electrophoresis
- 6.1.1.4. Protein Microarrays
- 6.1.1.5. X-Ray Crystallography
- 6.1.1.6. Other Instrumentation Technologies
- 6.1.2. Reagents
- 6.1.3. Software and Services
- 6.1.1. Instrumentation Technology
- 6.2. Market Analysis, Insights and Forecast - by Application
- 6.2.1. Clinical Diagnostics
- 6.2.2. Drug Discovery
- 6.2.3. Other Applications
- 6.1. Market Analysis, Insights and Forecast - by Product & Services
- 7. Europe Proteomics Market Analysis, Insights and Forecast, 2020-2032
- 7.1. Market Analysis, Insights and Forecast - by Product & Services
- 7.1.1. Instrumentation Technology
- 7.1.1.1. Spectroscopy
- 7.1.1.2. Chromatography
- 7.1.1.3. Electrophoresis
- 7.1.1.4. Protein Microarrays
- 7.1.1.5. X-Ray Crystallography
- 7.1.1.6. Other Instrumentation Technologies
- 7.1.2. Reagents
- 7.1.3. Software and Services
- 7.1.1. Instrumentation Technology
- 7.2. Market Analysis, Insights and Forecast - by Application
- 7.2.1. Clinical Diagnostics
- 7.2.2. Drug Discovery
- 7.2.3. Other Applications
- 7.1. Market Analysis, Insights and Forecast - by Product & Services
- 8. Asia Pacific Proteomics Market Analysis, Insights and Forecast, 2020-2032
- 8.1. Market Analysis, Insights and Forecast - by Product & Services
- 8.1.1. Instrumentation Technology
- 8.1.1.1. Spectroscopy
- 8.1.1.2. Chromatography
- 8.1.1.3. Electrophoresis
- 8.1.1.4. Protein Microarrays
- 8.1.1.5. X-Ray Crystallography
- 8.1.1.6. Other Instrumentation Technologies
- 8.1.2. Reagents
- 8.1.3. Software and Services
- 8.1.1. Instrumentation Technology
- 8.2. Market Analysis, Insights and Forecast - by Application
- 8.2.1. Clinical Diagnostics
- 8.2.2. Drug Discovery
- 8.2.3. Other Applications
- 8.1. Market Analysis, Insights and Forecast - by Product & Services
- 9. Middle East Proteomics Market Analysis, Insights and Forecast, 2020-2032
- 9.1. Market Analysis, Insights and Forecast - by Product & Services
- 9.1.1. Instrumentation Technology
- 9.1.1.1. Spectroscopy
- 9.1.1.2. Chromatography
- 9.1.1.3. Electrophoresis
- 9.1.1.4. Protein Microarrays
- 9.1.1.5. X-Ray Crystallography
- 9.1.1.6. Other Instrumentation Technologies
- 9.1.2. Reagents
- 9.1.3. Software and Services
- 9.1.1. Instrumentation Technology
- 9.2. Market Analysis, Insights and Forecast - by Application
- 9.2.1. Clinical Diagnostics
- 9.2.2. Drug Discovery
- 9.2.3. Other Applications
- 9.1. Market Analysis, Insights and Forecast - by Product & Services
- 10. GCC Proteomics Market Analysis, Insights and Forecast, 2020-2032
- 10.1. Market Analysis, Insights and Forecast - by Product & Services
- 10.1.1. Instrumentation Technology
- 10.1.1.1. Spectroscopy
- 10.1.1.2. Chromatography
- 10.1.1.3. Electrophoresis
- 10.1.1.4. Protein Microarrays
- 10.1.1.5. X-Ray Crystallography
- 10.1.1.6. Other Instrumentation Technologies
- 10.1.2. Reagents
- 10.1.3. Software and Services
- 10.1.1. Instrumentation Technology
- 10.2. Market Analysis, Insights and Forecast - by Application
- 10.2.1. Clinical Diagnostics
- 10.2.2. Drug Discovery
- 10.2.3. Other Applications
- 10.1. Market Analysis, Insights and Forecast - by Product & Services
- 11. South America Proteomics Market Analysis, Insights and Forecast, 2020-2032
- 11.1. Market Analysis, Insights and Forecast - by Product & Services
- 11.1.1. Instrumentation Technology
- 11.1.1.1. Spectroscopy
- 11.1.1.2. Chromatography
- 11.1.1.3. Electrophoresis
- 11.1.1.4. Protein Microarrays
- 11.1.1.5. X-Ray Crystallography
- 11.1.1.6. Other Instrumentation Technologies
- 11.1.2. Reagents
- 11.1.3. Software and Services
- 11.1.1. Instrumentation Technology
- 11.2. Market Analysis, Insights and Forecast - by Application
- 11.2.1. Clinical Diagnostics
- 11.2.2. Drug Discovery
- 11.2.3. Other Applications
- 11.1. Market Analysis, Insights and Forecast - by Product & Services
- 12. Competitive Analysis
- 12.1. Global Market Share Analysis 2025
- 12.2. Company Profiles
- 12.2.1 Promega Corporation
- 12.2.1.1. Overview
- 12.2.1.2. Products
- 12.2.1.3. SWOT Analysis
- 12.2.1.4. Recent Developments
- 12.2.1.5. Financials (Based on Availability)
- 12.2.2 Bio-Rad Laboratories Inc
- 12.2.2.1. Overview
- 12.2.2.2. Products
- 12.2.2.3. SWOT Analysis
- 12.2.2.4. Recent Developments
- 12.2.2.5. Financials (Based on Availability)
- 12.2.3 Waters Corporation
- 12.2.3.1. Overview
- 12.2.3.2. Products
- 12.2.3.3. SWOT Analysis
- 12.2.3.4. Recent Developments
- 12.2.3.5. Financials (Based on Availability)
- 12.2.4 Merck KGaA
- 12.2.4.1. Overview
- 12.2.4.2. Products
- 12.2.4.3. SWOT Analysis
- 12.2.4.4. Recent Developments
- 12.2.4.5. Financials (Based on Availability)
- 12.2.5 GE Healthcare
- 12.2.5.1. Overview
- 12.2.5.2. Products
- 12.2.5.3. SWOT Analysis
- 12.2.5.4. Recent Developments
- 12.2.5.5. Financials (Based on Availability)
- 12.2.6 Thermo Fisher Scientific Inc
- 12.2.6.1. Overview
- 12.2.6.2. Products
- 12.2.6.3. SWOT Analysis
- 12.2.6.4. Recent Developments
- 12.2.6.5. Financials (Based on Availability)
- 12.2.7 Danaher Corporation
- 12.2.7.1. Overview
- 12.2.7.2. Products
- 12.2.7.3. SWOT Analysis
- 12.2.7.4. Recent Developments
- 12.2.7.5. Financials (Based on Availability)
- 12.2.8 Agilent Technologies Inc
- 12.2.8.1. Overview
- 12.2.8.2. Products
- 12.2.8.3. SWOT Analysis
- 12.2.8.4. Recent Developments
- 12.2.8.5. Financials (Based on Availability)
- 12.2.9 Bruker Corporation
- 12.2.9.1. Overview
- 12.2.9.2. Products
- 12.2.9.3. SWOT Analysis
- 12.2.9.4. Recent Developments
- 12.2.9.5. Financials (Based on Availability)
- 12.2.1 Promega Corporation
List of Figures
- Figure 1: Global Proteomics Market Revenue Breakdown (Million, %) by Region 2025 & 2033
- Figure 2: Global Proteomics Market Volume Breakdown (K Unit, %) by Region 2025 & 2033
- Figure 3: North America Proteomics Market Revenue (Million), by Product & Services 2025 & 2033
- Figure 4: North America Proteomics Market Volume (K Unit), by Product & Services 2025 & 2033
- Figure 5: North America Proteomics Market Revenue Share (%), by Product & Services 2025 & 2033
- Figure 6: North America Proteomics Market Volume Share (%), by Product & Services 2025 & 2033
- Figure 7: North America Proteomics Market Revenue (Million), by Application 2025 & 2033
- Figure 8: North America Proteomics Market Volume (K Unit), by Application 2025 & 2033
- Figure 9: North America Proteomics Market Revenue Share (%), by Application 2025 & 2033
- Figure 10: North America Proteomics Market Volume Share (%), by Application 2025 & 2033
- Figure 11: North America Proteomics Market Revenue (Million), by Country 2025 & 2033
- Figure 12: North America Proteomics Market Volume (K Unit), by Country 2025 & 2033
- Figure 13: North America Proteomics Market Revenue Share (%), by Country 2025 & 2033
- Figure 14: North America Proteomics Market Volume Share (%), by Country 2025 & 2033
- Figure 15: Europe Proteomics Market Revenue (Million), by Product & Services 2025 & 2033
- Figure 16: Europe Proteomics Market Volume (K Unit), by Product & Services 2025 & 2033
- Figure 17: Europe Proteomics Market Revenue Share (%), by Product & Services 2025 & 2033
- Figure 18: Europe Proteomics Market Volume Share (%), by Product & Services 2025 & 2033
- Figure 19: Europe Proteomics Market Revenue (Million), by Application 2025 & 2033
- Figure 20: Europe Proteomics Market Volume (K Unit), by Application 2025 & 2033
- Figure 21: Europe Proteomics Market Revenue Share (%), by Application 2025 & 2033
- Figure 22: Europe Proteomics Market Volume Share (%), by Application 2025 & 2033
- Figure 23: Europe Proteomics Market Revenue (Million), by Country 2025 & 2033
- Figure 24: Europe Proteomics Market Volume (K Unit), by Country 2025 & 2033
- Figure 25: Europe Proteomics Market Revenue Share (%), by Country 2025 & 2033
- Figure 26: Europe Proteomics Market Volume Share (%), by Country 2025 & 2033
- Figure 27: Asia Pacific Proteomics Market Revenue (Million), by Product & Services 2025 & 2033
- Figure 28: Asia Pacific Proteomics Market Volume (K Unit), by Product & Services 2025 & 2033
- Figure 29: Asia Pacific Proteomics Market Revenue Share (%), by Product & Services 2025 & 2033
- Figure 30: Asia Pacific Proteomics Market Volume Share (%), by Product & Services 2025 & 2033
- Figure 31: Asia Pacific Proteomics Market Revenue (Million), by Application 2025 & 2033
- Figure 32: Asia Pacific Proteomics Market Volume (K Unit), by Application 2025 & 2033
- Figure 33: Asia Pacific Proteomics Market Revenue Share (%), by Application 2025 & 2033
- Figure 34: Asia Pacific Proteomics Market Volume Share (%), by Application 2025 & 2033
- Figure 35: Asia Pacific Proteomics Market Revenue (Million), by Country 2025 & 2033
- Figure 36: Asia Pacific Proteomics Market Volume (K Unit), by Country 2025 & 2033
- Figure 37: Asia Pacific Proteomics Market Revenue Share (%), by Country 2025 & 2033
- Figure 38: Asia Pacific Proteomics Market Volume Share (%), by Country 2025 & 2033
- Figure 39: Middle East Proteomics Market Revenue (Million), by Product & Services 2025 & 2033
- Figure 40: Middle East Proteomics Market Volume (K Unit), by Product & Services 2025 & 2033
- Figure 41: Middle East Proteomics Market Revenue Share (%), by Product & Services 2025 & 2033
- Figure 42: Middle East Proteomics Market Volume Share (%), by Product & Services 2025 & 2033
- Figure 43: Middle East Proteomics Market Revenue (Million), by Application 2025 & 2033
- Figure 44: Middle East Proteomics Market Volume (K Unit), by Application 2025 & 2033
- Figure 45: Middle East Proteomics Market Revenue Share (%), by Application 2025 & 2033
- Figure 46: Middle East Proteomics Market Volume Share (%), by Application 2025 & 2033
- Figure 47: Middle East Proteomics Market Revenue (Million), by Country 2025 & 2033
- Figure 48: Middle East Proteomics Market Volume (K Unit), by Country 2025 & 2033
- Figure 49: Middle East Proteomics Market Revenue Share (%), by Country 2025 & 2033
- Figure 50: Middle East Proteomics Market Volume Share (%), by Country 2025 & 2033
- Figure 51: GCC Proteomics Market Revenue (Million), by Product & Services 2025 & 2033
- Figure 52: GCC Proteomics Market Volume (K Unit), by Product & Services 2025 & 2033
- Figure 53: GCC Proteomics Market Revenue Share (%), by Product & Services 2025 & 2033
- Figure 54: GCC Proteomics Market Volume Share (%), by Product & Services 2025 & 2033
- Figure 55: GCC Proteomics Market Revenue (Million), by Application 2025 & 2033
- Figure 56: GCC Proteomics Market Volume (K Unit), by Application 2025 & 2033
- Figure 57: GCC Proteomics Market Revenue Share (%), by Application 2025 & 2033
- Figure 58: GCC Proteomics Market Volume Share (%), by Application 2025 & 2033
- Figure 59: GCC Proteomics Market Revenue (Million), by Country 2025 & 2033
- Figure 60: GCC Proteomics Market Volume (K Unit), by Country 2025 & 2033
- Figure 61: GCC Proteomics Market Revenue Share (%), by Country 2025 & 2033
- Figure 62: GCC Proteomics Market Volume Share (%), by Country 2025 & 2033
- Figure 63: South America Proteomics Market Revenue (Million), by Product & Services 2025 & 2033
- Figure 64: South America Proteomics Market Volume (K Unit), by Product & Services 2025 & 2033
- Figure 65: South America Proteomics Market Revenue Share (%), by Product & Services 2025 & 2033
- Figure 66: South America Proteomics Market Volume Share (%), by Product & Services 2025 & 2033
- Figure 67: South America Proteomics Market Revenue (Million), by Application 2025 & 2033
- Figure 68: South America Proteomics Market Volume (K Unit), by Application 2025 & 2033
- Figure 69: South America Proteomics Market Revenue Share (%), by Application 2025 & 2033
- Figure 70: South America Proteomics Market Volume Share (%), by Application 2025 & 2033
- Figure 71: South America Proteomics Market Revenue (Million), by Country 2025 & 2033
- Figure 72: South America Proteomics Market Volume (K Unit), by Country 2025 & 2033
- Figure 73: South America Proteomics Market Revenue Share (%), by Country 2025 & 2033
- Figure 74: South America Proteomics Market Volume Share (%), by Country 2025 & 2033
List of Tables
- Table 1: Global Proteomics Market Revenue Million Forecast, by Product & Services 2020 & 2033
- Table 2: Global Proteomics Market Volume K Unit Forecast, by Product & Services 2020 & 2033
- Table 3: Global Proteomics Market Revenue Million Forecast, by Application 2020 & 2033
- Table 4: Global Proteomics Market Volume K Unit Forecast, by Application 2020 & 2033
- Table 5: Global Proteomics Market Revenue Million Forecast, by Region 2020 & 2033
- Table 6: Global Proteomics Market Volume K Unit Forecast, by Region 2020 & 2033
- Table 7: Global Proteomics Market Revenue Million Forecast, by Product & Services 2020 & 2033
- Table 8: Global Proteomics Market Volume K Unit Forecast, by Product & Services 2020 & 2033
- Table 9: Global Proteomics Market Revenue Million Forecast, by Application 2020 & 2033
- Table 10: Global Proteomics Market Volume K Unit Forecast, by Application 2020 & 2033
- Table 11: Global Proteomics Market Revenue Million Forecast, by Country 2020 & 2033
- Table 12: Global Proteomics Market Volume K Unit Forecast, by Country 2020 & 2033
- Table 13: United States Proteomics Market Revenue (Million) Forecast, by Application 2020 & 2033
- Table 14: United States Proteomics Market Volume (K Unit) Forecast, by Application 2020 & 2033
- Table 15: Canada Proteomics Market Revenue (Million) Forecast, by Application 2020 & 2033
- Table 16: Canada Proteomics Market Volume (K Unit) Forecast, by Application 2020 & 2033
- Table 17: Mexico Proteomics Market Revenue (Million) Forecast, by Application 2020 & 2033
- Table 18: Mexico Proteomics Market Volume (K Unit) Forecast, by Application 2020 & 2033
- Table 19: Global Proteomics Market Revenue Million Forecast, by Product & Services 2020 & 2033
- Table 20: Global Proteomics Market Volume K Unit Forecast, by Product & Services 2020 & 2033
- Table 21: Global Proteomics Market Revenue Million Forecast, by Application 2020 & 2033
- Table 22: Global Proteomics Market Volume K Unit Forecast, by Application 2020 & 2033
- Table 23: Global Proteomics Market Revenue Million Forecast, by Country 2020 & 2033
- Table 24: Global Proteomics Market Volume K Unit Forecast, by Country 2020 & 2033
- Table 25: Germany Proteomics Market Revenue (Million) Forecast, by Application 2020 & 2033
- Table 26: Germany Proteomics Market Volume (K Unit) Forecast, by Application 2020 & 2033
- Table 27: United Kingdom Proteomics Market Revenue (Million) Forecast, by Application 2020 & 2033
- Table 28: United Kingdom Proteomics Market Volume (K Unit) Forecast, by Application 2020 & 2033
- Table 29: France Proteomics Market Revenue (Million) Forecast, by Application 2020 & 2033
- Table 30: France Proteomics Market Volume (K Unit) Forecast, by Application 2020 & 2033
- Table 31: Italy Proteomics Market Revenue (Million) Forecast, by Application 2020 & 2033
- Table 32: Italy Proteomics Market Volume (K Unit) Forecast, by Application 2020 & 2033
- Table 33: Spain Proteomics Market Revenue (Million) Forecast, by Application 2020 & 2033
- Table 34: Spain Proteomics Market Volume (K Unit) Forecast, by Application 2020 & 2033
- Table 35: Rest of Europe Proteomics Market Revenue (Million) Forecast, by Application 2020 & 2033
- Table 36: Rest of Europe Proteomics Market Volume (K Unit) Forecast, by Application 2020 & 2033
- Table 37: Global Proteomics Market Revenue Million Forecast, by Product & Services 2020 & 2033
- Table 38: Global Proteomics Market Volume K Unit Forecast, by Product & Services 2020 & 2033
- Table 39: Global Proteomics Market Revenue Million Forecast, by Application 2020 & 2033
- Table 40: Global Proteomics Market Volume K Unit Forecast, by Application 2020 & 2033
- Table 41: Global Proteomics Market Revenue Million Forecast, by Country 2020 & 2033
- Table 42: Global Proteomics Market Volume K Unit Forecast, by Country 2020 & 2033
- Table 43: China Proteomics Market Revenue (Million) Forecast, by Application 2020 & 2033
- Table 44: China Proteomics Market Volume (K Unit) Forecast, by Application 2020 & 2033
- Table 45: Japan Proteomics Market Revenue (Million) Forecast, by Application 2020 & 2033
- Table 46: Japan Proteomics Market Volume (K Unit) Forecast, by Application 2020 & 2033
- Table 47: India Proteomics Market Revenue (Million) Forecast, by Application 2020 & 2033
- Table 48: India Proteomics Market Volume (K Unit) Forecast, by Application 2020 & 2033
- Table 49: Australia Proteomics Market Revenue (Million) Forecast, by Application 2020 & 2033
- Table 50: Australia Proteomics Market Volume (K Unit) Forecast, by Application 2020 & 2033
- Table 51: South Korea Proteomics Market Revenue (Million) Forecast, by Application 2020 & 2033
- Table 52: South Korea Proteomics Market Volume (K Unit) Forecast, by Application 2020 & 2033
- Table 53: Rest of Asia Pacific Proteomics Market Revenue (Million) Forecast, by Application 2020 & 2033
- Table 54: Rest of Asia Pacific Proteomics Market Volume (K Unit) Forecast, by Application 2020 & 2033
- Table 55: Global Proteomics Market Revenue Million Forecast, by Product & Services 2020 & 2033
- Table 56: Global Proteomics Market Volume K Unit Forecast, by Product & Services 2020 & 2033
- Table 57: Global Proteomics Market Revenue Million Forecast, by Application 2020 & 2033
- Table 58: Global Proteomics Market Volume K Unit Forecast, by Application 2020 & 2033
- Table 59: Global Proteomics Market Revenue Million Forecast, by Country 2020 & 2033
- Table 60: Global Proteomics Market Volume K Unit Forecast, by Country 2020 & 2033
- Table 61: Global Proteomics Market Revenue Million Forecast, by Product & Services 2020 & 2033
- Table 62: Global Proteomics Market Volume K Unit Forecast, by Product & Services 2020 & 2033
- Table 63: Global Proteomics Market Revenue Million Forecast, by Application 2020 & 2033
- Table 64: Global Proteomics Market Volume K Unit Forecast, by Application 2020 & 2033
- Table 65: Global Proteomics Market Revenue Million Forecast, by Country 2020 & 2033
- Table 66: Global Proteomics Market Volume K Unit Forecast, by Country 2020 & 2033
- Table 67: South Africa Proteomics Market Revenue (Million) Forecast, by Application 2020 & 2033
- Table 68: South Africa Proteomics Market Volume (K Unit) Forecast, by Application 2020 & 2033
- Table 69: Rest of Middle East Proteomics Market Revenue (Million) Forecast, by Application 2020 & 2033
- Table 70: Rest of Middle East Proteomics Market Volume (K Unit) Forecast, by Application 2020 & 2033
- Table 71: Global Proteomics Market Revenue Million Forecast, by Product & Services 2020 & 2033
- Table 72: Global Proteomics Market Volume K Unit Forecast, by Product & Services 2020 & 2033
- Table 73: Global Proteomics Market Revenue Million Forecast, by Application 2020 & 2033
- Table 74: Global Proteomics Market Volume K Unit Forecast, by Application 2020 & 2033
- Table 75: Global Proteomics Market Revenue Million Forecast, by Country 2020 & 2033
- Table 76: Global Proteomics Market Volume K Unit Forecast, by Country 2020 & 2033
- Table 77: Brazil Proteomics Market Revenue (Million) Forecast, by Application 2020 & 2033
- Table 78: Brazil Proteomics Market Volume (K Unit) Forecast, by Application 2020 & 2033
- Table 79: Argentina Proteomics Market Revenue (Million) Forecast, by Application 2020 & 2033
- Table 80: Argentina Proteomics Market Volume (K Unit) Forecast, by Application 2020 & 2033
- Table 81: Rest of South America Proteomics Market Revenue (Million) Forecast, by Application 2020 & 2033
- Table 82: Rest of South America Proteomics Market Volume (K Unit) Forecast, by Application 2020 & 2033
Frequently Asked Questions
1. What is the projected Compound Annual Growth Rate (CAGR) of the Proteomics Market?
The projected CAGR is approximately 8.42%.
2. Which companies are prominent players in the Proteomics Market?
Key companies in the market include Promega Corporation, Bio-Rad Laboratories Inc, Waters Corporation, Merck KGaA, GE Healthcare, Thermo Fisher Scientific Inc, Danaher Corporation, Agilent Technologies Inc, Bruker Corporation.
3. What are the main segments of the Proteomics Market?
The market segments include Product & Services, Application.
4. Can you provide details about the market size?
The market size is estimated to be USD 27.60 Million as of 2022.
5. What are some drivers contributing to market growth?
Rising Demand for Personalized Medicine; Increasing R&D Expenditure and Government Funding for Proteomics; Technological Advancements.
6. What are the notable trends driving market growth?
Drug Discovery is Expected to Witness Healthy CAGR in Future.
7. Are there any restraints impacting market growth?
High Cost of Instruments.
8. Can you provide examples of recent developments in the market?
N/A
9. What pricing options are available for accessing the report?
Pricing options include single-user, multi-user, and enterprise licenses priced at USD 4750, USD 5250, and USD 8750 respectively.
10. Is the market size provided in terms of value or volume?
The market size is provided in terms of value, measured in Million and volume, measured in K Unit.
11. Are there any specific market keywords associated with the report?
Yes, the market keyword associated with the report is "Proteomics Market," which aids in identifying and referencing the specific market segment covered.
12. How do I determine which pricing option suits my needs best?
The pricing options vary based on user requirements and access needs. Individual users may opt for single-user licenses, while businesses requiring broader access may choose multi-user or enterprise licenses for cost-effective access to the report.
13. Are there any additional resources or data provided in the Proteomics Market report?
While the report offers comprehensive insights, it's advisable to review the specific contents or supplementary materials provided to ascertain if additional resources or data are available.
14. How can I stay updated on further developments or reports in the Proteomics Market?
To stay informed about further developments, trends, and reports in the Proteomics Market, consider subscribing to industry newsletters, following relevant companies and organizations, or regularly checking reputable industry news sources and publications.
Methodology
Step 1 - Identification of Relevant Samples Size from Population Database


Step 2 - Approaches for Defining Global Market Size (Value, Volume* & Price*)

Note*: In applicable scenarios
Step 3 - Data Sources
Primary Research
- Web Analytics
- Survey Reports
- Research Institute
- Latest Research Reports
- Opinion Leaders
Secondary Research
- Annual Reports
- White Paper
- Latest Press Release
- Industry Association
- Paid Database
- Investor Presentations

Step 4 - Data Triangulation
Involves using different sources of information in order to increase the validity of a study
These sources are likely to be stakeholders in a program - participants, other researchers, program staff, other community members, and so on.
Then we put all data in single framework & apply various statistical tools to find out the dynamic on the market.
During the analysis stage, feedback from the stakeholder groups would be compared to determine areas of agreement as well as areas of divergence