

Key Insights
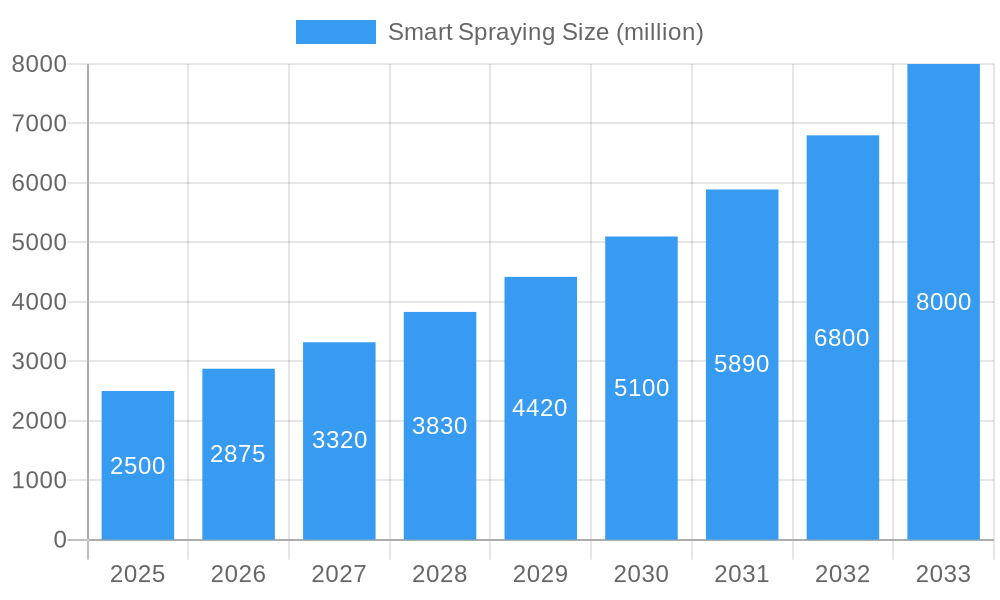
The smart spraying market is experiencing robust growth, driven by the increasing need for precision agriculture and sustainable farming practices. The market, estimated at $2.5 billion in 2025, is projected to exhibit a Compound Annual Growth Rate (CAGR) of 15% from 2025 to 2033, reaching an estimated $8 billion by 2033. This growth is fueled by several key factors: the rising adoption of advanced technologies such as GPS, sensors, and AI in agricultural practices; increasing awareness among farmers regarding the benefits of reduced chemical usage and improved crop yields; stringent government regulations aimed at promoting sustainable agriculture; and the growing demand for efficient resource management in farming. Key players like AGCO Corporation, Deere & Company, and others are investing heavily in R&D to develop innovative smart spraying solutions, further driving market expansion. However, challenges remain, including the high initial investment costs associated with smart spraying technologies and the need for reliable internet connectivity in rural areas.
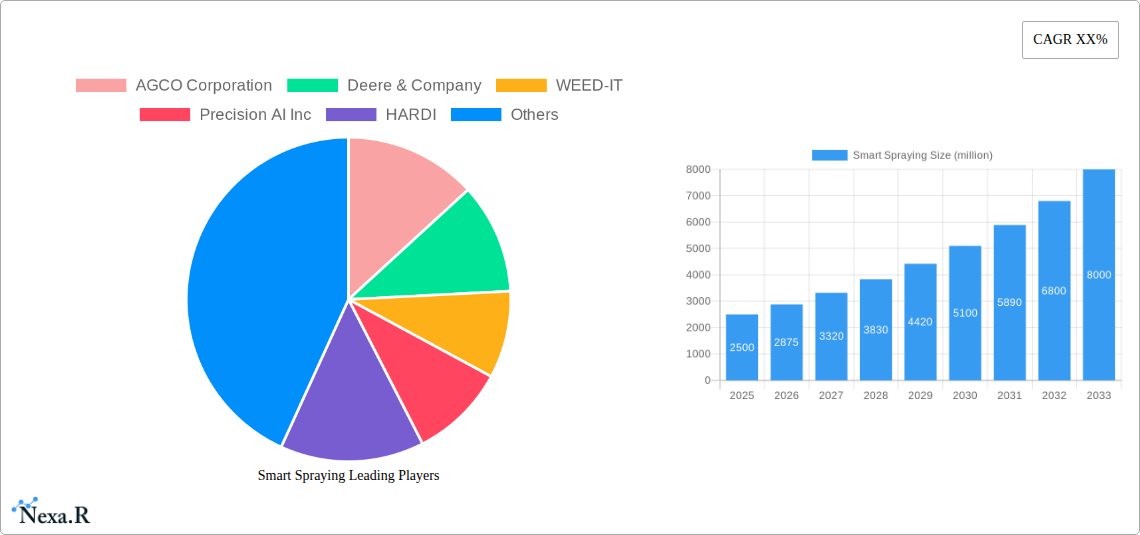
Smart Spraying Market Size (In Billion)
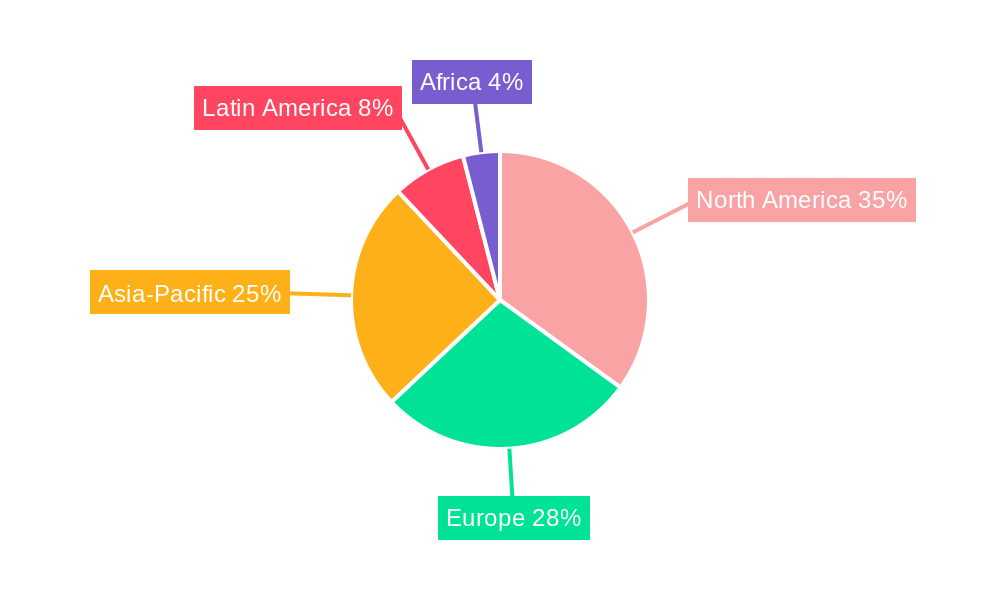
Despite these challenges, the long-term outlook for the smart spraying market remains positive. The ongoing technological advancements, coupled with increasing farmer adoption and favorable government policies, are expected to overcome these hurdles. The market segmentation is likely diverse, encompassing various types of smart spraying equipment, application methods, and crop types. Further market penetration will depend on factors such as affordability, ease of use, and the demonstrable return on investment for farmers. The regional distribution likely reflects the concentration of agricultural activities globally, with North America and Europe currently holding significant market shares, but emerging markets in Asia and Latin America are poised for significant growth in the coming years.
Smart Spraying Company Market Share
Smart Spraying Market Report: 2019-2033
This comprehensive report provides an in-depth analysis of the global Smart Spraying market, offering invaluable insights for industry professionals, investors, and strategic decision-makers. Leveraging extensive research and data analysis covering the period 2019-2033 (Base Year: 2025, Forecast Period: 2025-2033), this report dissects market dynamics, growth trends, regional dominance, and the competitive landscape. The report focuses on the parent market of Precision Agriculture and the child market of Crop Protection, providing a granular view of the Smart Spraying segment within this broader context. Expected market size values are presented in million units.
Smart Spraying Market Dynamics & Structure
The Smart Spraying market, a key component of the precision agriculture sector, is characterized by moderate concentration, with several key players vying for market share. Technological innovation, driven by advancements in sensor technology, AI, and GPS, is a primary growth driver. Regulatory frameworks concerning pesticide use and environmental protection significantly influence market dynamics. Competition from traditional spraying methods represents a considerable challenge, while the market also experiences pressure from substitute technologies like drone spraying. End-user demographics, primarily comprised of large-scale commercial farms and agricultural businesses, are increasingly adopting smart spraying technologies to enhance efficiency and sustainability. M&A activity in the sector has been relatively consistent, with xx deals recorded between 2019 and 2024, indicating a focus on consolidation and technological acquisition.
- Market Concentration: Moderately concentrated, with the top 5 players holding approximately xx% of the market share in 2024.
- Technological Innovation: Significant advancements in sensor technology, AI-powered image recognition, and GPS accuracy are driving adoption.
- Regulatory Frameworks: Stringent regulations concerning pesticide use and environmental impact are shaping product development and market access.
- Competitive Product Substitutes: Traditional spraying methods and drone-based spraying pose significant competitive challenges.
- End-User Demographics: Predominantly large-scale commercial farms and agricultural cooperatives.
- M&A Trends: xx M&A deals recorded between 2019 and 2024, reflecting consolidation and technological acquisition.
Smart Spraying Growth Trends & Insights
The Smart Spraying market is experiencing robust growth, fueled by the increasing demand for efficient and sustainable agricultural practices. The market size witnessed a CAGR of xx% during the historical period (2019-2024) and is projected to reach xx million units by 2025, further expanding at a CAGR of xx% during the forecast period (2025-2033). Market penetration has increased steadily, with xx% of farms utilizing smart spraying technologies in 2024. Technological disruptions, particularly the integration of AI and machine learning, have significantly improved the accuracy and efficiency of smart spraying systems. Furthermore, shifting consumer preferences towards sustainably produced food have driven demand for precision agriculture technologies, leading to increased adoption of smart spraying systems globally. The rising awareness regarding the environmental impact of traditional pesticide application has further boosted the growth of this segment.
Dominant Regions, Countries, or Segments in Smart Spraying
North America currently leads the Smart Spraying market, driven by high adoption rates among large commercial farms, supportive government policies, and robust technological infrastructure. Europe holds a significant share as well, followed by Asia-Pacific, where market growth is fueled by increasing agricultural production and government initiatives promoting sustainable agriculture. Within segments, the application in row crops dominates the market due to the suitability of smart spraying for targeted pesticide application.
- North America: High adoption rates, supportive government policies, advanced infrastructure, and significant presence of major players.
- Europe: Strong focus on sustainable agriculture practices, technological advancement, and favorable regulatory environments.
- Asia-Pacific: Rapidly growing agricultural sector, increasing investment in precision agriculture technologies, government incentives.
- Row Crops Segment: High market share due to the precision targeting capabilities of smart spraying in large fields.
Smart Spraying Product Landscape
Smart spraying systems integrate advanced technologies like GPS, sensors, and AI to precisely target pesticide application, minimizing waste and environmental impact. Products range from self-propelled sprayers equipped with advanced control systems to add-on kits for existing equipment. Unique selling propositions include increased accuracy, reduced chemical usage, and improved overall efficiency. Recent technological advancements have focused on improving sensor accuracy, enhancing AI-powered decision-making capabilities, and developing user-friendly interfaces for seamless integration into existing farm management systems.
Key Drivers, Barriers & Challenges in Smart Spraying
Key Drivers:
- Rising demand for sustainable and efficient agriculture.
- Technological advancements in sensor technology, AI, and GPS.
- Government regulations promoting environmentally friendly farming practices.
Key Challenges:
- High initial investment costs for equipment and technology.
- Dependence on reliable GPS and internet connectivity in remote areas.
- Potential technical issues and maintenance requirements.
- xx% of farmers citing high initial costs as a significant barrier to adoption (2024 data).
Emerging Opportunities in Smart Spraying
The market presents opportunities in developing smart spraying solutions for specialty crops and vineyards, addressing unique application challenges. Integrating data analytics and predictive modeling into smart spraying systems offers further scope for enhancing efficiency and optimizing resource use. Furthermore, expanding into emerging markets in Africa and South America presents significant potential for growth. The development of eco-friendly pesticides compatible with smart spraying systems offers a further avenue for market expansion.
Growth Accelerators in the Smart Spraying Industry
Technological breakthroughs in sensor technology, particularly the development of hyperspectral imaging, will improve the accuracy and efficiency of smart spraying systems. Strategic partnerships between agricultural machinery manufacturers and technology providers will accelerate market adoption. Government initiatives supporting precision agriculture, coupled with increasing consumer demand for sustainably produced food, will further stimulate market expansion.
Key Players Shaping the Smart Spraying Market
- AGCO Corporation
- Deere & Company
- WEED-IT
- Precision AI Inc
- HARDI
- Agrifac Machinery B.V.
- Ecorobotix SA
- BA Pumps & Sprayers
Notable Milestones in Smart Spraying Sector
- 2020: Introduction of AI-powered weed detection systems by Precision AI Inc.
- 2021: AGCO Corporation launches a new line of smart sprayers with advanced GPS technology.
- 2022: Deere & Company integrates smart spraying capabilities into its existing agricultural equipment.
- 2023: Several mergers and acquisitions occur, leading to consolidation within the sector.
- 2024: Ecorobotix SA secures significant funding for R&D in autonomous smart spraying systems.
In-Depth Smart Spraying Market Outlook
The Smart Spraying market is poised for continued robust growth, driven by technological advancements, increasing awareness of sustainable agriculture practices, and supportive government policies. Strategic partnerships, expansion into emerging markets, and the development of innovative applications will further fuel market expansion in the coming years. The focus on optimizing resource utilization and minimizing environmental impact will continue to be central to the evolution of smart spraying technologies.
Smart Spraying Segmentation
-
1. Application
- 1.1. Farm
- 1.2. Individual Grower
-
2. Types
- 2.1. Hardware
- 2.2. Software
- 2.3. Service
Smart Spraying Segmentation By Geography
-
1. North America
- 1.1. United States
- 1.2. Canada
- 1.3. Mexico
-
2. South America
- 2.1. Brazil
- 2.2. Argentina
- 2.3. Rest of South America
-
3. Europe
- 3.1. United Kingdom
- 3.2. Germany
- 3.3. France
- 3.4. Italy
- 3.5. Spain
- 3.6. Russia
- 3.7. Benelux
- 3.8. Nordics
- 3.9. Rest of Europe
-
4. Middle East & Africa
- 4.1. Turkey
- 4.2. Israel
- 4.3. GCC
- 4.4. North Africa
- 4.5. South Africa
- 4.6. Rest of Middle East & Africa
-
5. Asia Pacific
- 5.1. China
- 5.2. India
- 5.3. Japan
- 5.4. South Korea
- 5.5. ASEAN
- 5.6. Oceania
- 5.7. Rest of Asia Pacific
Smart Spraying Regional Market Share
Geographic Coverage of Smart Spraying
Smart Spraying REPORT HIGHLIGHTS
| Aspects | Details |
|---|---|
| Study Period | 2020-2034 |
| Base Year | 2025 |
| Estimated Year | 2026 |
| Forecast Period | 2026-2034 |
| Historical Period | 2020-2025 |
| Growth Rate | CAGR of 5.4% from 2020-2034 |
| Segmentation |
|
Table of Contents
- 1. Introduction
- 1.1. Research Scope
- 1.2. Market Segmentation
- 1.3. Research Methodology
- 1.4. Definitions and Assumptions
- 2. Executive Summary
- 2.1. Introduction
- 3. Market Dynamics
- 3.1. Introduction
- 3.2. Market Drivers
- 3.3. Market Restrains
- 3.4. Market Trends
- 4. Market Factor Analysis
- 4.1. Porters Five Forces
- 4.2. Supply/Value Chain
- 4.3. PESTEL analysis
- 4.4. Market Entropy
- 4.5. Patent/Trademark Analysis
- 5. Global Smart Spraying Analysis, Insights and Forecast, 2020-2032
- 5.1. Market Analysis, Insights and Forecast - by Application
- 5.1.1. Farm
- 5.1.2. Individual Grower
- 5.2. Market Analysis, Insights and Forecast - by Types
- 5.2.1. Hardware
- 5.2.2. Software
- 5.2.3. Service
- 5.3. Market Analysis, Insights and Forecast - by Region
- 5.3.1. North America
- 5.3.2. South America
- 5.3.3. Europe
- 5.3.4. Middle East & Africa
- 5.3.5. Asia Pacific
- 5.1. Market Analysis, Insights and Forecast - by Application
- 6. North America Smart Spraying Analysis, Insights and Forecast, 2020-2032
- 6.1. Market Analysis, Insights and Forecast - by Application
- 6.1.1. Farm
- 6.1.2. Individual Grower
- 6.2. Market Analysis, Insights and Forecast - by Types
- 6.2.1. Hardware
- 6.2.2. Software
- 6.2.3. Service
- 6.1. Market Analysis, Insights and Forecast - by Application
- 7. South America Smart Spraying Analysis, Insights and Forecast, 2020-2032
- 7.1. Market Analysis, Insights and Forecast - by Application
- 7.1.1. Farm
- 7.1.2. Individual Grower
- 7.2. Market Analysis, Insights and Forecast - by Types
- 7.2.1. Hardware
- 7.2.2. Software
- 7.2.3. Service
- 7.1. Market Analysis, Insights and Forecast - by Application
- 8. Europe Smart Spraying Analysis, Insights and Forecast, 2020-2032
- 8.1. Market Analysis, Insights and Forecast - by Application
- 8.1.1. Farm
- 8.1.2. Individual Grower
- 8.2. Market Analysis, Insights and Forecast - by Types
- 8.2.1. Hardware
- 8.2.2. Software
- 8.2.3. Service
- 8.1. Market Analysis, Insights and Forecast - by Application
- 9. Middle East & Africa Smart Spraying Analysis, Insights and Forecast, 2020-2032
- 9.1. Market Analysis, Insights and Forecast - by Application
- 9.1.1. Farm
- 9.1.2. Individual Grower
- 9.2. Market Analysis, Insights and Forecast - by Types
- 9.2.1. Hardware
- 9.2.2. Software
- 9.2.3. Service
- 9.1. Market Analysis, Insights and Forecast - by Application
- 10. Asia Pacific Smart Spraying Analysis, Insights and Forecast, 2020-2032
- 10.1. Market Analysis, Insights and Forecast - by Application
- 10.1.1. Farm
- 10.1.2. Individual Grower
- 10.2. Market Analysis, Insights and Forecast - by Types
- 10.2.1. Hardware
- 10.2.2. Software
- 10.2.3. Service
- 10.1. Market Analysis, Insights and Forecast - by Application
- 11. Competitive Analysis
- 11.1. Global Market Share Analysis 2025
- 11.2. Company Profiles
- 11.2.1 AGCO Corporation
- 11.2.1.1. Overview
- 11.2.1.2. Products
- 11.2.1.3. SWOT Analysis
- 11.2.1.4. Recent Developments
- 11.2.1.5. Financials (Based on Availability)
- 11.2.2 Deere & Company
- 11.2.2.1. Overview
- 11.2.2.2. Products
- 11.2.2.3. SWOT Analysis
- 11.2.2.4. Recent Developments
- 11.2.2.5. Financials (Based on Availability)
- 11.2.3 WEED-IT
- 11.2.3.1. Overview
- 11.2.3.2. Products
- 11.2.3.3. SWOT Analysis
- 11.2.3.4. Recent Developments
- 11.2.3.5. Financials (Based on Availability)
- 11.2.4 Precision AI Inc
- 11.2.4.1. Overview
- 11.2.4.2. Products
- 11.2.4.3. SWOT Analysis
- 11.2.4.4. Recent Developments
- 11.2.4.5. Financials (Based on Availability)
- 11.2.5 HARDI
- 11.2.5.1. Overview
- 11.2.5.2. Products
- 11.2.5.3. SWOT Analysis
- 11.2.5.4. Recent Developments
- 11.2.5.5. Financials (Based on Availability)
- 11.2.6 Agrifac Machinery B.V.
- 11.2.6.1. Overview
- 11.2.6.2. Products
- 11.2.6.3. SWOT Analysis
- 11.2.6.4. Recent Developments
- 11.2.6.5. Financials (Based on Availability)
- 11.2.7 Ecorobotix SA
- 11.2.7.1. Overview
- 11.2.7.2. Products
- 11.2.7.3. SWOT Analysis
- 11.2.7.4. Recent Developments
- 11.2.7.5. Financials (Based on Availability)
- 11.2.8 BA Pumps & Sprayers
- 11.2.8.1. Overview
- 11.2.8.2. Products
- 11.2.8.3. SWOT Analysis
- 11.2.8.4. Recent Developments
- 11.2.8.5. Financials (Based on Availability)
- 11.2.1 AGCO Corporation
List of Figures
- Figure 1: Global Smart Spraying Revenue Breakdown (undefined, %) by Region 2025 & 2033
- Figure 2: North America Smart Spraying Revenue (undefined), by Application 2025 & 2033
- Figure 3: North America Smart Spraying Revenue Share (%), by Application 2025 & 2033
- Figure 4: North America Smart Spraying Revenue (undefined), by Types 2025 & 2033
- Figure 5: North America Smart Spraying Revenue Share (%), by Types 2025 & 2033
- Figure 6: North America Smart Spraying Revenue (undefined), by Country 2025 & 2033
- Figure 7: North America Smart Spraying Revenue Share (%), by Country 2025 & 2033
- Figure 8: South America Smart Spraying Revenue (undefined), by Application 2025 & 2033
- Figure 9: South America Smart Spraying Revenue Share (%), by Application 2025 & 2033
- Figure 10: South America Smart Spraying Revenue (undefined), by Types 2025 & 2033
- Figure 11: South America Smart Spraying Revenue Share (%), by Types 2025 & 2033
- Figure 12: South America Smart Spraying Revenue (undefined), by Country 2025 & 2033
- Figure 13: South America Smart Spraying Revenue Share (%), by Country 2025 & 2033
- Figure 14: Europe Smart Spraying Revenue (undefined), by Application 2025 & 2033
- Figure 15: Europe Smart Spraying Revenue Share (%), by Application 2025 & 2033
- Figure 16: Europe Smart Spraying Revenue (undefined), by Types 2025 & 2033
- Figure 17: Europe Smart Spraying Revenue Share (%), by Types 2025 & 2033
- Figure 18: Europe Smart Spraying Revenue (undefined), by Country 2025 & 2033
- Figure 19: Europe Smart Spraying Revenue Share (%), by Country 2025 & 2033
- Figure 20: Middle East & Africa Smart Spraying Revenue (undefined), by Application 2025 & 2033
- Figure 21: Middle East & Africa Smart Spraying Revenue Share (%), by Application 2025 & 2033
- Figure 22: Middle East & Africa Smart Spraying Revenue (undefined), by Types 2025 & 2033
- Figure 23: Middle East & Africa Smart Spraying Revenue Share (%), by Types 2025 & 2033
- Figure 24: Middle East & Africa Smart Spraying Revenue (undefined), by Country 2025 & 2033
- Figure 25: Middle East & Africa Smart Spraying Revenue Share (%), by Country 2025 & 2033
- Figure 26: Asia Pacific Smart Spraying Revenue (undefined), by Application 2025 & 2033
- Figure 27: Asia Pacific Smart Spraying Revenue Share (%), by Application 2025 & 2033
- Figure 28: Asia Pacific Smart Spraying Revenue (undefined), by Types 2025 & 2033
- Figure 29: Asia Pacific Smart Spraying Revenue Share (%), by Types 2025 & 2033
- Figure 30: Asia Pacific Smart Spraying Revenue (undefined), by Country 2025 & 2033
- Figure 31: Asia Pacific Smart Spraying Revenue Share (%), by Country 2025 & 2033
List of Tables
- Table 1: Global Smart Spraying Revenue undefined Forecast, by Application 2020 & 2033
- Table 2: Global Smart Spraying Revenue undefined Forecast, by Types 2020 & 2033
- Table 3: Global Smart Spraying Revenue undefined Forecast, by Region 2020 & 2033
- Table 4: Global Smart Spraying Revenue undefined Forecast, by Application 2020 & 2033
- Table 5: Global Smart Spraying Revenue undefined Forecast, by Types 2020 & 2033
- Table 6: Global Smart Spraying Revenue undefined Forecast, by Country 2020 & 2033
- Table 7: United States Smart Spraying Revenue (undefined) Forecast, by Application 2020 & 2033
- Table 8: Canada Smart Spraying Revenue (undefined) Forecast, by Application 2020 & 2033
- Table 9: Mexico Smart Spraying Revenue (undefined) Forecast, by Application 2020 & 2033
- Table 10: Global Smart Spraying Revenue undefined Forecast, by Application 2020 & 2033
- Table 11: Global Smart Spraying Revenue undefined Forecast, by Types 2020 & 2033
- Table 12: Global Smart Spraying Revenue undefined Forecast, by Country 2020 & 2033
- Table 13: Brazil Smart Spraying Revenue (undefined) Forecast, by Application 2020 & 2033
- Table 14: Argentina Smart Spraying Revenue (undefined) Forecast, by Application 2020 & 2033
- Table 15: Rest of South America Smart Spraying Revenue (undefined) Forecast, by Application 2020 & 2033
- Table 16: Global Smart Spraying Revenue undefined Forecast, by Application 2020 & 2033
- Table 17: Global Smart Spraying Revenue undefined Forecast, by Types 2020 & 2033
- Table 18: Global Smart Spraying Revenue undefined Forecast, by Country 2020 & 2033
- Table 19: United Kingdom Smart Spraying Revenue (undefined) Forecast, by Application 2020 & 2033
- Table 20: Germany Smart Spraying Revenue (undefined) Forecast, by Application 2020 & 2033
- Table 21: France Smart Spraying Revenue (undefined) Forecast, by Application 2020 & 2033
- Table 22: Italy Smart Spraying Revenue (undefined) Forecast, by Application 2020 & 2033
- Table 23: Spain Smart Spraying Revenue (undefined) Forecast, by Application 2020 & 2033
- Table 24: Russia Smart Spraying Revenue (undefined) Forecast, by Application 2020 & 2033
- Table 25: Benelux Smart Spraying Revenue (undefined) Forecast, by Application 2020 & 2033
- Table 26: Nordics Smart Spraying Revenue (undefined) Forecast, by Application 2020 & 2033
- Table 27: Rest of Europe Smart Spraying Revenue (undefined) Forecast, by Application 2020 & 2033
- Table 28: Global Smart Spraying Revenue undefined Forecast, by Application 2020 & 2033
- Table 29: Global Smart Spraying Revenue undefined Forecast, by Types 2020 & 2033
- Table 30: Global Smart Spraying Revenue undefined Forecast, by Country 2020 & 2033
- Table 31: Turkey Smart Spraying Revenue (undefined) Forecast, by Application 2020 & 2033
- Table 32: Israel Smart Spraying Revenue (undefined) Forecast, by Application 2020 & 2033
- Table 33: GCC Smart Spraying Revenue (undefined) Forecast, by Application 2020 & 2033
- Table 34: North Africa Smart Spraying Revenue (undefined) Forecast, by Application 2020 & 2033
- Table 35: South Africa Smart Spraying Revenue (undefined) Forecast, by Application 2020 & 2033
- Table 36: Rest of Middle East & Africa Smart Spraying Revenue (undefined) Forecast, by Application 2020 & 2033
- Table 37: Global Smart Spraying Revenue undefined Forecast, by Application 2020 & 2033
- Table 38: Global Smart Spraying Revenue undefined Forecast, by Types 2020 & 2033
- Table 39: Global Smart Spraying Revenue undefined Forecast, by Country 2020 & 2033
- Table 40: China Smart Spraying Revenue (undefined) Forecast, by Application 2020 & 2033
- Table 41: India Smart Spraying Revenue (undefined) Forecast, by Application 2020 & 2033
- Table 42: Japan Smart Spraying Revenue (undefined) Forecast, by Application 2020 & 2033
- Table 43: South Korea Smart Spraying Revenue (undefined) Forecast, by Application 2020 & 2033
- Table 44: ASEAN Smart Spraying Revenue (undefined) Forecast, by Application 2020 & 2033
- Table 45: Oceania Smart Spraying Revenue (undefined) Forecast, by Application 2020 & 2033
- Table 46: Rest of Asia Pacific Smart Spraying Revenue (undefined) Forecast, by Application 2020 & 2033
Frequently Asked Questions
1. What is the projected Compound Annual Growth Rate (CAGR) of the Smart Spraying?
The projected CAGR is approximately 5.4%.
2. Which companies are prominent players in the Smart Spraying?
Key companies in the market include AGCO Corporation, Deere & Company, WEED-IT, Precision AI Inc, HARDI, Agrifac Machinery B.V., Ecorobotix SA, BA Pumps & Sprayers.
3. What are the main segments of the Smart Spraying?
The market segments include Application, Types.
4. Can you provide details about the market size?
The market size is estimated to be USD XXX N/A as of 2022.
5. What are some drivers contributing to market growth?
N/A
6. What are the notable trends driving market growth?
N/A
7. Are there any restraints impacting market growth?
N/A
8. Can you provide examples of recent developments in the market?
N/A
9. What pricing options are available for accessing the report?
Pricing options include single-user, multi-user, and enterprise licenses priced at USD 2900.00, USD 4350.00, and USD 5800.00 respectively.
10. Is the market size provided in terms of value or volume?
The market size is provided in terms of value, measured in N/A.
11. Are there any specific market keywords associated with the report?
Yes, the market keyword associated with the report is "Smart Spraying," which aids in identifying and referencing the specific market segment covered.
12. How do I determine which pricing option suits my needs best?
The pricing options vary based on user requirements and access needs. Individual users may opt for single-user licenses, while businesses requiring broader access may choose multi-user or enterprise licenses for cost-effective access to the report.
13. Are there any additional resources or data provided in the Smart Spraying report?
While the report offers comprehensive insights, it's advisable to review the specific contents or supplementary materials provided to ascertain if additional resources or data are available.
14. How can I stay updated on further developments or reports in the Smart Spraying?
To stay informed about further developments, trends, and reports in the Smart Spraying, consider subscribing to industry newsletters, following relevant companies and organizations, or regularly checking reputable industry news sources and publications.
Methodology
Step 1 - Identification of Relevant Samples Size from Population Database


Step 2 - Approaches for Defining Global Market Size (Value, Volume* & Price*)

Note*: In applicable scenarios
Step 3 - Data Sources
Primary Research
- Web Analytics
- Survey Reports
- Research Institute
- Latest Research Reports
- Opinion Leaders
Secondary Research
- Annual Reports
- White Paper
- Latest Press Release
- Industry Association
- Paid Database
- Investor Presentations

Step 4 - Data Triangulation
Involves using different sources of information in order to increase the validity of a study
These sources are likely to be stakeholders in a program - participants, other researchers, program staff, other community members, and so on.
Then we put all data in single framework & apply various statistical tools to find out the dynamic on the market.
During the analysis stage, feedback from the stakeholder groups would be compared to determine areas of agreement as well as areas of divergence