

Key Insights
The global transcriptomics market, valued at approximately $8.31 billion in 2025, is projected for substantial growth, exhibiting a compound annual growth rate (CAGR) of 6.3% from 2025 to 2033. This expansion is propelled by the increasing prevalence of chronic diseases, necessitating advanced diagnostic tools for disease profiling and personalized medicine. The adoption of high-throughput sequencing technologies, including next-generation sequencing (NGS), alongside declining costs, significantly fuels market growth. Advances in bioinformatics and data analysis further enhance the extraction of valuable insights from transcriptomic datasets. Leading companies like Illumina, Thermo Fisher Scientific, and Qiagen actively invest in research and development, fostering a competitive and innovative market. Segmentation highlights consumables as a key contributor, followed by instruments. Within applications, diagnostics and disease profiling lead, emphasizing the clinical relevance of transcriptomics.

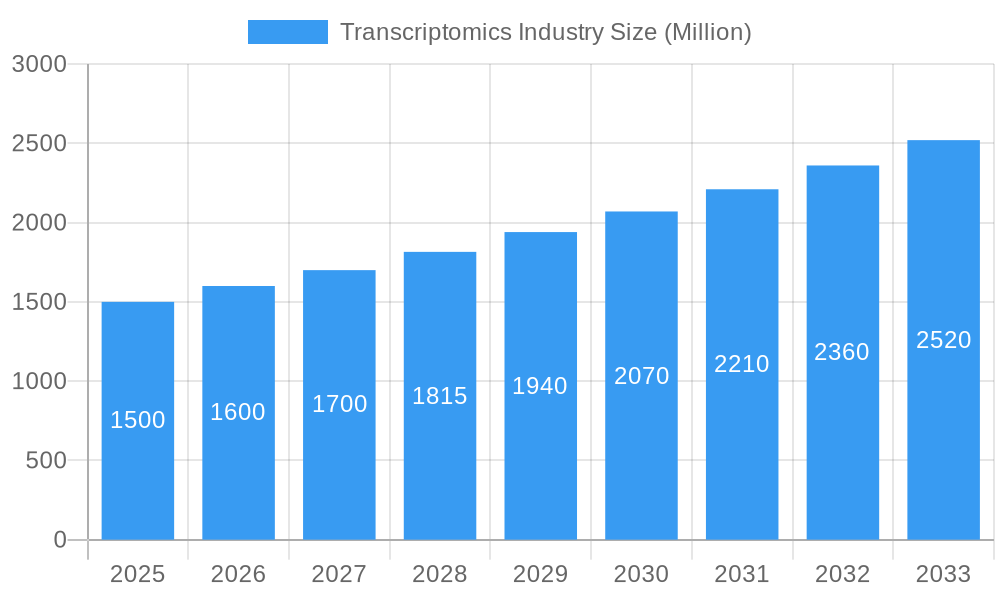
Transcriptomics Industry Market Size (In Billion)
North America dominates the transcriptomics market, driven by robust R&D investment and advanced healthcare infrastructure. Europe and the Asia-Pacific region are also experiencing notable growth due to increased healthcare spending and rising awareness of advanced diagnostics. Challenges include the cost of sophisticated transcriptomics technologies and complex data analysis. However, continuous technological innovation and the demand for personalized medicine are expected to sustain market growth. The development of novel analytical tools and AI integration in transcriptomics data analysis will be crucial drivers, expanding applications across drug discovery and agricultural biotechnology.
Transcriptomics Industry Company Market Share
Transcriptomics Industry Market Report: 2019-2033
This comprehensive report provides a detailed analysis of the global transcriptomics market, encompassing market dynamics, growth trends, regional segmentation, product landscape, key players, and future outlook. The study period covers 2019-2033, with 2025 as the base and estimated year. The forecast period extends from 2025 to 2033, while the historical period analyzed is 2019-2024. The report is essential for industry professionals, investors, and researchers seeking a thorough understanding of this rapidly evolving market. The total market size in 2025 is estimated at $XX Billion.
Transcriptomics Industry Market Dynamics & Structure
The transcriptomics market is characterized by a moderately concentrated landscape with several major players dominating the space. Technological innovation, particularly in sequencing technologies, is a key driver, while regulatory frameworks and reimbursement policies significantly influence market growth. The market faces competition from alternative technologies for gene expression analysis, and the increasing availability of data necessitates advanced bioinformatics tools. Mergers and acquisitions (M&A) are relatively frequent, reflecting the strategic importance of this sector.
- Market Concentration: The top five players hold an estimated xx% market share in 2025.
- Technological Innovation: Next-generation sequencing (NGS) and single-cell RNA sequencing are driving market expansion.
- Regulatory Landscape: Stringent regulatory approvals (e.g., FDA for diagnostics) impact market entry and product adoption.
- Competitive Substitutes: Microarrays and qPCR remain competitive alternatives, especially for specific applications.
- M&A Activity: An average of xx M&A deals were recorded annually during 2019-2024.
- End-User Demographics: Pharmaceutical and biotechnology companies, academic research institutions, and diagnostic laboratories are major end-users.
Transcriptomics Industry Growth Trends & Insights
The transcriptomics market is experiencing robust growth, driven by the increasing adoption of advanced technologies like NGS and single-cell RNA sequencing. The rising prevalence of chronic diseases, growing demand for personalized medicine, and increased research funding are fueling market expansion. Technological advancements continuously improve accuracy, throughput, and cost-effectiveness, further accelerating market adoption. The market is expected to witness a compound annual growth rate (CAGR) of xx% during the forecast period (2025-2033). This growth is largely driven by increased investment in R&D for new drug discovery and personalized medicine, alongside the growing use of transcriptomics in diagnostics. Market penetration is expected to increase from xx% in 2025 to xx% by 2033.
Dominant Regions, Countries, or Segments in Transcriptomics Industry
North America currently dominates the transcriptomics market, owing to its robust healthcare infrastructure, high research funding, and presence of major players. However, Asia-Pacific is projected to exhibit the highest growth rate due to increasing healthcare expenditure, rising prevalence of chronic diseases, and government initiatives promoting research and development.
By Technology: Sequencing technologies dominate, driven by higher throughput and data quality.
- Sequencing Technologies: High CAGR due to technological advancements and falling costs.
- Microarrays: Mature technology with stable market share, utilized for specific applications.
- Real-time Quantitative Polymerase Chain Reaction (Q-PCR): Remains relevant for targeted gene expression analysis.
By Product: Consumables represent a significant market share due to continuous demand.
- Consumables: High volume sales, essential for all transcriptomics technologies.
- Instruments: High initial investment cost, driving demand for high-throughput systems.
- Other Products: Includes software, data analysis tools, and services.
By Application: Diagnostics and disease profiling lead the market, driven by personalized medicine and biomarker discovery.
- Diagnostics and Disease Profiling: High growth potential owing to precision medicine applications.
- Drug Discovery: Essential for target identification and validation in pharmaceutical development.
- Other Applications: Includes basic research, agriculture, and environmental monitoring.
Transcriptomics Industry Product Landscape
The transcriptomics product landscape is constantly evolving, with manufacturers focusing on improving sequencing technologies, developing more sensitive and specific assays, and integrating bioinformatics tools for data analysis. Unique selling propositions often center around increased throughput, reduced costs, and improved data accuracy. Recent advancements include single-cell transcriptomics techniques, enabling a deeper understanding of cellular heterogeneity and gene expression profiles.
Key Drivers, Barriers & Challenges in Transcriptomics Industry
Key Drivers:
- Technological advancements (e.g., NGS, single-cell RNA sequencing).
- Increased funding for biomedical research and development.
- Rising prevalence of chronic diseases driving demand for diagnostics and personalized medicine.
- Growing adoption of precision medicine approaches.
Key Challenges:
- High cost of sequencing and data analysis.
- Complex data analysis and interpretation.
- Stringent regulatory requirements for diagnostic applications.
- Competition from alternative technologies.
- Supply chain disruptions impacting the availability of consumables.
Emerging Opportunities in Transcriptomics Industry
- Expansion of single-cell transcriptomics in diverse areas (e.g., oncology, immunology).
- Development of new biomarkers for early disease diagnosis.
- Integration of artificial intelligence and machine learning for data analysis.
- Growth of liquid biopsies for cancer detection and monitoring.
- Development of portable and point-of-care transcriptomics devices.
Growth Accelerators in the Transcriptomics Industry
The continued miniaturization and cost reduction of sequencing platforms, coupled with the development of user-friendly bioinformatics tools, will be major growth drivers. Strategic collaborations between technology providers and pharmaceutical companies will also accelerate market growth, enabling the development of new diagnostics and therapeutics. Expansion into emerging markets with growing healthcare infrastructure will further fuel market expansion.
Key Players Shaping the Transcriptomics Industry Market
- Natera Inc
- Promega Corporation
- Bio-Rad Laboratories Inc
- Merck KGaA
- GE Healthcare
- BGI Genomics
- Thermo Fisher Scientific
- F Hoffmann-La Roche AG
- Agilent Technologies Inc
- 10x Genomics
- PerkinElmer Inc
- Qiagen NV
- Illumina Inc
- Fluidigm Corporation
- Dovetail Genomics
Notable Milestones in Transcriptomics Industry Sector
- May 2022: BioSkryb Genomics launched the Early Access Program (EAP) for ResolveOME, a unified single-cell workflow.
- January 2022: Parse Biosciences partnered with Research Instruments Pte Ltd to distribute its single-cell sequencing kits in Southeast Asia.
In-Depth Transcriptomics Industry Market Outlook
The transcriptomics market is poised for continued expansion, driven by technological innovation, rising healthcare expenditure, and the growing demand for personalized medicine. Strategic partnerships and collaborations will play a vital role in driving market growth, enabling the development of novel diagnostic and therapeutic applications. The market's future potential is significant, with continued opportunities for innovation and expansion across various applications and regions.
Transcriptomics Industry Segmentation
-
1. Technology
- 1.1. Microarray
- 1.2. Real-tim
- 1.3. Sequencing Technologies
-
2. Product
- 2.1. Consumables
- 2.2. Instruments
- 2.3. Other Products
-
3. Application
- 3.1. Diagnostics and Disease Profiling
- 3.2. Drug Discovery
- 3.3. Other Applications
Transcriptomics Industry Segmentation By Geography
-
1. North America
- 1.1. United States
- 1.2. Canada
- 1.3. Mexico
-
2. Europe
- 2.1. Germany
- 2.2. United Kingdom
- 2.3. France
- 2.4. Italy
- 2.5. Spain
- 2.6. Rest of Europe
-
3. Asia Pacific
- 3.1. China
- 3.2. Japan
- 3.3. India
- 3.4. Australia
- 3.5. South Korea
- 3.6. Rest of Asia Pacific
-
4. Middle East and Africa
- 4.1. GCC
- 4.2. South Africa
- 4.3. Rest of Middle East and Africa
-
5. South America
- 5.1. Brazil
- 5.2. Argentina
- 5.3. Rest of South America

Transcriptomics Industry Regional Market Share
Geographic Coverage of Transcriptomics Industry
Transcriptomics Industry REPORT HIGHLIGHTS
| Aspects | Details |
|---|---|
| Study Period | 2020-2034 |
| Base Year | 2025 |
| Estimated Year | 2026 |
| Forecast Period | 2026-2034 |
| Historical Period | 2020-2025 |
| Growth Rate | CAGR of 6.3% from 2020-2034 |
| Segmentation |
|
Table of Contents
- 1. Introduction
- 1.1. Research Scope
- 1.2. Market Segmentation
- 1.3. Research Methodology
- 1.4. Definitions and Assumptions
- 2. Executive Summary
- 2.1. Introduction
- 3. Market Dynamics
- 3.1. Introduction
- 3.2. Market Drivers
- 3.2.1. Increasing Research and Development in Transciptomics; Increasing Prevalence of Chronic Illnesses; Increase in Applications of Transcriptomics
- 3.3. Market Restrains
- 3.3.1. Lack of Awareness Regarding the Technology; Stringent Regulatory Policies
- 3.4. Market Trends
- 3.4.1. Diagnostics and Disease Profiling is Expected to Witness Growth Over The Forecast Period
- 4. Market Factor Analysis
- 4.1. Porters Five Forces
- 4.2. Supply/Value Chain
- 4.3. PESTEL analysis
- 4.4. Market Entropy
- 4.5. Patent/Trademark Analysis
- 5. Global Transcriptomics Industry Analysis, Insights and Forecast, 2020-2032
- 5.1. Market Analysis, Insights and Forecast - by Technology
- 5.1.1. Microarray
- 5.1.2. Real-tim
- 5.1.3. Sequencing Technologies
- 5.2. Market Analysis, Insights and Forecast - by Product
- 5.2.1. Consumables
- 5.2.2. Instruments
- 5.2.3. Other Products
- 5.3. Market Analysis, Insights and Forecast - by Application
- 5.3.1. Diagnostics and Disease Profiling
- 5.3.2. Drug Discovery
- 5.3.3. Other Applications
- 5.4. Market Analysis, Insights and Forecast - by Region
- 5.4.1. North America
- 5.4.2. Europe
- 5.4.3. Asia Pacific
- 5.4.4. Middle East and Africa
- 5.4.5. South America
- 5.1. Market Analysis, Insights and Forecast - by Technology
- 6. North America Transcriptomics Industry Analysis, Insights and Forecast, 2020-2032
- 6.1. Market Analysis, Insights and Forecast - by Technology
- 6.1.1. Microarray
- 6.1.2. Real-tim
- 6.1.3. Sequencing Technologies
- 6.2. Market Analysis, Insights and Forecast - by Product
- 6.2.1. Consumables
- 6.2.2. Instruments
- 6.2.3. Other Products
- 6.3. Market Analysis, Insights and Forecast - by Application
- 6.3.1. Diagnostics and Disease Profiling
- 6.3.2. Drug Discovery
- 6.3.3. Other Applications
- 6.1. Market Analysis, Insights and Forecast - by Technology
- 7. Europe Transcriptomics Industry Analysis, Insights and Forecast, 2020-2032
- 7.1. Market Analysis, Insights and Forecast - by Technology
- 7.1.1. Microarray
- 7.1.2. Real-tim
- 7.1.3. Sequencing Technologies
- 7.2. Market Analysis, Insights and Forecast - by Product
- 7.2.1. Consumables
- 7.2.2. Instruments
- 7.2.3. Other Products
- 7.3. Market Analysis, Insights and Forecast - by Application
- 7.3.1. Diagnostics and Disease Profiling
- 7.3.2. Drug Discovery
- 7.3.3. Other Applications
- 7.1. Market Analysis, Insights and Forecast - by Technology
- 8. Asia Pacific Transcriptomics Industry Analysis, Insights and Forecast, 2020-2032
- 8.1. Market Analysis, Insights and Forecast - by Technology
- 8.1.1. Microarray
- 8.1.2. Real-tim
- 8.1.3. Sequencing Technologies
- 8.2. Market Analysis, Insights and Forecast - by Product
- 8.2.1. Consumables
- 8.2.2. Instruments
- 8.2.3. Other Products
- 8.3. Market Analysis, Insights and Forecast - by Application
- 8.3.1. Diagnostics and Disease Profiling
- 8.3.2. Drug Discovery
- 8.3.3. Other Applications
- 8.1. Market Analysis, Insights and Forecast - by Technology
- 9. Middle East and Africa Transcriptomics Industry Analysis, Insights and Forecast, 2020-2032
- 9.1. Market Analysis, Insights and Forecast - by Technology
- 9.1.1. Microarray
- 9.1.2. Real-tim
- 9.1.3. Sequencing Technologies
- 9.2. Market Analysis, Insights and Forecast - by Product
- 9.2.1. Consumables
- 9.2.2. Instruments
- 9.2.3. Other Products
- 9.3. Market Analysis, Insights and Forecast - by Application
- 9.3.1. Diagnostics and Disease Profiling
- 9.3.2. Drug Discovery
- 9.3.3. Other Applications
- 9.1. Market Analysis, Insights and Forecast - by Technology
- 10. South America Transcriptomics Industry Analysis, Insights and Forecast, 2020-2032
- 10.1. Market Analysis, Insights and Forecast - by Technology
- 10.1.1. Microarray
- 10.1.2. Real-tim
- 10.1.3. Sequencing Technologies
- 10.2. Market Analysis, Insights and Forecast - by Product
- 10.2.1. Consumables
- 10.2.2. Instruments
- 10.2.3. Other Products
- 10.3. Market Analysis, Insights and Forecast - by Application
- 10.3.1. Diagnostics and Disease Profiling
- 10.3.2. Drug Discovery
- 10.3.3. Other Applications
- 10.1. Market Analysis, Insights and Forecast - by Technology
- 11. Competitive Analysis
- 11.1. Global Market Share Analysis 2025
- 11.2. Company Profiles
- 11.2.1 Natera Inc
- 11.2.1.1. Overview
- 11.2.1.2. Products
- 11.2.1.3. SWOT Analysis
- 11.2.1.4. Recent Developments
- 11.2.1.5. Financials (Based on Availability)
- 11.2.2 Promega Corporation
- 11.2.2.1. Overview
- 11.2.2.2. Products
- 11.2.2.3. SWOT Analysis
- 11.2.2.4. Recent Developments
- 11.2.2.5. Financials (Based on Availability)
- 11.2.3 Bio-Rad Laboratories Inc
- 11.2.3.1. Overview
- 11.2.3.2. Products
- 11.2.3.3. SWOT Analysis
- 11.2.3.4. Recent Developments
- 11.2.3.5. Financials (Based on Availability)
- 11.2.4 Merck KGaA
- 11.2.4.1. Overview
- 11.2.4.2. Products
- 11.2.4.3. SWOT Analysis
- 11.2.4.4. Recent Developments
- 11.2.4.5. Financials (Based on Availability)
- 11.2.5 GE Healthcare
- 11.2.5.1. Overview
- 11.2.5.2. Products
- 11.2.5.3. SWOT Analysis
- 11.2.5.4. Recent Developments
- 11.2.5.5. Financials (Based on Availability)
- 11.2.6 BGI Genomics
- 11.2.6.1. Overview
- 11.2.6.2. Products
- 11.2.6.3. SWOT Analysis
- 11.2.6.4. Recent Developments
- 11.2.6.5. Financials (Based on Availability)
- 11.2.7 Thermo Fisher Scientific*List Not Exhaustive
- 11.2.7.1. Overview
- 11.2.7.2. Products
- 11.2.7.3. SWOT Analysis
- 11.2.7.4. Recent Developments
- 11.2.7.5. Financials (Based on Availability)
- 11.2.8 F Hoffmann-La Roche AG
- 11.2.8.1. Overview
- 11.2.8.2. Products
- 11.2.8.3. SWOT Analysis
- 11.2.8.4. Recent Developments
- 11.2.8.5. Financials (Based on Availability)
- 11.2.9 Agilent Technologies Inc
- 11.2.9.1. Overview
- 11.2.9.2. Products
- 11.2.9.3. SWOT Analysis
- 11.2.9.4. Recent Developments
- 11.2.9.5. Financials (Based on Availability)
- 11.2.10 10x Genomics
- 11.2.10.1. Overview
- 11.2.10.2. Products
- 11.2.10.3. SWOT Analysis
- 11.2.10.4. Recent Developments
- 11.2.10.5. Financials (Based on Availability)
- 11.2.11 PerkinElmer Inc
- 11.2.11.1. Overview
- 11.2.11.2. Products
- 11.2.11.3. SWOT Analysis
- 11.2.11.4. Recent Developments
- 11.2.11.5. Financials (Based on Availability)
- 11.2.12 Qiagen NV
- 11.2.12.1. Overview
- 11.2.12.2. Products
- 11.2.12.3. SWOT Analysis
- 11.2.12.4. Recent Developments
- 11.2.12.5. Financials (Based on Availability)
- 11.2.13 Illumina Inc
- 11.2.13.1. Overview
- 11.2.13.2. Products
- 11.2.13.3. SWOT Analysis
- 11.2.13.4. Recent Developments
- 11.2.13.5. Financials (Based on Availability)
- 11.2.14 Fluidigm Corporation
- 11.2.14.1. Overview
- 11.2.14.2. Products
- 11.2.14.3. SWOT Analysis
- 11.2.14.4. Recent Developments
- 11.2.14.5. Financials (Based on Availability)
- 11.2.15 Dovetail Genomics
- 11.2.15.1. Overview
- 11.2.15.2. Products
- 11.2.15.3. SWOT Analysis
- 11.2.15.4. Recent Developments
- 11.2.15.5. Financials (Based on Availability)
- 11.2.1 Natera Inc
List of Figures
- Figure 1: Global Transcriptomics Industry Revenue Breakdown (billion, %) by Region 2025 & 2033
- Figure 2: North America Transcriptomics Industry Revenue (billion), by Technology 2025 & 2033
- Figure 3: North America Transcriptomics Industry Revenue Share (%), by Technology 2025 & 2033
- Figure 4: North America Transcriptomics Industry Revenue (billion), by Product 2025 & 2033
- Figure 5: North America Transcriptomics Industry Revenue Share (%), by Product 2025 & 2033
- Figure 6: North America Transcriptomics Industry Revenue (billion), by Application 2025 & 2033
- Figure 7: North America Transcriptomics Industry Revenue Share (%), by Application 2025 & 2033
- Figure 8: North America Transcriptomics Industry Revenue (billion), by Country 2025 & 2033
- Figure 9: North America Transcriptomics Industry Revenue Share (%), by Country 2025 & 2033
- Figure 10: Europe Transcriptomics Industry Revenue (billion), by Technology 2025 & 2033
- Figure 11: Europe Transcriptomics Industry Revenue Share (%), by Technology 2025 & 2033
- Figure 12: Europe Transcriptomics Industry Revenue (billion), by Product 2025 & 2033
- Figure 13: Europe Transcriptomics Industry Revenue Share (%), by Product 2025 & 2033
- Figure 14: Europe Transcriptomics Industry Revenue (billion), by Application 2025 & 2033
- Figure 15: Europe Transcriptomics Industry Revenue Share (%), by Application 2025 & 2033
- Figure 16: Europe Transcriptomics Industry Revenue (billion), by Country 2025 & 2033
- Figure 17: Europe Transcriptomics Industry Revenue Share (%), by Country 2025 & 2033
- Figure 18: Asia Pacific Transcriptomics Industry Revenue (billion), by Technology 2025 & 2033
- Figure 19: Asia Pacific Transcriptomics Industry Revenue Share (%), by Technology 2025 & 2033
- Figure 20: Asia Pacific Transcriptomics Industry Revenue (billion), by Product 2025 & 2033
- Figure 21: Asia Pacific Transcriptomics Industry Revenue Share (%), by Product 2025 & 2033
- Figure 22: Asia Pacific Transcriptomics Industry Revenue (billion), by Application 2025 & 2033
- Figure 23: Asia Pacific Transcriptomics Industry Revenue Share (%), by Application 2025 & 2033
- Figure 24: Asia Pacific Transcriptomics Industry Revenue (billion), by Country 2025 & 2033
- Figure 25: Asia Pacific Transcriptomics Industry Revenue Share (%), by Country 2025 & 2033
- Figure 26: Middle East and Africa Transcriptomics Industry Revenue (billion), by Technology 2025 & 2033
- Figure 27: Middle East and Africa Transcriptomics Industry Revenue Share (%), by Technology 2025 & 2033
- Figure 28: Middle East and Africa Transcriptomics Industry Revenue (billion), by Product 2025 & 2033
- Figure 29: Middle East and Africa Transcriptomics Industry Revenue Share (%), by Product 2025 & 2033
- Figure 30: Middle East and Africa Transcriptomics Industry Revenue (billion), by Application 2025 & 2033
- Figure 31: Middle East and Africa Transcriptomics Industry Revenue Share (%), by Application 2025 & 2033
- Figure 32: Middle East and Africa Transcriptomics Industry Revenue (billion), by Country 2025 & 2033
- Figure 33: Middle East and Africa Transcriptomics Industry Revenue Share (%), by Country 2025 & 2033
- Figure 34: South America Transcriptomics Industry Revenue (billion), by Technology 2025 & 2033
- Figure 35: South America Transcriptomics Industry Revenue Share (%), by Technology 2025 & 2033
- Figure 36: South America Transcriptomics Industry Revenue (billion), by Product 2025 & 2033
- Figure 37: South America Transcriptomics Industry Revenue Share (%), by Product 2025 & 2033
- Figure 38: South America Transcriptomics Industry Revenue (billion), by Application 2025 & 2033
- Figure 39: South America Transcriptomics Industry Revenue Share (%), by Application 2025 & 2033
- Figure 40: South America Transcriptomics Industry Revenue (billion), by Country 2025 & 2033
- Figure 41: South America Transcriptomics Industry Revenue Share (%), by Country 2025 & 2033
List of Tables
- Table 1: Global Transcriptomics Industry Revenue billion Forecast, by Technology 2020 & 2033
- Table 2: Global Transcriptomics Industry Revenue billion Forecast, by Product 2020 & 2033
- Table 3: Global Transcriptomics Industry Revenue billion Forecast, by Application 2020 & 2033
- Table 4: Global Transcriptomics Industry Revenue billion Forecast, by Region 2020 & 2033
- Table 5: Global Transcriptomics Industry Revenue billion Forecast, by Technology 2020 & 2033
- Table 6: Global Transcriptomics Industry Revenue billion Forecast, by Product 2020 & 2033
- Table 7: Global Transcriptomics Industry Revenue billion Forecast, by Application 2020 & 2033
- Table 8: Global Transcriptomics Industry Revenue billion Forecast, by Country 2020 & 2033
- Table 9: United States Transcriptomics Industry Revenue (billion) Forecast, by Application 2020 & 2033
- Table 10: Canada Transcriptomics Industry Revenue (billion) Forecast, by Application 2020 & 2033
- Table 11: Mexico Transcriptomics Industry Revenue (billion) Forecast, by Application 2020 & 2033
- Table 12: Global Transcriptomics Industry Revenue billion Forecast, by Technology 2020 & 2033
- Table 13: Global Transcriptomics Industry Revenue billion Forecast, by Product 2020 & 2033
- Table 14: Global Transcriptomics Industry Revenue billion Forecast, by Application 2020 & 2033
- Table 15: Global Transcriptomics Industry Revenue billion Forecast, by Country 2020 & 2033
- Table 16: Germany Transcriptomics Industry Revenue (billion) Forecast, by Application 2020 & 2033
- Table 17: United Kingdom Transcriptomics Industry Revenue (billion) Forecast, by Application 2020 & 2033
- Table 18: France Transcriptomics Industry Revenue (billion) Forecast, by Application 2020 & 2033
- Table 19: Italy Transcriptomics Industry Revenue (billion) Forecast, by Application 2020 & 2033
- Table 20: Spain Transcriptomics Industry Revenue (billion) Forecast, by Application 2020 & 2033
- Table 21: Rest of Europe Transcriptomics Industry Revenue (billion) Forecast, by Application 2020 & 2033
- Table 22: Global Transcriptomics Industry Revenue billion Forecast, by Technology 2020 & 2033
- Table 23: Global Transcriptomics Industry Revenue billion Forecast, by Product 2020 & 2033
- Table 24: Global Transcriptomics Industry Revenue billion Forecast, by Application 2020 & 2033
- Table 25: Global Transcriptomics Industry Revenue billion Forecast, by Country 2020 & 2033
- Table 26: China Transcriptomics Industry Revenue (billion) Forecast, by Application 2020 & 2033
- Table 27: Japan Transcriptomics Industry Revenue (billion) Forecast, by Application 2020 & 2033
- Table 28: India Transcriptomics Industry Revenue (billion) Forecast, by Application 2020 & 2033
- Table 29: Australia Transcriptomics Industry Revenue (billion) Forecast, by Application 2020 & 2033
- Table 30: South Korea Transcriptomics Industry Revenue (billion) Forecast, by Application 2020 & 2033
- Table 31: Rest of Asia Pacific Transcriptomics Industry Revenue (billion) Forecast, by Application 2020 & 2033
- Table 32: Global Transcriptomics Industry Revenue billion Forecast, by Technology 2020 & 2033
- Table 33: Global Transcriptomics Industry Revenue billion Forecast, by Product 2020 & 2033
- Table 34: Global Transcriptomics Industry Revenue billion Forecast, by Application 2020 & 2033
- Table 35: Global Transcriptomics Industry Revenue billion Forecast, by Country 2020 & 2033
- Table 36: GCC Transcriptomics Industry Revenue (billion) Forecast, by Application 2020 & 2033
- Table 37: South Africa Transcriptomics Industry Revenue (billion) Forecast, by Application 2020 & 2033
- Table 38: Rest of Middle East and Africa Transcriptomics Industry Revenue (billion) Forecast, by Application 2020 & 2033
- Table 39: Global Transcriptomics Industry Revenue billion Forecast, by Technology 2020 & 2033
- Table 40: Global Transcriptomics Industry Revenue billion Forecast, by Product 2020 & 2033
- Table 41: Global Transcriptomics Industry Revenue billion Forecast, by Application 2020 & 2033
- Table 42: Global Transcriptomics Industry Revenue billion Forecast, by Country 2020 & 2033
- Table 43: Brazil Transcriptomics Industry Revenue (billion) Forecast, by Application 2020 & 2033
- Table 44: Argentina Transcriptomics Industry Revenue (billion) Forecast, by Application 2020 & 2033
- Table 45: Rest of South America Transcriptomics Industry Revenue (billion) Forecast, by Application 2020 & 2033
Frequently Asked Questions
1. What is the projected Compound Annual Growth Rate (CAGR) of the Transcriptomics Industry?
The projected CAGR is approximately 6.3%.
2. Which companies are prominent players in the Transcriptomics Industry?
Key companies in the market include Natera Inc, Promega Corporation, Bio-Rad Laboratories Inc, Merck KGaA, GE Healthcare, BGI Genomics, Thermo Fisher Scientific*List Not Exhaustive, F Hoffmann-La Roche AG, Agilent Technologies Inc, 10x Genomics, PerkinElmer Inc, Qiagen NV, Illumina Inc, Fluidigm Corporation, Dovetail Genomics.
3. What are the main segments of the Transcriptomics Industry?
The market segments include Technology, Product, Application.
4. Can you provide details about the market size?
The market size is estimated to be USD 8.31 billion as of 2022.
5. What are some drivers contributing to market growth?
Increasing Research and Development in Transciptomics; Increasing Prevalence of Chronic Illnesses; Increase in Applications of Transcriptomics.
6. What are the notable trends driving market growth?
Diagnostics and Disease Profiling is Expected to Witness Growth Over The Forecast Period.
7. Are there any restraints impacting market growth?
Lack of Awareness Regarding the Technology; Stringent Regulatory Policies.
8. Can you provide examples of recent developments in the market?
In May 2022, BioSkryb Genomics launched the Early Access Program (EAP) for ResolveOME. This unified, single-cell workflow amplifies the complete genome and full-length mRNA transcripts of the entire transcriptome from the same cell.
9. What pricing options are available for accessing the report?
Pricing options include single-user, multi-user, and enterprise licenses priced at USD 4750, USD 5250, and USD 8750 respectively.
10. Is the market size provided in terms of value or volume?
The market size is provided in terms of value, measured in billion.
11. Are there any specific market keywords associated with the report?
Yes, the market keyword associated with the report is "Transcriptomics Industry," which aids in identifying and referencing the specific market segment covered.
12. How do I determine which pricing option suits my needs best?
The pricing options vary based on user requirements and access needs. Individual users may opt for single-user licenses, while businesses requiring broader access may choose multi-user or enterprise licenses for cost-effective access to the report.
13. Are there any additional resources or data provided in the Transcriptomics Industry report?
While the report offers comprehensive insights, it's advisable to review the specific contents or supplementary materials provided to ascertain if additional resources or data are available.
14. How can I stay updated on further developments or reports in the Transcriptomics Industry?
To stay informed about further developments, trends, and reports in the Transcriptomics Industry, consider subscribing to industry newsletters, following relevant companies and organizations, or regularly checking reputable industry news sources and publications.
Methodology
Step 1 - Identification of Relevant Samples Size from Population Database


Step 2 - Approaches for Defining Global Market Size (Value, Volume* & Price*)

Note*: In applicable scenarios
Step 3 - Data Sources
Primary Research
- Web Analytics
- Survey Reports
- Research Institute
- Latest Research Reports
- Opinion Leaders
Secondary Research
- Annual Reports
- White Paper
- Latest Press Release
- Industry Association
- Paid Database
- Investor Presentations

Step 4 - Data Triangulation
Involves using different sources of information in order to increase the validity of a study
These sources are likely to be stakeholders in a program - participants, other researchers, program staff, other community members, and so on.
Then we put all data in single framework & apply various statistical tools to find out the dynamic on the market.
During the analysis stage, feedback from the stakeholder groups would be compared to determine areas of agreement as well as areas of divergence