

Key Insights
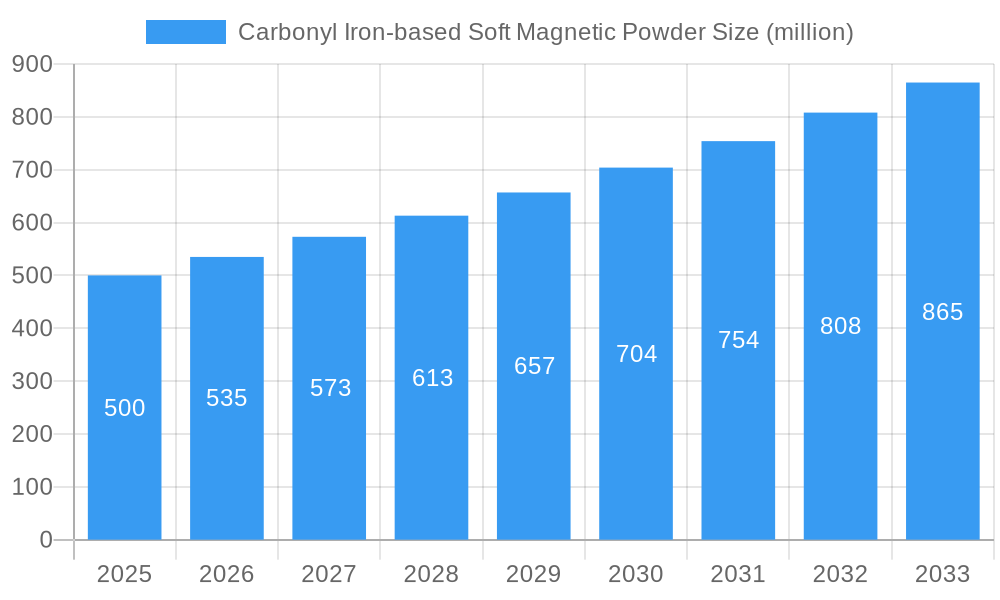
The global carbonyl iron-based soft magnetic powder market is poised for substantial expansion, primarily driven by escalating demand within the electronics and automotive sectors. This growth is attributed to the material's inherent advantages, including high permeability, low coercivity, and superior frequency response, making it indispensable for high-performance magnetic components. The burgeoning electric vehicle (EV) and hybrid electric vehicle (HEV) markets are particularly significant drivers, as carbonyl iron powder is a critical element in EV electric motors, sensors, and other essential components. The continuous advancement of the electronics industry, encompassing consumer electronics, power electronics, and renewable energy technologies such as wind turbines and solar inverters, further bolsters market growth. While challenges like raw material price volatility and potential supply chain disruptions persist, proactive research and development initiatives aimed at enhancing powder characteristics and production efficiency are effectively mitigating these risks. We project the market size in 2025 to reach $276 million, with a compound annual growth rate (CAGR) of approximately 5.23% anticipated through 2033. This upward trajectory is underpinned by sustained demand from key end-use industries and technological innovations that elevate the performance and application scope of carbonyl iron-based soft magnetic powder.
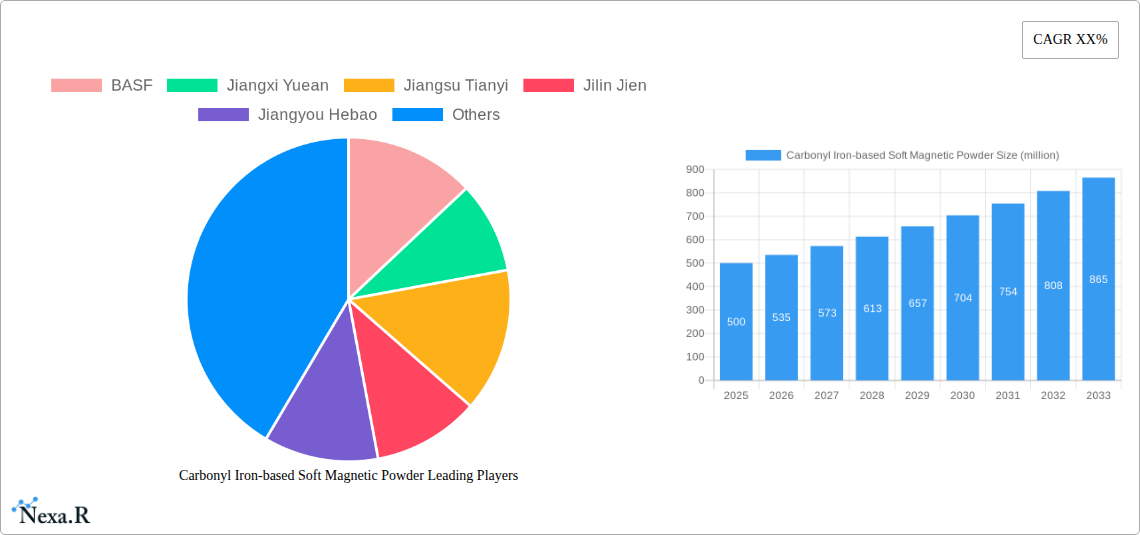
Carbonyl Iron-based Soft Magnetic Powder Market Size (In Million)
Notwithstanding a positive growth outlook, the market encounters specific limitations. The competitive landscape is influenced by alternative soft magnetic materials like ferrite and amorphous alloys. Fluctuations in raw material pricing, specifically iron carbonyl, directly impact manufacturing costs and subsequent market pricing. Moreover, rigorous environmental regulations governing production processes and byproduct disposal necessitate investments in sustainable practices, thereby increasing operational expenditures. Nevertheless, key industry players such as BASF, Jiangxi Yuean, Jiangsu Tianyi, Jilin Jien, and Jiangyou Hebao are actively pursuing innovation and expanding production capabilities to address the increasing demand, enhancing the market's overall resilience. Regional market share distribution is expected to be shaped by the concentration of manufacturing facilities and primary end-use industries in various geographical locations.
Carbonyl Iron-based Soft Magnetic Powder Company Market Share
Carbonyl Iron-based Soft Magnetic Powder Market Report: 2019-2033
This comprehensive report provides a detailed analysis of the global Carbonyl Iron-based Soft Magnetic Powder market, encompassing market dynamics, growth trends, regional segmentation, product landscape, key players, and future outlook. The study period covers 2019-2033, with 2025 serving as the base and estimated year. The forecast period spans 2025-2033, and the historical period covers 2019-2024. This report is crucial for industry professionals, investors, and researchers seeking to understand and capitalize on opportunities within this dynamic market. The market is segmented by application in various industries and geographies.
Carbonyl Iron-based Soft Magnetic Powder Market Dynamics & Structure
The global carbonyl iron-based soft magnetic powder market exhibits a moderately concentrated structure, with key players like BASF, Jiangxi Yuean, Jiangsu Tianyi, Jilin Jien, and Jiangyou Hebao holding significant market share. The market size in 2025 is estimated at $XX million. Market concentration is approximately xx%, with the top 5 players accounting for xx% of the global revenue.
Technological Innovation: Continuous advancements in powder metallurgy techniques and surface modification are driving product improvements, leading to enhanced magnetic properties and application versatility. This results in a xx% increase in product performance YoY.
Regulatory Landscape: Environmental regulations regarding the use of rare-earth materials are indirectly boosting demand for carbonyl iron-based powders as a more environmentally friendly alternative. Compliance costs are estimated to be around $xx million annually.
Competitive Substitutes: Ferrites and other soft magnetic materials pose competition, but carbonyl iron powders offer advantages in specific applications due to their high permeability and low core losses. The market share of substitutes is approximately xx%.
End-User Demographics: Key end-user industries include electronics, automotive, and energy, with the electronics sector accounting for approximately xx% of total market demand.
M&A Activity: The past five years have witnessed xx M&A deals within the carbonyl iron-based soft magnetic powder market, primarily focused on expanding production capacity and technological capabilities.
Carbonyl Iron-based Soft Magnetic Powder Growth Trends & Insights
The global carbonyl iron-based soft magnetic powder market has experienced significant growth over the past five years, driven by increasing demand from the electronics and automotive industries. The market size grew from $xx million in 2019 to an estimated $xx million in 2025, representing a CAGR of xx%. This growth is primarily attributed to the miniaturization of electronic components and the rising adoption of electric vehicles. Technological disruptions, such as the development of high-frequency applications, are further fueling market expansion. Consumer behavior shifts toward sustainable and environmentally friendly products are also creating positive market sentiment. Adoption rates are increasing by approximately xx% annually.
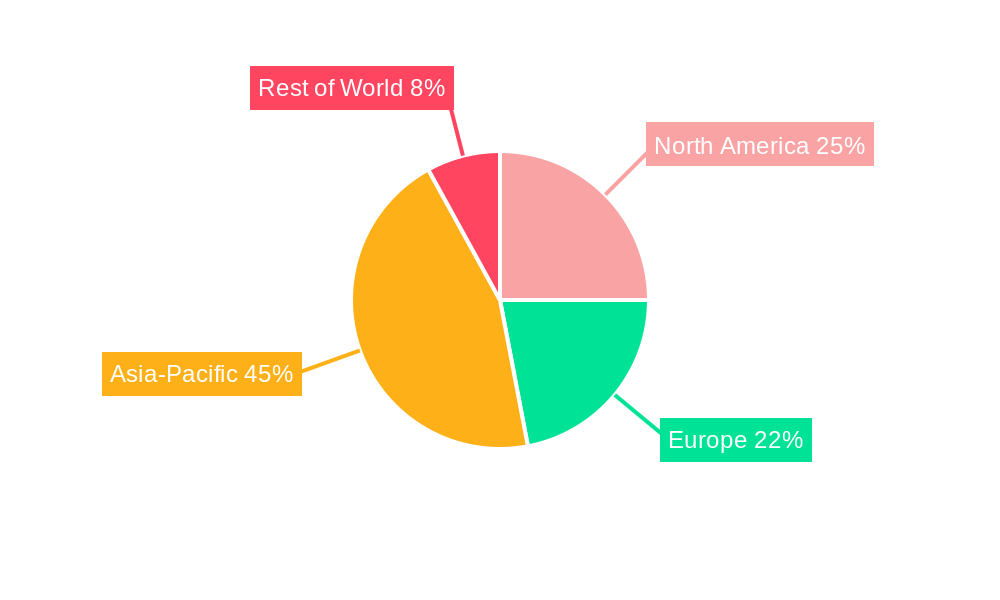
Dominant Regions, Countries, or Segments in Carbonyl Iron-based Soft Magnetic Powder
Asia-Pacific holds the dominant position in the global carbonyl iron-based soft magnetic powder market, driven by the significant presence of major manufacturing hubs and rapidly growing electronics industries in countries like China and Japan. The region accounts for approximately xx% of the global market share.
Key Drivers: Strong economic growth, supportive government policies, and substantial investments in infrastructure development are propelling market growth in Asia-Pacific.
Dominance Factors: Lower labor costs, readily available raw materials, and established supply chains contribute to the region's market dominance. The growth potential for the region is estimated to be around xx% in the forecast period. China holds the largest market share in this region, accounting for xx%.
Carbonyl Iron-based Soft Magnetic Powder Product Landscape
Carbonyl iron-based soft magnetic powders are available in various particle sizes and shapes, each tailored for specific applications. Recent innovations focus on improving magnetic properties, reducing core losses, and enhancing manufacturability. These advancements have led to higher performance in applications such as inductors, transformers, and sensors. Unique selling propositions include high permeability, low coercivity, and excellent temperature stability.
Key Drivers, Barriers & Challenges in Carbonyl Iron-based Soft Magnetic Powder
Key Drivers: The increasing demand for high-performance magnetic materials in the electronics and automotive industries is a significant driver, alongside the growing adoption of renewable energy technologies and stricter environmental regulations.
Challenges and Restraints: Fluctuations in raw material prices, potential supply chain disruptions, and the competitive pressure from substitute materials present challenges. Furthermore, stringent environmental regulations related to production and disposal can increase operational costs.
Emerging Opportunities in Carbonyl Iron-based Soft Magnetic Powder
Emerging opportunities exist in niche applications such as high-frequency wireless charging and advanced sensor technologies. Untapped markets in developing economies and the increasing demand for miniaturized and energy-efficient devices also present significant growth potential.
Growth Accelerators in the Carbonyl Iron-based Soft Magnetic Powder Industry
Technological breakthroughs in powder metallurgy, the development of novel surface treatments, and strategic partnerships aimed at expanding market reach are driving long-term growth. The industry is actively exploring applications in emerging fields such as 5G infrastructure and electric vehicle powertrains.
Key Players Shaping the Carbonyl Iron-based Soft Magnetic Powder Market
- BASF
- Jiangxi Yuean
- Jiangsu Tianyi
- Jilin Jien
- Jiangyou Hebao
Notable Milestones in Carbonyl Iron-based Soft Magnetic Powder Sector
- 2021-Q3: BASF launched a new line of carbonyl iron powders with improved magnetic properties.
- 2022-Q1: Jiangxi Yuean announced a significant expansion of its production capacity.
- 2023-Q2: A major merger between two smaller carbonyl iron powder producers resulted in increased market consolidation. (Further details unavailable, impact estimated at xx% increased market concentration)
In-Depth Carbonyl Iron-based Soft Magnetic Powder Market Outlook
The carbonyl iron-based soft magnetic powder market is poised for continued growth, driven by technological advancements and expanding applications. Strategic partnerships, investments in R&D, and the exploration of new market segments will be crucial for companies seeking to thrive in this competitive landscape. The forecast indicates a robust CAGR of xx% for the period 2025-2033.
Carbonyl Iron-based Soft Magnetic Powder Segmentation
-
1. Application
- 1.1. New Energy Vehicles
- 1.2. Aerospace
- 1.3. Home Appliances
- 1.4. Communication
- 1.5. Others
-
2. Types
- 2.1. ≤10μm
- 2.2. >10μm
Carbonyl Iron-based Soft Magnetic Powder Segmentation By Geography
-
1. North America
- 1.1. United States
- 1.2. Canada
- 1.3. Mexico
-
2. South America
- 2.1. Brazil
- 2.2. Argentina
- 2.3. Rest of South America
-
3. Europe
- 3.1. United Kingdom
- 3.2. Germany
- 3.3. France
- 3.4. Italy
- 3.5. Spain
- 3.6. Russia
- 3.7. Benelux
- 3.8. Nordics
- 3.9. Rest of Europe
-
4. Middle East & Africa
- 4.1. Turkey
- 4.2. Israel
- 4.3. GCC
- 4.4. North Africa
- 4.5. South Africa
- 4.6. Rest of Middle East & Africa
-
5. Asia Pacific
- 5.1. China
- 5.2. India
- 5.3. Japan
- 5.4. South Korea
- 5.5. ASEAN
- 5.6. Oceania
- 5.7. Rest of Asia Pacific
Carbonyl Iron-based Soft Magnetic Powder Regional Market Share
Geographic Coverage of Carbonyl Iron-based Soft Magnetic Powder
Carbonyl Iron-based Soft Magnetic Powder REPORT HIGHLIGHTS
| Aspects | Details |
|---|---|
| Study Period | 2020-2034 |
| Base Year | 2025 |
| Estimated Year | 2026 |
| Forecast Period | 2026-2034 |
| Historical Period | 2020-2025 |
| Growth Rate | CAGR of 5.23% from 2020-2034 |
| Segmentation |
|
Table of Contents
- 1. Introduction
- 1.1. Research Scope
- 1.2. Market Segmentation
- 1.3. Research Methodology
- 1.4. Definitions and Assumptions
- 2. Executive Summary
- 2.1. Introduction
- 3. Market Dynamics
- 3.1. Introduction
- 3.2. Market Drivers
- 3.3. Market Restrains
- 3.4. Market Trends
- 4. Market Factor Analysis
- 4.1. Porters Five Forces
- 4.2. Supply/Value Chain
- 4.3. PESTEL analysis
- 4.4. Market Entropy
- 4.5. Patent/Trademark Analysis
- 5. Global Carbonyl Iron-based Soft Magnetic Powder Analysis, Insights and Forecast, 2020-2032
- 5.1. Market Analysis, Insights and Forecast - by Application
- 5.1.1. New Energy Vehicles
- 5.1.2. Aerospace
- 5.1.3. Home Appliances
- 5.1.4. Communication
- 5.1.5. Others
- 5.2. Market Analysis, Insights and Forecast - by Types
- 5.2.1. ≤10μm
- 5.2.2. >10μm
- 5.3. Market Analysis, Insights and Forecast - by Region
- 5.3.1. North America
- 5.3.2. South America
- 5.3.3. Europe
- 5.3.4. Middle East & Africa
- 5.3.5. Asia Pacific
- 5.1. Market Analysis, Insights and Forecast - by Application
- 6. North America Carbonyl Iron-based Soft Magnetic Powder Analysis, Insights and Forecast, 2020-2032
- 6.1. Market Analysis, Insights and Forecast - by Application
- 6.1.1. New Energy Vehicles
- 6.1.2. Aerospace
- 6.1.3. Home Appliances
- 6.1.4. Communication
- 6.1.5. Others
- 6.2. Market Analysis, Insights and Forecast - by Types
- 6.2.1. ≤10μm
- 6.2.2. >10μm
- 6.1. Market Analysis, Insights and Forecast - by Application
- 7. South America Carbonyl Iron-based Soft Magnetic Powder Analysis, Insights and Forecast, 2020-2032
- 7.1. Market Analysis, Insights and Forecast - by Application
- 7.1.1. New Energy Vehicles
- 7.1.2. Aerospace
- 7.1.3. Home Appliances
- 7.1.4. Communication
- 7.1.5. Others
- 7.2. Market Analysis, Insights and Forecast - by Types
- 7.2.1. ≤10μm
- 7.2.2. >10μm
- 7.1. Market Analysis, Insights and Forecast - by Application
- 8. Europe Carbonyl Iron-based Soft Magnetic Powder Analysis, Insights and Forecast, 2020-2032
- 8.1. Market Analysis, Insights and Forecast - by Application
- 8.1.1. New Energy Vehicles
- 8.1.2. Aerospace
- 8.1.3. Home Appliances
- 8.1.4. Communication
- 8.1.5. Others
- 8.2. Market Analysis, Insights and Forecast - by Types
- 8.2.1. ≤10μm
- 8.2.2. >10μm
- 8.1. Market Analysis, Insights and Forecast - by Application
- 9. Middle East & Africa Carbonyl Iron-based Soft Magnetic Powder Analysis, Insights and Forecast, 2020-2032
- 9.1. Market Analysis, Insights and Forecast - by Application
- 9.1.1. New Energy Vehicles
- 9.1.2. Aerospace
- 9.1.3. Home Appliances
- 9.1.4. Communication
- 9.1.5. Others
- 9.2. Market Analysis, Insights and Forecast - by Types
- 9.2.1. ≤10μm
- 9.2.2. >10μm
- 9.1. Market Analysis, Insights and Forecast - by Application
- 10. Asia Pacific Carbonyl Iron-based Soft Magnetic Powder Analysis, Insights and Forecast, 2020-2032
- 10.1. Market Analysis, Insights and Forecast - by Application
- 10.1.1. New Energy Vehicles
- 10.1.2. Aerospace
- 10.1.3. Home Appliances
- 10.1.4. Communication
- 10.1.5. Others
- 10.2. Market Analysis, Insights and Forecast - by Types
- 10.2.1. ≤10μm
- 10.2.2. >10μm
- 10.1. Market Analysis, Insights and Forecast - by Application
- 11. Competitive Analysis
- 11.1. Global Market Share Analysis 2025
- 11.2. Company Profiles
- 11.2.1 BASF
- 11.2.1.1. Overview
- 11.2.1.2. Products
- 11.2.1.3. SWOT Analysis
- 11.2.1.4. Recent Developments
- 11.2.1.5. Financials (Based on Availability)
- 11.2.2 Jiangxi Yuean
- 11.2.2.1. Overview
- 11.2.2.2. Products
- 11.2.2.3. SWOT Analysis
- 11.2.2.4. Recent Developments
- 11.2.2.5. Financials (Based on Availability)
- 11.2.3 Jiangsu Tianyi
- 11.2.3.1. Overview
- 11.2.3.2. Products
- 11.2.3.3. SWOT Analysis
- 11.2.3.4. Recent Developments
- 11.2.3.5. Financials (Based on Availability)
- 11.2.4 Jilin Jien
- 11.2.4.1. Overview
- 11.2.4.2. Products
- 11.2.4.3. SWOT Analysis
- 11.2.4.4. Recent Developments
- 11.2.4.5. Financials (Based on Availability)
- 11.2.5 Jiangyou Hebao
- 11.2.5.1. Overview
- 11.2.5.2. Products
- 11.2.5.3. SWOT Analysis
- 11.2.5.4. Recent Developments
- 11.2.5.5. Financials (Based on Availability)
- 11.2.1 BASF
List of Figures
- Figure 1: Global Carbonyl Iron-based Soft Magnetic Powder Revenue Breakdown (million, %) by Region 2025 & 2033
- Figure 2: Global Carbonyl Iron-based Soft Magnetic Powder Volume Breakdown (K, %) by Region 2025 & 2033
- Figure 3: North America Carbonyl Iron-based Soft Magnetic Powder Revenue (million), by Application 2025 & 2033
- Figure 4: North America Carbonyl Iron-based Soft Magnetic Powder Volume (K), by Application 2025 & 2033
- Figure 5: North America Carbonyl Iron-based Soft Magnetic Powder Revenue Share (%), by Application 2025 & 2033
- Figure 6: North America Carbonyl Iron-based Soft Magnetic Powder Volume Share (%), by Application 2025 & 2033
- Figure 7: North America Carbonyl Iron-based Soft Magnetic Powder Revenue (million), by Types 2025 & 2033
- Figure 8: North America Carbonyl Iron-based Soft Magnetic Powder Volume (K), by Types 2025 & 2033
- Figure 9: North America Carbonyl Iron-based Soft Magnetic Powder Revenue Share (%), by Types 2025 & 2033
- Figure 10: North America Carbonyl Iron-based Soft Magnetic Powder Volume Share (%), by Types 2025 & 2033
- Figure 11: North America Carbonyl Iron-based Soft Magnetic Powder Revenue (million), by Country 2025 & 2033
- Figure 12: North America Carbonyl Iron-based Soft Magnetic Powder Volume (K), by Country 2025 & 2033
- Figure 13: North America Carbonyl Iron-based Soft Magnetic Powder Revenue Share (%), by Country 2025 & 2033
- Figure 14: North America Carbonyl Iron-based Soft Magnetic Powder Volume Share (%), by Country 2025 & 2033
- Figure 15: South America Carbonyl Iron-based Soft Magnetic Powder Revenue (million), by Application 2025 & 2033
- Figure 16: South America Carbonyl Iron-based Soft Magnetic Powder Volume (K), by Application 2025 & 2033
- Figure 17: South America Carbonyl Iron-based Soft Magnetic Powder Revenue Share (%), by Application 2025 & 2033
- Figure 18: South America Carbonyl Iron-based Soft Magnetic Powder Volume Share (%), by Application 2025 & 2033
- Figure 19: South America Carbonyl Iron-based Soft Magnetic Powder Revenue (million), by Types 2025 & 2033
- Figure 20: South America Carbonyl Iron-based Soft Magnetic Powder Volume (K), by Types 2025 & 2033
- Figure 21: South America Carbonyl Iron-based Soft Magnetic Powder Revenue Share (%), by Types 2025 & 2033
- Figure 22: South America Carbonyl Iron-based Soft Magnetic Powder Volume Share (%), by Types 2025 & 2033
- Figure 23: South America Carbonyl Iron-based Soft Magnetic Powder Revenue (million), by Country 2025 & 2033
- Figure 24: South America Carbonyl Iron-based Soft Magnetic Powder Volume (K), by Country 2025 & 2033
- Figure 25: South America Carbonyl Iron-based Soft Magnetic Powder Revenue Share (%), by Country 2025 & 2033
- Figure 26: South America Carbonyl Iron-based Soft Magnetic Powder Volume Share (%), by Country 2025 & 2033
- Figure 27: Europe Carbonyl Iron-based Soft Magnetic Powder Revenue (million), by Application 2025 & 2033
- Figure 28: Europe Carbonyl Iron-based Soft Magnetic Powder Volume (K), by Application 2025 & 2033
- Figure 29: Europe Carbonyl Iron-based Soft Magnetic Powder Revenue Share (%), by Application 2025 & 2033
- Figure 30: Europe Carbonyl Iron-based Soft Magnetic Powder Volume Share (%), by Application 2025 & 2033
- Figure 31: Europe Carbonyl Iron-based Soft Magnetic Powder Revenue (million), by Types 2025 & 2033
- Figure 32: Europe Carbonyl Iron-based Soft Magnetic Powder Volume (K), by Types 2025 & 2033
- Figure 33: Europe Carbonyl Iron-based Soft Magnetic Powder Revenue Share (%), by Types 2025 & 2033
- Figure 34: Europe Carbonyl Iron-based Soft Magnetic Powder Volume Share (%), by Types 2025 & 2033
- Figure 35: Europe Carbonyl Iron-based Soft Magnetic Powder Revenue (million), by Country 2025 & 2033
- Figure 36: Europe Carbonyl Iron-based Soft Magnetic Powder Volume (K), by Country 2025 & 2033
- Figure 37: Europe Carbonyl Iron-based Soft Magnetic Powder Revenue Share (%), by Country 2025 & 2033
- Figure 38: Europe Carbonyl Iron-based Soft Magnetic Powder Volume Share (%), by Country 2025 & 2033
- Figure 39: Middle East & Africa Carbonyl Iron-based Soft Magnetic Powder Revenue (million), by Application 2025 & 2033
- Figure 40: Middle East & Africa Carbonyl Iron-based Soft Magnetic Powder Volume (K), by Application 2025 & 2033
- Figure 41: Middle East & Africa Carbonyl Iron-based Soft Magnetic Powder Revenue Share (%), by Application 2025 & 2033
- Figure 42: Middle East & Africa Carbonyl Iron-based Soft Magnetic Powder Volume Share (%), by Application 2025 & 2033
- Figure 43: Middle East & Africa Carbonyl Iron-based Soft Magnetic Powder Revenue (million), by Types 2025 & 2033
- Figure 44: Middle East & Africa Carbonyl Iron-based Soft Magnetic Powder Volume (K), by Types 2025 & 2033
- Figure 45: Middle East & Africa Carbonyl Iron-based Soft Magnetic Powder Revenue Share (%), by Types 2025 & 2033
- Figure 46: Middle East & Africa Carbonyl Iron-based Soft Magnetic Powder Volume Share (%), by Types 2025 & 2033
- Figure 47: Middle East & Africa Carbonyl Iron-based Soft Magnetic Powder Revenue (million), by Country 2025 & 2033
- Figure 48: Middle East & Africa Carbonyl Iron-based Soft Magnetic Powder Volume (K), by Country 2025 & 2033
- Figure 49: Middle East & Africa Carbonyl Iron-based Soft Magnetic Powder Revenue Share (%), by Country 2025 & 2033
- Figure 50: Middle East & Africa Carbonyl Iron-based Soft Magnetic Powder Volume Share (%), by Country 2025 & 2033
- Figure 51: Asia Pacific Carbonyl Iron-based Soft Magnetic Powder Revenue (million), by Application 2025 & 2033
- Figure 52: Asia Pacific Carbonyl Iron-based Soft Magnetic Powder Volume (K), by Application 2025 & 2033
- Figure 53: Asia Pacific Carbonyl Iron-based Soft Magnetic Powder Revenue Share (%), by Application 2025 & 2033
- Figure 54: Asia Pacific Carbonyl Iron-based Soft Magnetic Powder Volume Share (%), by Application 2025 & 2033
- Figure 55: Asia Pacific Carbonyl Iron-based Soft Magnetic Powder Revenue (million), by Types 2025 & 2033
- Figure 56: Asia Pacific Carbonyl Iron-based Soft Magnetic Powder Volume (K), by Types 2025 & 2033
- Figure 57: Asia Pacific Carbonyl Iron-based Soft Magnetic Powder Revenue Share (%), by Types 2025 & 2033
- Figure 58: Asia Pacific Carbonyl Iron-based Soft Magnetic Powder Volume Share (%), by Types 2025 & 2033
- Figure 59: Asia Pacific Carbonyl Iron-based Soft Magnetic Powder Revenue (million), by Country 2025 & 2033
- Figure 60: Asia Pacific Carbonyl Iron-based Soft Magnetic Powder Volume (K), by Country 2025 & 2033
- Figure 61: Asia Pacific Carbonyl Iron-based Soft Magnetic Powder Revenue Share (%), by Country 2025 & 2033
- Figure 62: Asia Pacific Carbonyl Iron-based Soft Magnetic Powder Volume Share (%), by Country 2025 & 2033
List of Tables
- Table 1: Global Carbonyl Iron-based Soft Magnetic Powder Revenue million Forecast, by Application 2020 & 2033
- Table 2: Global Carbonyl Iron-based Soft Magnetic Powder Volume K Forecast, by Application 2020 & 2033
- Table 3: Global Carbonyl Iron-based Soft Magnetic Powder Revenue million Forecast, by Types 2020 & 2033
- Table 4: Global Carbonyl Iron-based Soft Magnetic Powder Volume K Forecast, by Types 2020 & 2033
- Table 5: Global Carbonyl Iron-based Soft Magnetic Powder Revenue million Forecast, by Region 2020 & 2033
- Table 6: Global Carbonyl Iron-based Soft Magnetic Powder Volume K Forecast, by Region 2020 & 2033
- Table 7: Global Carbonyl Iron-based Soft Magnetic Powder Revenue million Forecast, by Application 2020 & 2033
- Table 8: Global Carbonyl Iron-based Soft Magnetic Powder Volume K Forecast, by Application 2020 & 2033
- Table 9: Global Carbonyl Iron-based Soft Magnetic Powder Revenue million Forecast, by Types 2020 & 2033
- Table 10: Global Carbonyl Iron-based Soft Magnetic Powder Volume K Forecast, by Types 2020 & 2033
- Table 11: Global Carbonyl Iron-based Soft Magnetic Powder Revenue million Forecast, by Country 2020 & 2033
- Table 12: Global Carbonyl Iron-based Soft Magnetic Powder Volume K Forecast, by Country 2020 & 2033
- Table 13: United States Carbonyl Iron-based Soft Magnetic Powder Revenue (million) Forecast, by Application 2020 & 2033
- Table 14: United States Carbonyl Iron-based Soft Magnetic Powder Volume (K) Forecast, by Application 2020 & 2033
- Table 15: Canada Carbonyl Iron-based Soft Magnetic Powder Revenue (million) Forecast, by Application 2020 & 2033
- Table 16: Canada Carbonyl Iron-based Soft Magnetic Powder Volume (K) Forecast, by Application 2020 & 2033
- Table 17: Mexico Carbonyl Iron-based Soft Magnetic Powder Revenue (million) Forecast, by Application 2020 & 2033
- Table 18: Mexico Carbonyl Iron-based Soft Magnetic Powder Volume (K) Forecast, by Application 2020 & 2033
- Table 19: Global Carbonyl Iron-based Soft Magnetic Powder Revenue million Forecast, by Application 2020 & 2033
- Table 20: Global Carbonyl Iron-based Soft Magnetic Powder Volume K Forecast, by Application 2020 & 2033
- Table 21: Global Carbonyl Iron-based Soft Magnetic Powder Revenue million Forecast, by Types 2020 & 2033
- Table 22: Global Carbonyl Iron-based Soft Magnetic Powder Volume K Forecast, by Types 2020 & 2033
- Table 23: Global Carbonyl Iron-based Soft Magnetic Powder Revenue million Forecast, by Country 2020 & 2033
- Table 24: Global Carbonyl Iron-based Soft Magnetic Powder Volume K Forecast, by Country 2020 & 2033
- Table 25: Brazil Carbonyl Iron-based Soft Magnetic Powder Revenue (million) Forecast, by Application 2020 & 2033
- Table 26: Brazil Carbonyl Iron-based Soft Magnetic Powder Volume (K) Forecast, by Application 2020 & 2033
- Table 27: Argentina Carbonyl Iron-based Soft Magnetic Powder Revenue (million) Forecast, by Application 2020 & 2033
- Table 28: Argentina Carbonyl Iron-based Soft Magnetic Powder Volume (K) Forecast, by Application 2020 & 2033
- Table 29: Rest of South America Carbonyl Iron-based Soft Magnetic Powder Revenue (million) Forecast, by Application 2020 & 2033
- Table 30: Rest of South America Carbonyl Iron-based Soft Magnetic Powder Volume (K) Forecast, by Application 2020 & 2033
- Table 31: Global Carbonyl Iron-based Soft Magnetic Powder Revenue million Forecast, by Application 2020 & 2033
- Table 32: Global Carbonyl Iron-based Soft Magnetic Powder Volume K Forecast, by Application 2020 & 2033
- Table 33: Global Carbonyl Iron-based Soft Magnetic Powder Revenue million Forecast, by Types 2020 & 2033
- Table 34: Global Carbonyl Iron-based Soft Magnetic Powder Volume K Forecast, by Types 2020 & 2033
- Table 35: Global Carbonyl Iron-based Soft Magnetic Powder Revenue million Forecast, by Country 2020 & 2033
- Table 36: Global Carbonyl Iron-based Soft Magnetic Powder Volume K Forecast, by Country 2020 & 2033
- Table 37: United Kingdom Carbonyl Iron-based Soft Magnetic Powder Revenue (million) Forecast, by Application 2020 & 2033
- Table 38: United Kingdom Carbonyl Iron-based Soft Magnetic Powder Volume (K) Forecast, by Application 2020 & 2033
- Table 39: Germany Carbonyl Iron-based Soft Magnetic Powder Revenue (million) Forecast, by Application 2020 & 2033
- Table 40: Germany Carbonyl Iron-based Soft Magnetic Powder Volume (K) Forecast, by Application 2020 & 2033
- Table 41: France Carbonyl Iron-based Soft Magnetic Powder Revenue (million) Forecast, by Application 2020 & 2033
- Table 42: France Carbonyl Iron-based Soft Magnetic Powder Volume (K) Forecast, by Application 2020 & 2033
- Table 43: Italy Carbonyl Iron-based Soft Magnetic Powder Revenue (million) Forecast, by Application 2020 & 2033
- Table 44: Italy Carbonyl Iron-based Soft Magnetic Powder Volume (K) Forecast, by Application 2020 & 2033
- Table 45: Spain Carbonyl Iron-based Soft Magnetic Powder Revenue (million) Forecast, by Application 2020 & 2033
- Table 46: Spain Carbonyl Iron-based Soft Magnetic Powder Volume (K) Forecast, by Application 2020 & 2033
- Table 47: Russia Carbonyl Iron-based Soft Magnetic Powder Revenue (million) Forecast, by Application 2020 & 2033
- Table 48: Russia Carbonyl Iron-based Soft Magnetic Powder Volume (K) Forecast, by Application 2020 & 2033
- Table 49: Benelux Carbonyl Iron-based Soft Magnetic Powder Revenue (million) Forecast, by Application 2020 & 2033
- Table 50: Benelux Carbonyl Iron-based Soft Magnetic Powder Volume (K) Forecast, by Application 2020 & 2033
- Table 51: Nordics Carbonyl Iron-based Soft Magnetic Powder Revenue (million) Forecast, by Application 2020 & 2033
- Table 52: Nordics Carbonyl Iron-based Soft Magnetic Powder Volume (K) Forecast, by Application 2020 & 2033
- Table 53: Rest of Europe Carbonyl Iron-based Soft Magnetic Powder Revenue (million) Forecast, by Application 2020 & 2033
- Table 54: Rest of Europe Carbonyl Iron-based Soft Magnetic Powder Volume (K) Forecast, by Application 2020 & 2033
- Table 55: Global Carbonyl Iron-based Soft Magnetic Powder Revenue million Forecast, by Application 2020 & 2033
- Table 56: Global Carbonyl Iron-based Soft Magnetic Powder Volume K Forecast, by Application 2020 & 2033
- Table 57: Global Carbonyl Iron-based Soft Magnetic Powder Revenue million Forecast, by Types 2020 & 2033
- Table 58: Global Carbonyl Iron-based Soft Magnetic Powder Volume K Forecast, by Types 2020 & 2033
- Table 59: Global Carbonyl Iron-based Soft Magnetic Powder Revenue million Forecast, by Country 2020 & 2033
- Table 60: Global Carbonyl Iron-based Soft Magnetic Powder Volume K Forecast, by Country 2020 & 2033
- Table 61: Turkey Carbonyl Iron-based Soft Magnetic Powder Revenue (million) Forecast, by Application 2020 & 2033
- Table 62: Turkey Carbonyl Iron-based Soft Magnetic Powder Volume (K) Forecast, by Application 2020 & 2033
- Table 63: Israel Carbonyl Iron-based Soft Magnetic Powder Revenue (million) Forecast, by Application 2020 & 2033
- Table 64: Israel Carbonyl Iron-based Soft Magnetic Powder Volume (K) Forecast, by Application 2020 & 2033
- Table 65: GCC Carbonyl Iron-based Soft Magnetic Powder Revenue (million) Forecast, by Application 2020 & 2033
- Table 66: GCC Carbonyl Iron-based Soft Magnetic Powder Volume (K) Forecast, by Application 2020 & 2033
- Table 67: North Africa Carbonyl Iron-based Soft Magnetic Powder Revenue (million) Forecast, by Application 2020 & 2033
- Table 68: North Africa Carbonyl Iron-based Soft Magnetic Powder Volume (K) Forecast, by Application 2020 & 2033
- Table 69: South Africa Carbonyl Iron-based Soft Magnetic Powder Revenue (million) Forecast, by Application 2020 & 2033
- Table 70: South Africa Carbonyl Iron-based Soft Magnetic Powder Volume (K) Forecast, by Application 2020 & 2033
- Table 71: Rest of Middle East & Africa Carbonyl Iron-based Soft Magnetic Powder Revenue (million) Forecast, by Application 2020 & 2033
- Table 72: Rest of Middle East & Africa Carbonyl Iron-based Soft Magnetic Powder Volume (K) Forecast, by Application 2020 & 2033
- Table 73: Global Carbonyl Iron-based Soft Magnetic Powder Revenue million Forecast, by Application 2020 & 2033
- Table 74: Global Carbonyl Iron-based Soft Magnetic Powder Volume K Forecast, by Application 2020 & 2033
- Table 75: Global Carbonyl Iron-based Soft Magnetic Powder Revenue million Forecast, by Types 2020 & 2033
- Table 76: Global Carbonyl Iron-based Soft Magnetic Powder Volume K Forecast, by Types 2020 & 2033
- Table 77: Global Carbonyl Iron-based Soft Magnetic Powder Revenue million Forecast, by Country 2020 & 2033
- Table 78: Global Carbonyl Iron-based Soft Magnetic Powder Volume K Forecast, by Country 2020 & 2033
- Table 79: China Carbonyl Iron-based Soft Magnetic Powder Revenue (million) Forecast, by Application 2020 & 2033
- Table 80: China Carbonyl Iron-based Soft Magnetic Powder Volume (K) Forecast, by Application 2020 & 2033
- Table 81: India Carbonyl Iron-based Soft Magnetic Powder Revenue (million) Forecast, by Application 2020 & 2033
- Table 82: India Carbonyl Iron-based Soft Magnetic Powder Volume (K) Forecast, by Application 2020 & 2033
- Table 83: Japan Carbonyl Iron-based Soft Magnetic Powder Revenue (million) Forecast, by Application 2020 & 2033
- Table 84: Japan Carbonyl Iron-based Soft Magnetic Powder Volume (K) Forecast, by Application 2020 & 2033
- Table 85: South Korea Carbonyl Iron-based Soft Magnetic Powder Revenue (million) Forecast, by Application 2020 & 2033
- Table 86: South Korea Carbonyl Iron-based Soft Magnetic Powder Volume (K) Forecast, by Application 2020 & 2033
- Table 87: ASEAN Carbonyl Iron-based Soft Magnetic Powder Revenue (million) Forecast, by Application 2020 & 2033
- Table 88: ASEAN Carbonyl Iron-based Soft Magnetic Powder Volume (K) Forecast, by Application 2020 & 2033
- Table 89: Oceania Carbonyl Iron-based Soft Magnetic Powder Revenue (million) Forecast, by Application 2020 & 2033
- Table 90: Oceania Carbonyl Iron-based Soft Magnetic Powder Volume (K) Forecast, by Application 2020 & 2033
- Table 91: Rest of Asia Pacific Carbonyl Iron-based Soft Magnetic Powder Revenue (million) Forecast, by Application 2020 & 2033
- Table 92: Rest of Asia Pacific Carbonyl Iron-based Soft Magnetic Powder Volume (K) Forecast, by Application 2020 & 2033
Frequently Asked Questions
1. What is the projected Compound Annual Growth Rate (CAGR) of the Carbonyl Iron-based Soft Magnetic Powder?
The projected CAGR is approximately 5.23%.
2. Which companies are prominent players in the Carbonyl Iron-based Soft Magnetic Powder?
Key companies in the market include BASF, Jiangxi Yuean, Jiangsu Tianyi, Jilin Jien, Jiangyou Hebao.
3. What are the main segments of the Carbonyl Iron-based Soft Magnetic Powder?
The market segments include Application, Types.
4. Can you provide details about the market size?
The market size is estimated to be USD 276 million as of 2022.
5. What are some drivers contributing to market growth?
N/A
6. What are the notable trends driving market growth?
N/A
7. Are there any restraints impacting market growth?
N/A
8. Can you provide examples of recent developments in the market?
N/A
9. What pricing options are available for accessing the report?
Pricing options include single-user, multi-user, and enterprise licenses priced at USD 3950.00, USD 5925.00, and USD 7900.00 respectively.
10. Is the market size provided in terms of value or volume?
The market size is provided in terms of value, measured in million and volume, measured in K.
11. Are there any specific market keywords associated with the report?
Yes, the market keyword associated with the report is "Carbonyl Iron-based Soft Magnetic Powder," which aids in identifying and referencing the specific market segment covered.
12. How do I determine which pricing option suits my needs best?
The pricing options vary based on user requirements and access needs. Individual users may opt for single-user licenses, while businesses requiring broader access may choose multi-user or enterprise licenses for cost-effective access to the report.
13. Are there any additional resources or data provided in the Carbonyl Iron-based Soft Magnetic Powder report?
While the report offers comprehensive insights, it's advisable to review the specific contents or supplementary materials provided to ascertain if additional resources or data are available.
14. How can I stay updated on further developments or reports in the Carbonyl Iron-based Soft Magnetic Powder?
To stay informed about further developments, trends, and reports in the Carbonyl Iron-based Soft Magnetic Powder, consider subscribing to industry newsletters, following relevant companies and organizations, or regularly checking reputable industry news sources and publications.
Methodology
Step 1 - Identification of Relevant Samples Size from Population Database


Step 2 - Approaches for Defining Global Market Size (Value, Volume* & Price*)

Note*: In applicable scenarios
Step 3 - Data Sources
Primary Research
- Web Analytics
- Survey Reports
- Research Institute
- Latest Research Reports
- Opinion Leaders
Secondary Research
- Annual Reports
- White Paper
- Latest Press Release
- Industry Association
- Paid Database
- Investor Presentations

Step 4 - Data Triangulation
Involves using different sources of information in order to increase the validity of a study
These sources are likely to be stakeholders in a program - participants, other researchers, program staff, other community members, and so on.
Then we put all data in single framework & apply various statistical tools to find out the dynamic on the market.
During the analysis stage, feedback from the stakeholder groups would be compared to determine areas of agreement as well as areas of divergence