

Key Insights
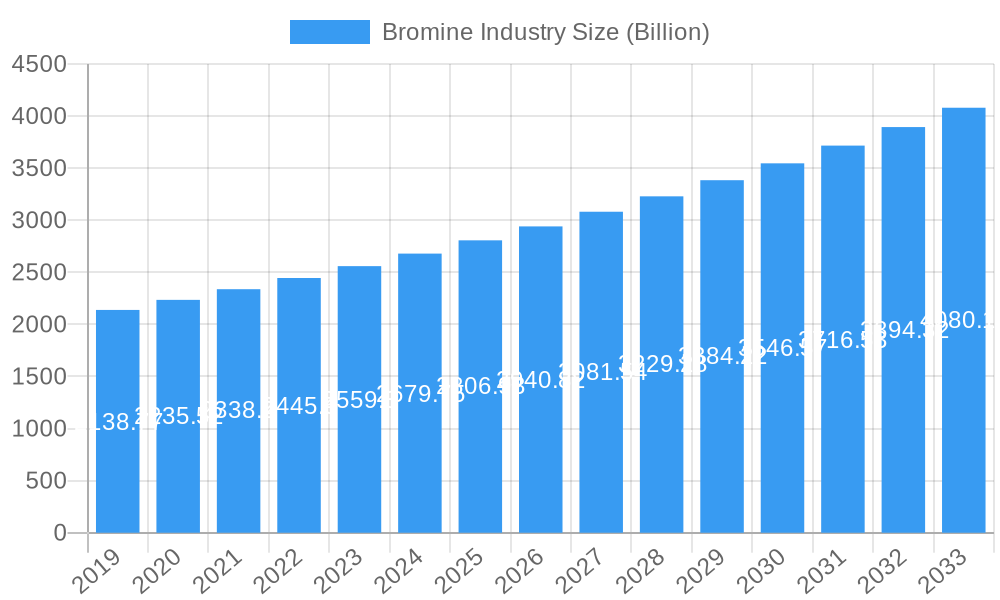
The global Bromine Industry is poised for significant expansion, projected to reach an estimated USD 2.6 Billion in market size by 2025, exhibiting a robust Compound Annual Growth Rate (CAGR) of 5% through 2033. This sustained growth is primarily fueled by escalating demand across diverse applications, particularly in flame retardants crucial for enhanced safety in electronics, construction, and automotive sectors. Furthermore, the burgeoning use of bromine in advanced battery technologies, notably for energy storage solutions, presents a substantial growth avenue. The increasing adoption of bromine-based biocides in water treatment and industrial processes, alongside their critical role in the oil and gas industry as clear brine fluids for well drilling, are also key drivers underpinning this market's upward trajectory. Strategic investments in research and development for novel bromine applications and an expanding industrial base in emerging economies are expected to further catalyze market expansion.
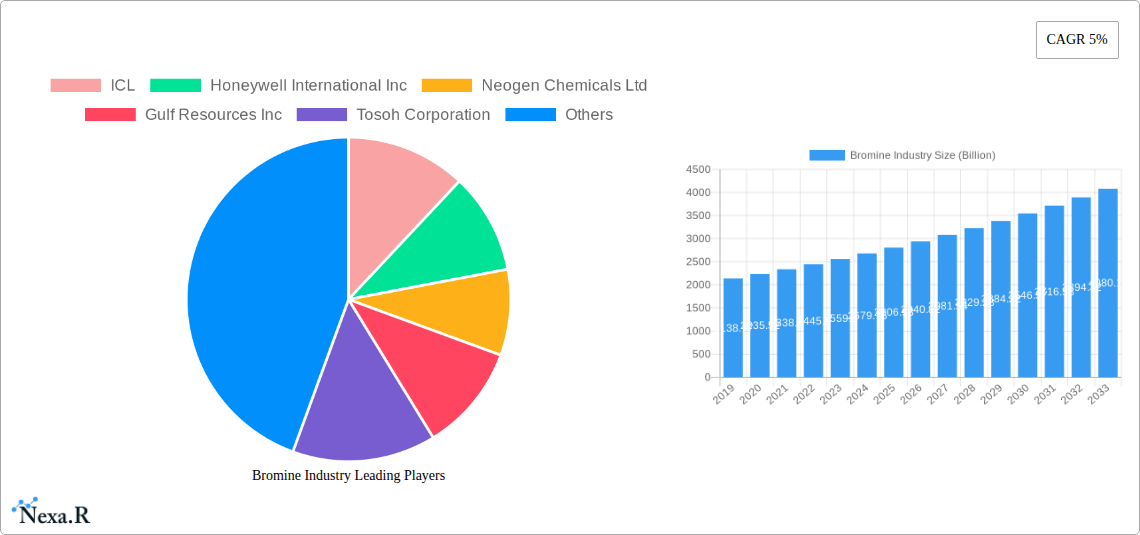
Bromine Industry Market Size (In Billion)
Despite the promising outlook, the Bromine Industry faces certain challenges. Stringent environmental regulations and concerns regarding the potential health impacts of certain bromine compounds necessitate careful management and the development of sustainable alternatives. The volatility in raw material prices, particularly for bromine itself, can impact production costs and profitability for key manufacturers. Nevertheless, ongoing innovation in product development, coupled with the inherent performance advantages of bromine-based solutions in critical applications, are expected to outweigh these restraints. The market is characterized by a competitive landscape with major players like ICL, Honeywell International Inc., and Albemarle Corporation actively engaged in strategic expansions and product advancements to capture a larger market share. The Asia Pacific region, led by China and India, is anticipated to be a major growth engine, driven by rapid industrialization and increasing demand for fire safety solutions and advanced materials.
Bromine Industry Company Market Share
Bromine Industry Market Dynamics & Structure
The global bromine market is characterized by a moderate level of concentration, with key players like ICL, Albemarle Corporation, and Lanxess holding significant market shares. Technological innovation plays a pivotal role, driven by the demand for advanced flame retardants, pharmaceutical intermediates, and emerging applications in energy storage. Regulatory frameworks, particularly concerning environmental impact and safety standards for bromine compounds, significantly influence market dynamics and product development. Competitive product substitutes exist, especially in flame retardant applications, but the unique properties of bromine often provide a competitive edge. End-user demographics are diverse, spanning industries from electronics and construction to oil & gas and pharmaceuticals. Mergers and acquisitions (M&A) trends are observed as companies seek to consolidate market presence, expand product portfolios, and enhance vertical integration.
- Market Concentration: Dominated by a few major global producers, indicating a moderately consolidated market structure.
- Technological Innovation Drivers: Focus on developing greener flame retardants, novel biocides, and advanced battery technologies.
- Regulatory Frameworks: Stringent environmental regulations and safety protocols for handling and disposal of bromine compounds are key influencing factors.
- Competitive Product Substitutes: While alternatives exist, bromine's efficacy in specific high-performance applications limits their widespread adoption.
- End-User Demographics: Diverse, with significant demand from electronics, construction, automotive, pharmaceutical, and oilfield services sectors.
- M&A Trends: Strategic acquisitions and partnerships aimed at capacity expansion, market penetration, and vertical integration are observed.
Bromine Industry Growth Trends & Insights
The global bromine market is poised for robust growth, projected to expand at a Compound Annual Growth Rate (CAGR) of approximately 4.5% from 2025 to 2033, reaching an estimated $25.7 Billion by 2033. This expansion is underpinned by increasing demand for flame retardants in electronics and construction, driven by stringent fire safety regulations worldwide. The adoption rate of bromine-based biocides in water treatment and industrial applications is steadily rising due to their effectiveness. Technological disruptions are emerging, particularly in the realm of bromine-based batteries, offering promising solutions for grid-scale energy storage. Consumer behavior shifts are influencing demand for safer and more sustainable chemical products, pushing innovation in bromine derivative development. The market penetration of bromine compounds in emerging economies is also a significant growth driver, fueled by industrialization and infrastructure development.
The base year, 2025, sees the market valued at an estimated $18.3 Billion. This growth trajectory is supported by sustained demand from established applications, coupled with the nascent but rapidly developing potential of new technologies. For instance, the increasing emphasis on renewable energy and the need for efficient energy storage solutions are propelling research and development into advanced bromine-based battery chemistries. Furthermore, the pharmaceutical industry continues to rely on bromine derivatives as crucial intermediates in the synthesis of various drugs, ensuring a consistent demand. In the construction sector, the need for enhanced fire safety in building materials, from insulation to wiring, will continue to drive the demand for effective flame retardants. Similarly, the water treatment sector's reliance on biocides for preventing microbial growth in industrial and municipal water systems offers a stable and growing market segment. The "Other Applications" segment, encompassing uses in agriculture, photography, and specialized chemicals, also contributes to the overall market expansion, albeit at a more moderate pace. The global bromine industry is thus characterized by a dynamic interplay of established demand and emerging technological frontiers, all contributing to a positive and sustainable growth outlook.
Dominant Regions, Countries, or Segments in Bromine Industry
The Asia Pacific region stands as the dominant force in the global bromine industry, exhibiting the highest market share and projected growth potential. This dominance is fueled by several key drivers, including rapid industrialization, a burgeoning manufacturing sector, and substantial investments in infrastructure development across countries like China and India. The region's robust demand for flame retardants in its massive electronics and construction industries is a primary contributor. Furthermore, the growing focus on water treatment and the increasing adoption of advanced biocides in industrial processes further solidify Asia Pacific's leading position.
The Derivative: Organo Bromines segment is a significant growth engine within the broader bromine market. This segment encompasses a wide array of chemical compounds that find extensive use as intermediates in pharmaceutical synthesis, agricultural chemicals, and advanced materials. The increasing global demand for pharmaceuticals, driven by an aging population and rising healthcare expenditure, directly translates to higher consumption of organobromine compounds. In the agricultural sector, organobromines are essential components in certain pesticides and fumigants, contributing to crop protection and yield enhancement. The continuous development of novel organobromine-based specialty chemicals with unique properties for advanced manufacturing processes further amplifies this segment's importance.
- Asia Pacific Dominance:
- Key Drivers: Rapid industrialization, strong manufacturing base, significant infrastructure investments, and increasing demand from end-user industries like electronics and construction.
- Market Share: Holds the largest share of the global bromine market.
- Growth Potential: Expected to maintain its leading position due to ongoing economic development and expanding industrial capacities.
- Derivative: Organo Bromines as a Growth Segment:
- Applications: Pharmaceuticals, agrochemicals, advanced materials, specialty chemicals.
- Driving Factors: Rising global pharmaceutical demand, need for effective crop protection, and innovation in specialty chemical applications.
- Market Penetration: Expanding use in complex chemical synthesis and high-performance material development.
- Application: Flame Retardants (FR):
- End-User Industries: Electronics, construction, automotive, textiles.
- Market Drivers: Stringent fire safety regulations, increasing production of electronic devices and vehicles, and fire-resistant building materials.
- Regional Significance: High demand in developed and developing economies with strict safety standards.
- Application: Biocides:
- Key Sectors: Water treatment (industrial and municipal), oil & gas, pulp & paper.
- Growth Factors: Growing global demand for clean water, stringent regulations for industrial wastewater discharge, and the need to prevent microbial contamination in various industrial processes.
- Performance Advantage: Bromine-based biocides offer effective broad-spectrum microbial control.
- Application: Clear Brine Fluids (CBF):
- Primary Use: Oil and gas well drilling and completion operations.
- Market Influence: Demand is closely tied to global oil and gas exploration and production activities.
- Performance: Provide high density and formation pressure control.
- Emerging Application: Bromine-based Batteries:
- Potential: Grid-scale energy storage solutions.
- Growth Trajectory: Driven by the increasing adoption of renewable energy sources and the need for reliable energy storage.
- Innovation Focus: Research and development aimed at improving energy density, cycle life, and cost-effectiveness.
Bromine Industry Product Landscape
The bromine industry is characterized by a diverse and evolving product landscape, driven by continuous innovation and application-specific demands. Key product categories include organobromine compounds, which serve as crucial intermediates in pharmaceuticals and agrochemicals, and elemental bromine, used directly in various industrial processes. Bromide salts find applications in oil and gas drilling fluids and as precursors for other bromine compounds. Emerging product innovations focus on developing highly efficient and environmentally benign flame retardants, advanced biocides for specialized applications, and novel materials for bromine-based batteries. Performance metrics for these products emphasize efficacy, safety, environmental sustainability, and cost-effectiveness, with ongoing research aimed at enhancing all these aspects.
Key Drivers, Barriers & Challenges in Bromine Industry
Key Drivers: The bromine industry's growth is propelled by escalating demand for flame retardants driven by stringent fire safety regulations across construction and electronics sectors. The pharmaceutical industry's reliance on bromine derivatives as vital synthesis intermediates ensures a consistent market pull. Furthermore, the emerging potential of bromine-based batteries for grid-scale energy storage represents a significant future growth catalyst. Technological advancements in developing more efficient and environmentally friendly bromine compounds also drive market expansion.
Barriers & Challenges: Environmental concerns and regulatory hurdles related to the handling and disposal of certain bromine compounds pose significant challenges. The volatility of raw material prices and supply chain disruptions can impact production costs and availability. Competition from alternative materials in some applications, particularly flame retardants, requires continuous innovation. Additionally, the inherent toxicity and corrosive nature of elemental bromine necessitate strict safety protocols, increasing operational complexity and costs.
Emerging Opportunities in Bromine Industry
Emerging opportunities in the bromine industry lie in the burgeoning market for sustainable flame retardants that meet stringent environmental standards, catering to a growing consumer preference for eco-friendly products. The development and commercialization of advanced bromine-based battery technologies for grid-scale energy storage present a substantial growth avenue, aligning with global renewable energy initiatives. Furthermore, the expanding pharmaceutical and agrochemical sectors in emerging economies offer untapped markets for specialized bromine derivatives. Innovations in bromine recovery and recycling technologies also present an opportunity to enhance resource efficiency and sustainability.
Growth Accelerators in the Bromine Industry Industry
Several factors are accelerating growth within the bromine industry. Technological breakthroughs in creating more effective and environmentally sustainable bromine derivatives, particularly in flame retardants and biocides, are key. Strategic partnerships and mergers & acquisitions among key players are consolidating the market and fostering innovation. The increasing global focus on renewable energy and the subsequent demand for advanced energy storage solutions are significantly boosting the prospects for bromine-based batteries. Furthermore, expansion into emerging markets with growing industrial bases and increasing safety regulations are opening up new avenues for market penetration.
Key Players Shaping the Bromine Industry Market
- ICL
- Honeywell International Inc
- Neogen Chemicals Ltd
- Gulf Resources Inc
- Tosoh Corporation
- Jordan Bromine Company
- TETRA Technologies Inc
- Tata Chemicals Ltd
- Shandong Haiwang Chemical Co
- Lanxess
- Sujay Chemicals
- Albemarle Corporation
Notable Milestones in Bromine Industry Sector
- January 2022: ICL introduced the new BromoQuel, a patented solution that redefines bromine leakage incident treatment to expand its bromine business with safety.
- August 2022: Albemarle Corporation announced the restructuring of its bromine and lithium global business units (GBU) into a new organizational structure. The realignment aims to meet growing customer demand and execute in a competitive global environment.
In-Depth Bromine Industry Market Outlook
The bromine industry outlook is exceptionally positive, driven by a convergence of strong demand from established sectors and promising innovation in emerging applications. Growth accelerators such as the relentless pursuit of enhanced fire safety through advanced flame retardants, coupled with the critical role of bromine derivatives in the expanding pharmaceutical and agrochemical industries, provide a solid foundation. The significant potential of bromine-based batteries for grid-scale energy storage, aligning with global decarbonization efforts, represents a transformative opportunity. Strategic investments in research and development, coupled with favorable regulatory landscapes in key regions, are poised to propel market expansion, ensuring sustained growth and profitability for industry stakeholders.
Bromine Industry Segmentation
-
1. Derivative
- 1.1. Organo Bromines
- 1.2. Bromide Salts
- 1.3. Hydrogen Bromide
-
2. Application
- 2.1. Biocides
- 2.2. Flame Retardants (FR)
- 2.3. Bromine-based Batteries
- 2.4. Clear Brine Fluids (CBF)
- 2.5. Other Applications
Bromine Industry Segmentation By Geography
-
1. Asia Pacific
- 1.1. China
- 1.2. India
- 1.3. Japan
- 1.4. South Korea
- 1.5. Rest of Asia Pacific
-
2. North America
- 2.1. United States
- 2.2. Canada
- 2.3. Mexico
-
3. Europe
- 3.1. Germany
- 3.2. United Kingdom
- 3.3. Italy
- 3.4. France
- 3.5. Rest of Europe
-
4. South America
- 4.1. Brazil
- 4.2. Argentina
- 4.3. Rest of South America
-
5. Middle East and Africa
- 5.1. Saudi Arabia
- 5.2. South Africa
- 5.3. Rest of Middle East and Africa
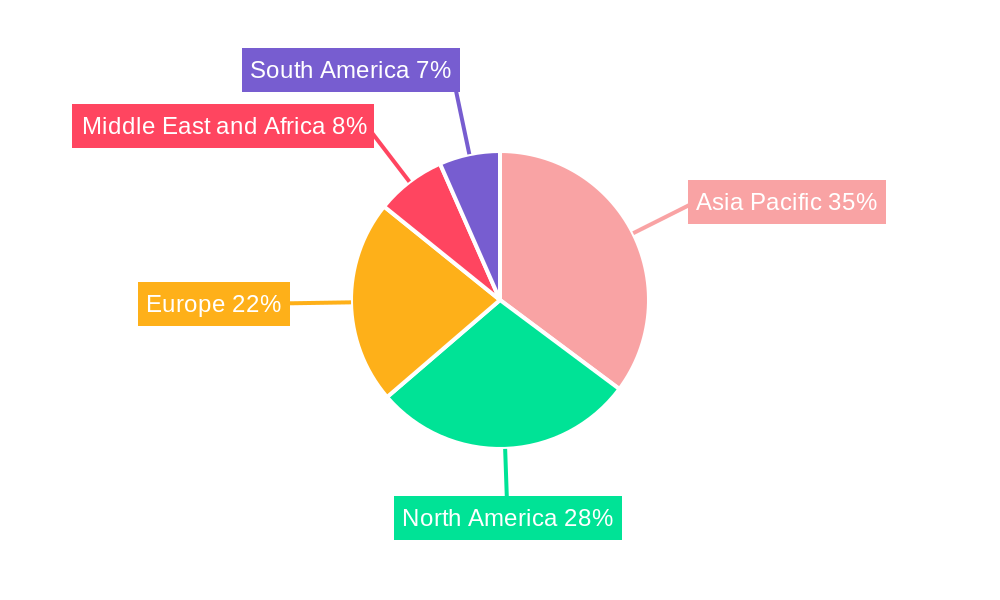
Bromine Industry Regional Market Share
Geographic Coverage of Bromine Industry
Bromine Industry REPORT HIGHLIGHTS
| Aspects | Details |
|---|---|
| Study Period | 2020-2034 |
| Base Year | 2025 |
| Estimated Year | 2026 |
| Forecast Period | 2026-2034 |
| Historical Period | 2020-2025 |
| Growth Rate | CAGR of 5% from 2020-2034 |
| Segmentation |
|
Table of Contents
- 1. Introduction
- 1.1. Research Scope
- 1.2. Market Segmentation
- 1.3. Research Objective
- 1.4. Definitions and Assumptions
- 2. Executive Summary
- 2.1. Market Snapshot
- 3. Market Dynamics
- 3.1. Market Drivers
- 3.2. Market Restrains
- 3.3. Market Trends
- 3.4. Market Opportunities
- 4. Market Factor Analysis
- 4.1. Porters Five Forces
- 4.1.1. Bargaining Power of Suppliers
- 4.1.2. Bargaining Power of Buyers
- 4.1.3. Threat of New Entrants
- 4.1.4. Threat of Substitutes
- 4.1.5. Competitive Rivalry
- 4.2. PESTEL analysis
- 4.3. BCG Analysis
- 4.3.1. Stars (High Growth, High Market Share)
- 4.3.2. Cash Cows (Low Growth, High Market Share)
- 4.3.3. Question Mark (High Growth, Low Market Share)
- 4.3.4. Dogs (Low Growth, Low Market Share)
- 4.4. Ansoff Matrix Analysis
- 4.5. Supply Chain Analysis
- 4.6. Regulatory Landscape
- 4.7. Current Market Potential and Opportunity Assessment (TAM–SAM–SOM Framework)
- 4.8. NRP Analyst Note
- 4.1. Porters Five Forces
- 5. Market Analysis, Insights and Forecast 2021-2033
- 5.1. Market Analysis, Insights and Forecast - by Derivative
- 5.1.1. Organo Bromines
- 5.1.2. Bromide Salts
- 5.1.3. Hydrogen Bromide
- 5.2. Market Analysis, Insights and Forecast - by Application
- 5.2.1. Biocides
- 5.2.2. Flame Retardants (FR)
- 5.2.3. Bromine-based Batteries
- 5.2.4. Clear Brine Fluids (CBF)
- 5.2.5. Other Applications
- 5.3. Market Analysis, Insights and Forecast - by Region
- 5.3.1. Asia Pacific
- 5.3.2. North America
- 5.3.3. Europe
- 5.3.4. South America
- 5.3.5. Middle East and Africa
- 5.1. Market Analysis, Insights and Forecast - by Derivative
- 6. Global Bromine Industry Analysis, Insights and Forecast, 2021-2033
- 6.1. Market Analysis, Insights and Forecast - by Derivative
- 6.1.1. Organo Bromines
- 6.1.2. Bromide Salts
- 6.1.3. Hydrogen Bromide
- 6.2. Market Analysis, Insights and Forecast - by Application
- 6.2.1. Biocides
- 6.2.2. Flame Retardants (FR)
- 6.2.3. Bromine-based Batteries
- 6.2.4. Clear Brine Fluids (CBF)
- 6.2.5. Other Applications
- 6.1. Market Analysis, Insights and Forecast - by Derivative
- 7. Asia Pacific Bromine Industry Analysis, Insights and Forecast, 2020-2032
- 7.1. Market Analysis, Insights and Forecast - by Derivative
- 7.1.1. Organo Bromines
- 7.1.2. Bromide Salts
- 7.1.3. Hydrogen Bromide
- 7.2. Market Analysis, Insights and Forecast - by Application
- 7.2.1. Biocides
- 7.2.2. Flame Retardants (FR)
- 7.2.3. Bromine-based Batteries
- 7.2.4. Clear Brine Fluids (CBF)
- 7.2.5. Other Applications
- 7.1. Market Analysis, Insights and Forecast - by Derivative
- 8. North America Bromine Industry Analysis, Insights and Forecast, 2020-2032
- 8.1. Market Analysis, Insights and Forecast - by Derivative
- 8.1.1. Organo Bromines
- 8.1.2. Bromide Salts
- 8.1.3. Hydrogen Bromide
- 8.2. Market Analysis, Insights and Forecast - by Application
- 8.2.1. Biocides
- 8.2.2. Flame Retardants (FR)
- 8.2.3. Bromine-based Batteries
- 8.2.4. Clear Brine Fluids (CBF)
- 8.2.5. Other Applications
- 8.1. Market Analysis, Insights and Forecast - by Derivative
- 9. Europe Bromine Industry Analysis, Insights and Forecast, 2020-2032
- 9.1. Market Analysis, Insights and Forecast - by Derivative
- 9.1.1. Organo Bromines
- 9.1.2. Bromide Salts
- 9.1.3. Hydrogen Bromide
- 9.2. Market Analysis, Insights and Forecast - by Application
- 9.2.1. Biocides
- 9.2.2. Flame Retardants (FR)
- 9.2.3. Bromine-based Batteries
- 9.2.4. Clear Brine Fluids (CBF)
- 9.2.5. Other Applications
- 9.1. Market Analysis, Insights and Forecast - by Derivative
- 10. South America Bromine Industry Analysis, Insights and Forecast, 2020-2032
- 10.1. Market Analysis, Insights and Forecast - by Derivative
- 10.1.1. Organo Bromines
- 10.1.2. Bromide Salts
- 10.1.3. Hydrogen Bromide
- 10.2. Market Analysis, Insights and Forecast - by Application
- 10.2.1. Biocides
- 10.2.2. Flame Retardants (FR)
- 10.2.3. Bromine-based Batteries
- 10.2.4. Clear Brine Fluids (CBF)
- 10.2.5. Other Applications
- 10.1. Market Analysis, Insights and Forecast - by Derivative
- 11. Middle East and Africa Bromine Industry Analysis, Insights and Forecast, 2020-2032
- 11.1. Market Analysis, Insights and Forecast - by Derivative
- 11.1.1. Organo Bromines
- 11.1.2. Bromide Salts
- 11.1.3. Hydrogen Bromide
- 11.2. Market Analysis, Insights and Forecast - by Application
- 11.2.1. Biocides
- 11.2.2. Flame Retardants (FR)
- 11.2.3. Bromine-based Batteries
- 11.2.4. Clear Brine Fluids (CBF)
- 11.2.5. Other Applications
- 11.1. Market Analysis, Insights and Forecast - by Derivative
- 12. Competitive Analysis
- 12.1. Company Profiles
- 12.1.1 ICL
- 12.1.1.1. Company Overview
- 12.1.1.2. Products
- 12.1.1.3. Company Financials
- 12.1.1.4. SWOT Analysis
- 12.1.2 Honeywell International Inc
- 12.1.2.1. Company Overview
- 12.1.2.2. Products
- 12.1.2.3. Company Financials
- 12.1.2.4. SWOT Analysis
- 12.1.3 Neogen Chemicals Ltd
- 12.1.3.1. Company Overview
- 12.1.3.2. Products
- 12.1.3.3. Company Financials
- 12.1.3.4. SWOT Analysis
- 12.1.4 Gulf Resources Inc
- 12.1.4.1. Company Overview
- 12.1.4.2. Products
- 12.1.4.3. Company Financials
- 12.1.4.4. SWOT Analysis
- 12.1.5 Tosoh Corporation
- 12.1.5.1. Company Overview
- 12.1.5.2. Products
- 12.1.5.3. Company Financials
- 12.1.5.4. SWOT Analysis
- 12.1.6 Jordan Bromine Company
- 12.1.6.1. Company Overview
- 12.1.6.2. Products
- 12.1.6.3. Company Financials
- 12.1.6.4. SWOT Analysis
- 12.1.7 TETRA Technologies Inc
- 12.1.7.1. Company Overview
- 12.1.7.2. Products
- 12.1.7.3. Company Financials
- 12.1.7.4. SWOT Analysis
- 12.1.8 Tata Chemicals Ltd
- 12.1.8.1. Company Overview
- 12.1.8.2. Products
- 12.1.8.3. Company Financials
- 12.1.8.4. SWOT Analysis
- 12.1.9 Shandong Haiwang Chemical Co
- 12.1.9.1. Company Overview
- 12.1.9.2. Products
- 12.1.9.3. Company Financials
- 12.1.9.4. SWOT Analysis
- 12.1.10 Lanxess
- 12.1.10.1. Company Overview
- 12.1.10.2. Products
- 12.1.10.3. Company Financials
- 12.1.10.4. SWOT Analysis
- 12.1.11 Sujay Chemicals
- 12.1.11.1. Company Overview
- 12.1.11.2. Products
- 12.1.11.3. Company Financials
- 12.1.11.4. SWOT Analysis
- 12.1.12 Albemarle Corporation
- 12.1.12.1. Company Overview
- 12.1.12.2. Products
- 12.1.12.3. Company Financials
- 12.1.12.4. SWOT Analysis
- 12.1.1 ICL
- 12.2. Market Entropy
- 12.2.1 Company's Key Areas Served
- 12.2.2 Recent Developments
- 12.3. Company Market Share Analysis 2025
- 12.3.1 Top 5 Companies Market Share Analysis
- 12.3.2 Top 3 Companies Market Share Analysis
- 12.4. List of Potential Customers
- 13. Research Methodology
List of Figures
- Figure 1: Global Bromine Industry Revenue Breakdown (Billion, %) by Region 2025 & 2033
- Figure 2: Global Bromine Industry Volume Breakdown (K Tons, %) by Region 2025 & 2033
- Figure 3: Asia Pacific Bromine Industry Revenue (Billion), by Derivative 2025 & 2033
- Figure 4: Asia Pacific Bromine Industry Volume (K Tons), by Derivative 2025 & 2033
- Figure 5: Asia Pacific Bromine Industry Revenue Share (%), by Derivative 2025 & 2033
- Figure 6: Asia Pacific Bromine Industry Volume Share (%), by Derivative 2025 & 2033
- Figure 7: Asia Pacific Bromine Industry Revenue (Billion), by Application 2025 & 2033
- Figure 8: Asia Pacific Bromine Industry Volume (K Tons), by Application 2025 & 2033
- Figure 9: Asia Pacific Bromine Industry Revenue Share (%), by Application 2025 & 2033
- Figure 10: Asia Pacific Bromine Industry Volume Share (%), by Application 2025 & 2033
- Figure 11: Asia Pacific Bromine Industry Revenue (Billion), by Country 2025 & 2033
- Figure 12: Asia Pacific Bromine Industry Volume (K Tons), by Country 2025 & 2033
- Figure 13: Asia Pacific Bromine Industry Revenue Share (%), by Country 2025 & 2033
- Figure 14: Asia Pacific Bromine Industry Volume Share (%), by Country 2025 & 2033
- Figure 15: North America Bromine Industry Revenue (Billion), by Derivative 2025 & 2033
- Figure 16: North America Bromine Industry Volume (K Tons), by Derivative 2025 & 2033
- Figure 17: North America Bromine Industry Revenue Share (%), by Derivative 2025 & 2033
- Figure 18: North America Bromine Industry Volume Share (%), by Derivative 2025 & 2033
- Figure 19: North America Bromine Industry Revenue (Billion), by Application 2025 & 2033
- Figure 20: North America Bromine Industry Volume (K Tons), by Application 2025 & 2033
- Figure 21: North America Bromine Industry Revenue Share (%), by Application 2025 & 2033
- Figure 22: North America Bromine Industry Volume Share (%), by Application 2025 & 2033
- Figure 23: North America Bromine Industry Revenue (Billion), by Country 2025 & 2033
- Figure 24: North America Bromine Industry Volume (K Tons), by Country 2025 & 2033
- Figure 25: North America Bromine Industry Revenue Share (%), by Country 2025 & 2033
- Figure 26: North America Bromine Industry Volume Share (%), by Country 2025 & 2033
- Figure 27: Europe Bromine Industry Revenue (Billion), by Derivative 2025 & 2033
- Figure 28: Europe Bromine Industry Volume (K Tons), by Derivative 2025 & 2033
- Figure 29: Europe Bromine Industry Revenue Share (%), by Derivative 2025 & 2033
- Figure 30: Europe Bromine Industry Volume Share (%), by Derivative 2025 & 2033
- Figure 31: Europe Bromine Industry Revenue (Billion), by Application 2025 & 2033
- Figure 32: Europe Bromine Industry Volume (K Tons), by Application 2025 & 2033
- Figure 33: Europe Bromine Industry Revenue Share (%), by Application 2025 & 2033
- Figure 34: Europe Bromine Industry Volume Share (%), by Application 2025 & 2033
- Figure 35: Europe Bromine Industry Revenue (Billion), by Country 2025 & 2033
- Figure 36: Europe Bromine Industry Volume (K Tons), by Country 2025 & 2033
- Figure 37: Europe Bromine Industry Revenue Share (%), by Country 2025 & 2033
- Figure 38: Europe Bromine Industry Volume Share (%), by Country 2025 & 2033
- Figure 39: South America Bromine Industry Revenue (Billion), by Derivative 2025 & 2033
- Figure 40: South America Bromine Industry Volume (K Tons), by Derivative 2025 & 2033
- Figure 41: South America Bromine Industry Revenue Share (%), by Derivative 2025 & 2033
- Figure 42: South America Bromine Industry Volume Share (%), by Derivative 2025 & 2033
- Figure 43: South America Bromine Industry Revenue (Billion), by Application 2025 & 2033
- Figure 44: South America Bromine Industry Volume (K Tons), by Application 2025 & 2033
- Figure 45: South America Bromine Industry Revenue Share (%), by Application 2025 & 2033
- Figure 46: South America Bromine Industry Volume Share (%), by Application 2025 & 2033
- Figure 47: South America Bromine Industry Revenue (Billion), by Country 2025 & 2033
- Figure 48: South America Bromine Industry Volume (K Tons), by Country 2025 & 2033
- Figure 49: South America Bromine Industry Revenue Share (%), by Country 2025 & 2033
- Figure 50: South America Bromine Industry Volume Share (%), by Country 2025 & 2033
- Figure 51: Middle East and Africa Bromine Industry Revenue (Billion), by Derivative 2025 & 2033
- Figure 52: Middle East and Africa Bromine Industry Volume (K Tons), by Derivative 2025 & 2033
- Figure 53: Middle East and Africa Bromine Industry Revenue Share (%), by Derivative 2025 & 2033
- Figure 54: Middle East and Africa Bromine Industry Volume Share (%), by Derivative 2025 & 2033
- Figure 55: Middle East and Africa Bromine Industry Revenue (Billion), by Application 2025 & 2033
- Figure 56: Middle East and Africa Bromine Industry Volume (K Tons), by Application 2025 & 2033
- Figure 57: Middle East and Africa Bromine Industry Revenue Share (%), by Application 2025 & 2033
- Figure 58: Middle East and Africa Bromine Industry Volume Share (%), by Application 2025 & 2033
- Figure 59: Middle East and Africa Bromine Industry Revenue (Billion), by Country 2025 & 2033
- Figure 60: Middle East and Africa Bromine Industry Volume (K Tons), by Country 2025 & 2033
- Figure 61: Middle East and Africa Bromine Industry Revenue Share (%), by Country 2025 & 2033
- Figure 62: Middle East and Africa Bromine Industry Volume Share (%), by Country 2025 & 2033
List of Tables
- Table 1: Global Bromine Industry Revenue Billion Forecast, by Derivative 2020 & 2033
- Table 2: Global Bromine Industry Volume K Tons Forecast, by Derivative 2020 & 2033
- Table 3: Global Bromine Industry Revenue Billion Forecast, by Application 2020 & 2033
- Table 4: Global Bromine Industry Volume K Tons Forecast, by Application 2020 & 2033
- Table 5: Global Bromine Industry Revenue Billion Forecast, by Region 2020 & 2033
- Table 6: Global Bromine Industry Volume K Tons Forecast, by Region 2020 & 2033
- Table 7: Global Bromine Industry Revenue Billion Forecast, by Derivative 2020 & 2033
- Table 8: Global Bromine Industry Volume K Tons Forecast, by Derivative 2020 & 2033
- Table 9: Global Bromine Industry Revenue Billion Forecast, by Application 2020 & 2033
- Table 10: Global Bromine Industry Volume K Tons Forecast, by Application 2020 & 2033
- Table 11: Global Bromine Industry Revenue Billion Forecast, by Country 2020 & 2033
- Table 12: Global Bromine Industry Volume K Tons Forecast, by Country 2020 & 2033
- Table 13: China Bromine Industry Revenue (Billion) Forecast, by Application 2020 & 2033
- Table 14: China Bromine Industry Volume (K Tons) Forecast, by Application 2020 & 2033
- Table 15: India Bromine Industry Revenue (Billion) Forecast, by Application 2020 & 2033
- Table 16: India Bromine Industry Volume (K Tons) Forecast, by Application 2020 & 2033
- Table 17: Japan Bromine Industry Revenue (Billion) Forecast, by Application 2020 & 2033
- Table 18: Japan Bromine Industry Volume (K Tons) Forecast, by Application 2020 & 2033
- Table 19: South Korea Bromine Industry Revenue (Billion) Forecast, by Application 2020 & 2033
- Table 20: South Korea Bromine Industry Volume (K Tons) Forecast, by Application 2020 & 2033
- Table 21: Rest of Asia Pacific Bromine Industry Revenue (Billion) Forecast, by Application 2020 & 2033
- Table 22: Rest of Asia Pacific Bromine Industry Volume (K Tons) Forecast, by Application 2020 & 2033
- Table 23: Global Bromine Industry Revenue Billion Forecast, by Derivative 2020 & 2033
- Table 24: Global Bromine Industry Volume K Tons Forecast, by Derivative 2020 & 2033
- Table 25: Global Bromine Industry Revenue Billion Forecast, by Application 2020 & 2033
- Table 26: Global Bromine Industry Volume K Tons Forecast, by Application 2020 & 2033
- Table 27: Global Bromine Industry Revenue Billion Forecast, by Country 2020 & 2033
- Table 28: Global Bromine Industry Volume K Tons Forecast, by Country 2020 & 2033
- Table 29: United States Bromine Industry Revenue (Billion) Forecast, by Application 2020 & 2033
- Table 30: United States Bromine Industry Volume (K Tons) Forecast, by Application 2020 & 2033
- Table 31: Canada Bromine Industry Revenue (Billion) Forecast, by Application 2020 & 2033
- Table 32: Canada Bromine Industry Volume (K Tons) Forecast, by Application 2020 & 2033
- Table 33: Mexico Bromine Industry Revenue (Billion) Forecast, by Application 2020 & 2033
- Table 34: Mexico Bromine Industry Volume (K Tons) Forecast, by Application 2020 & 2033
- Table 35: Global Bromine Industry Revenue Billion Forecast, by Derivative 2020 & 2033
- Table 36: Global Bromine Industry Volume K Tons Forecast, by Derivative 2020 & 2033
- Table 37: Global Bromine Industry Revenue Billion Forecast, by Application 2020 & 2033
- Table 38: Global Bromine Industry Volume K Tons Forecast, by Application 2020 & 2033
- Table 39: Global Bromine Industry Revenue Billion Forecast, by Country 2020 & 2033
- Table 40: Global Bromine Industry Volume K Tons Forecast, by Country 2020 & 2033
- Table 41: Germany Bromine Industry Revenue (Billion) Forecast, by Application 2020 & 2033
- Table 42: Germany Bromine Industry Volume (K Tons) Forecast, by Application 2020 & 2033
- Table 43: United Kingdom Bromine Industry Revenue (Billion) Forecast, by Application 2020 & 2033
- Table 44: United Kingdom Bromine Industry Volume (K Tons) Forecast, by Application 2020 & 2033
- Table 45: Italy Bromine Industry Revenue (Billion) Forecast, by Application 2020 & 2033
- Table 46: Italy Bromine Industry Volume (K Tons) Forecast, by Application 2020 & 2033
- Table 47: France Bromine Industry Revenue (Billion) Forecast, by Application 2020 & 2033
- Table 48: France Bromine Industry Volume (K Tons) Forecast, by Application 2020 & 2033
- Table 49: Rest of Europe Bromine Industry Revenue (Billion) Forecast, by Application 2020 & 2033
- Table 50: Rest of Europe Bromine Industry Volume (K Tons) Forecast, by Application 2020 & 2033
- Table 51: Global Bromine Industry Revenue Billion Forecast, by Derivative 2020 & 2033
- Table 52: Global Bromine Industry Volume K Tons Forecast, by Derivative 2020 & 2033
- Table 53: Global Bromine Industry Revenue Billion Forecast, by Application 2020 & 2033
- Table 54: Global Bromine Industry Volume K Tons Forecast, by Application 2020 & 2033
- Table 55: Global Bromine Industry Revenue Billion Forecast, by Country 2020 & 2033
- Table 56: Global Bromine Industry Volume K Tons Forecast, by Country 2020 & 2033
- Table 57: Brazil Bromine Industry Revenue (Billion) Forecast, by Application 2020 & 2033
- Table 58: Brazil Bromine Industry Volume (K Tons) Forecast, by Application 2020 & 2033
- Table 59: Argentina Bromine Industry Revenue (Billion) Forecast, by Application 2020 & 2033
- Table 60: Argentina Bromine Industry Volume (K Tons) Forecast, by Application 2020 & 2033
- Table 61: Rest of South America Bromine Industry Revenue (Billion) Forecast, by Application 2020 & 2033
- Table 62: Rest of South America Bromine Industry Volume (K Tons) Forecast, by Application 2020 & 2033
- Table 63: Global Bromine Industry Revenue Billion Forecast, by Derivative 2020 & 2033
- Table 64: Global Bromine Industry Volume K Tons Forecast, by Derivative 2020 & 2033
- Table 65: Global Bromine Industry Revenue Billion Forecast, by Application 2020 & 2033
- Table 66: Global Bromine Industry Volume K Tons Forecast, by Application 2020 & 2033
- Table 67: Global Bromine Industry Revenue Billion Forecast, by Country 2020 & 2033
- Table 68: Global Bromine Industry Volume K Tons Forecast, by Country 2020 & 2033
- Table 69: Saudi Arabia Bromine Industry Revenue (Billion) Forecast, by Application 2020 & 2033
- Table 70: Saudi Arabia Bromine Industry Volume (K Tons) Forecast, by Application 2020 & 2033
- Table 71: South Africa Bromine Industry Revenue (Billion) Forecast, by Application 2020 & 2033
- Table 72: South Africa Bromine Industry Volume (K Tons) Forecast, by Application 2020 & 2033
- Table 73: Rest of Middle East and Africa Bromine Industry Revenue (Billion) Forecast, by Application 2020 & 2033
- Table 74: Rest of Middle East and Africa Bromine Industry Volume (K Tons) Forecast, by Application 2020 & 2033
Frequently Asked Questions
1. What is the projected Compound Annual Growth Rate (CAGR) of the Bromine Industry?
The projected CAGR is approximately 5%.
2. Which companies are prominent players in the Bromine Industry?
Key companies in the market include ICL, Honeywell International Inc, Neogen Chemicals Ltd, Gulf Resources Inc, Tosoh Corporation, Jordan Bromine Company, TETRA Technologies Inc, Tata Chemicals Ltd, Shandong Haiwang Chemical Co, Lanxess, Sujay Chemicals, Albemarle Corporation.
3. What are the main segments of the Bromine Industry?
The market segments include Derivative, Application.
4. Can you provide details about the market size?
The market size is estimated to be USD 2.6 Billion as of 2022.
5. What are some drivers contributing to market growth?
The Increasing Demand of Bromine in Water Treatment Applications; Other Drivers.
6. What are the notable trends driving market growth?
Increasing Demand for Flame Retardants.
7. Are there any restraints impacting market growth?
Emergence of Non-halogenated Flame Retardants; Other Restraints.
8. Can you provide examples of recent developments in the market?
January 2022: ICL introduced the new BromoQuel, a patented solution that redefines bromine leakage incident treatment to expand its bromine business with safety.
9. What pricing options are available for accessing the report?
Pricing options include single-user, multi-user, and enterprise licenses priced at USD 3,950, USD 4,950, and USD 6,950 respectively.
10. Is the market size provided in terms of value or volume?
The market size is provided in terms of value, measured in Billion and volume, measured in K Tons.
11. Are there any specific market keywords associated with the report?
Yes, the market keyword associated with the report is "Bromine Industry," which aids in identifying and referencing the specific market segment covered.
12. How do I determine which pricing option suits my needs best?
The pricing options vary based on user requirements and access needs. Individual users may opt for single-user licenses, while businesses requiring broader access may choose multi-user or enterprise licenses for cost-effective access to the report.
13. Are there any additional resources or data provided in the Bromine Industry report?
While the report offers comprehensive insights, it's advisable to review the specific contents or supplementary materials provided to ascertain if additional resources or data are available.
14. How can I stay updated on further developments or reports in the Bromine Industry?
To stay informed about further developments, trends, and reports in the Bromine Industry, consider subscribing to industry newsletters, following relevant companies and organizations, or regularly checking reputable industry news sources and publications.
Methodology
Step 1 - Identification of Relevant Samples Size from Population Database


Step 2 - Approaches for Defining Global Market Size (Value, Volume* & Price*)

Note*: In applicable scenarios
Step 3 - Data Sources
Primary Research
- Web Analytics
- Survey Reports
- Research Institute
- Latest Research Reports
- Opinion Leaders
Secondary Research
- Annual Reports
- White Paper
- Latest Press Release
- Industry Association
- Paid Database
- Investor Presentations

Step 4 - Data Triangulation
Involves using different sources of information in order to increase the validity of a study
These sources are likely to be stakeholders in a program - participants, other researchers, program staff, other community members, and so on.
Then we put all data in single framework & apply various statistical tools to find out the dynamic on the market.
During the analysis stage, feedback from the stakeholder groups would be compared to determine areas of agreement as well as areas of divergence