

Key Insights
The global market for coatings for three-piece beverage cans and ends is projected for significant expansion. With an estimated market size of $2.76 billion in the base year 2025, the sector is poised to grow at a Compound Annual Growth Rate (CAGR) of 4.46% between 2025 and 2033. This upward trajectory is propelled by escalating demand for canned beverages and the critical role of protective, aesthetically superior coatings. Key growth drivers include the enduring popularity of canned beverages across diverse categories, from soft drinks and energy drinks to alcoholic beverages and ready-to-drink cocktails. Advancements in coating technologies are enhancing performance, offering superior corrosion resistance, improved printability, and increased scratch resistance. This innovation enables more vibrant, durable designs, thereby boosting brand appeal and product shelf life. Furthermore, a growing consumer emphasis on sustainability is stimulating the development and adoption of eco-friendly coating solutions, presenting new market opportunities.
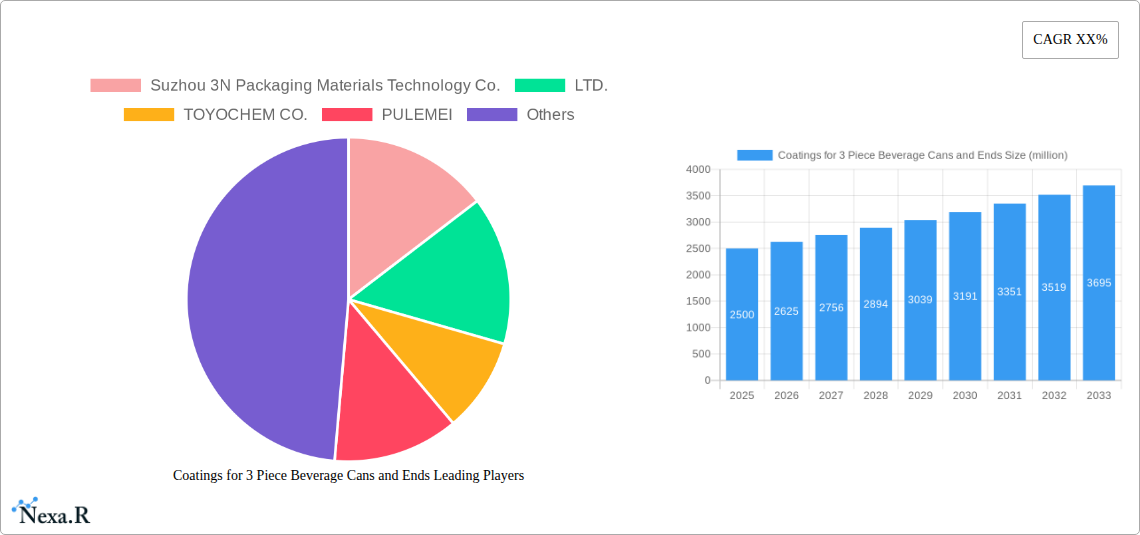
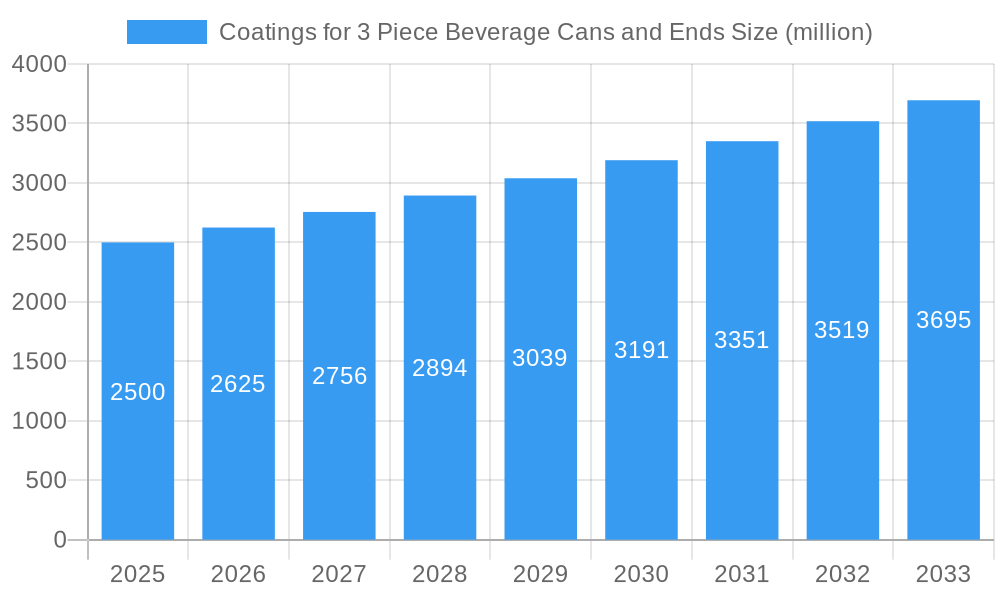
Coatings for 3 Piece Beverage Cans and Ends Market Size (In Billion)
The market is segmented by coating type (including epoxy, acrylic, and polyurethane), application method, and geographic region. Leading contributors to market dynamics through innovation and strategic expansion include Suzhou 3N Packaging Materials Technology Co.,LTD., TOYOCHEM CO.,LTD., PULEMEI, YHEX, Nordsen, and Sherwin-Williams.
Coatings for 3 Piece Beverage Cans and Ends Company Market Share
Despite a positive outlook, the market navigates challenges such as raw material price volatility, particularly for resins and solvents, which can affect profitability. Stringent environmental regulations concerning volatile organic compounds (VOCs) necessitate the development and implementation of greener coating alternatives. Intense competition from established and emerging players demands continuous innovation and operational efficiency for sustained market presence. The forecast period (2025-2033) is expected to see increased industry consolidation, with major companies potentially acquiring smaller entities to enhance their competitive position and market share. Geographic expansion into emerging markets with rising beverage consumption will also be a vital growth strategy.
Coatings for 3 Piece Beverage Cans and Ends Market Report: 2019-2033
This comprehensive report provides a detailed analysis of the Coatings for 3 Piece Beverage Cans and Ends market, encompassing market dynamics, growth trends, regional insights, product landscape, key players, and future outlook. The study period spans from 2019 to 2033, with 2025 serving as the base and estimated year. This report is invaluable for industry professionals, investors, and strategic decision-makers seeking a deep understanding of this dynamic sector. The parent market is the coatings industry, and the child market is the beverage can coatings segment. The market size is predicted to reach xx million units by 2033.
Coatings for 3 Piece Beverage Cans and Ends Market Dynamics & Structure
This section analyzes the competitive landscape, technological advancements, regulatory environment, and market trends within the coatings for 3-piece beverage cans and ends industry. The market is moderately concentrated, with key players holding significant market share. Technological innovation is driven by the need for enhanced sustainability, improved performance characteristics (corrosion resistance, printability), and cost reduction. Regulatory frameworks, particularly those related to food safety and environmental regulations, significantly influence product development and market access. The competitive landscape includes both established players and emerging entrants. Mergers and acquisitions (M&A) activity has been relatively low in recent years (xx deals between 2019-2024), primarily focused on strategic expansions and technology acquisitions.
- Market Concentration: Moderately concentrated, with top 5 players holding approximately xx% market share in 2024.
- Technological Innovation: Focus on sustainable coatings, improved barrier properties, and enhanced printability.
- Regulatory Framework: Stringent food safety and environmental regulations drive innovation and compliance.
- Competitive Substitutes: Limited direct substitutes, but alternative packaging materials (e.g., plastic, glass) pose indirect competition.
- End-User Demographics: Primarily driven by the beverage industry (soft drinks, beer, etc.), with regional variations in consumption patterns.
- M&A Trends: Relatively low activity (xx deals 2019-2024), with a focus on strategic acquisitions and technology integration.
Coatings for 3 Piece Beverage Cans and Ends Growth Trends & Insights
The Coatings for 3 Piece Beverage Cans and Ends market has witnessed significant growth over the historical period (2019-2024), driven by increasing beverage consumption globally and demand for high-quality, sustainable packaging solutions. The market size expanded from xx million units in 2019 to xx million units in 2024, exhibiting a CAGR of xx%. This growth is expected to continue during the forecast period (2025-2033), albeit at a slightly moderated pace, reaching xx million units by 2033 with a projected CAGR of xx%. Technological advancements, particularly in the area of sustainable and eco-friendly coatings, are fueling market adoption. Changing consumer preferences towards healthier beverages and increased awareness of environmental sustainability also contribute to the growth trajectory. Market penetration in developing economies is relatively low, presenting significant growth opportunities. The rise of e-commerce and home delivery further supports market expansion.
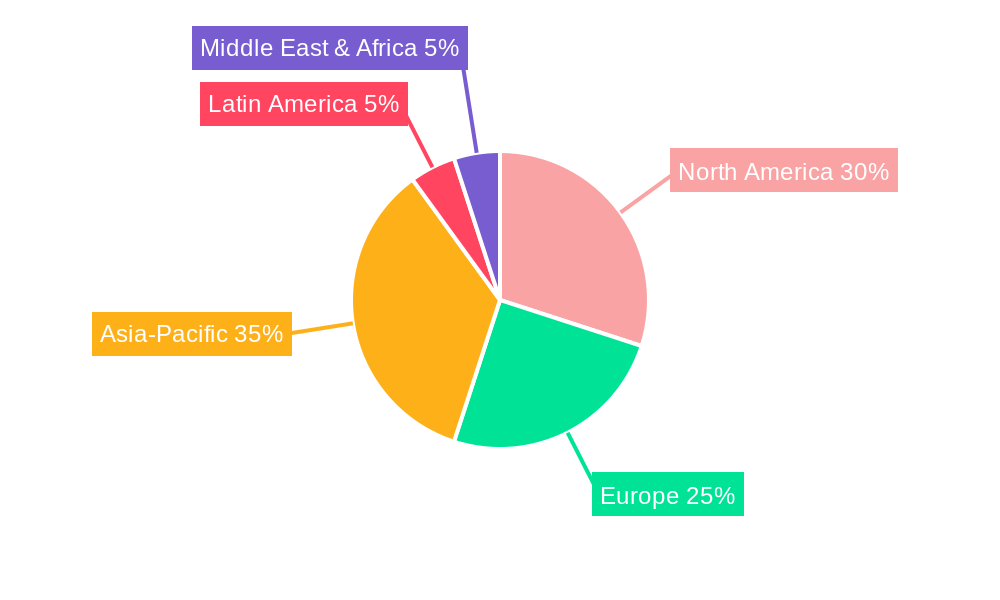
Dominant Regions, Countries, or Segments in Coatings for 3 Piece Beverage Cans and Ends
The Asia-Pacific region is currently the dominant market for coatings for 3-piece beverage cans and ends, driven by high beverage consumption, rapid economic growth, and increasing manufacturing capacity. China, India, and other Southeast Asian countries are key growth drivers. North America and Europe also hold substantial market share but with comparatively slower growth rates. Within the segments, coatings offering enhanced barrier properties and sustainability features are witnessing high demand.
- Key Drivers in Asia-Pacific: High beverage consumption, rapid economic growth, increasing industrialization, and expanding manufacturing capacity.
- Dominance Factors: Large consumer base, significant manufacturing activities in the region, and favorable government policies supporting industrial growth.
- Growth Potential: Untapped market potential in rural areas and emerging economies within the region, alongside the increasing focus on sustainable packaging solutions.
Coatings for 3 Piece Beverage Cans and Ends Product Landscape
The product landscape is characterized by a diverse range of coatings designed to meet specific performance requirements, such as corrosion resistance, printability, and food safety. Innovations focus on improving barrier properties to extend shelf life, reducing environmental impact through the use of sustainable materials, and enhancing aesthetic appeal through improved printability and surface finish. These advancements cater to evolving consumer demands for high-quality, sustainable, and visually appealing packaging.
Key Drivers, Barriers & Challenges in Coatings for 3 Piece Beverage Cans and Ends
Key Drivers: Increasing beverage consumption, demand for high-quality packaging, stringent food safety regulations, and growing preference for sustainable packaging solutions are propelling market growth. Technological advancements in coating formulations are enhancing performance and expanding applications.
Key Challenges: Fluctuations in raw material prices, stringent environmental regulations, and intense competition among coating suppliers pose significant challenges. Supply chain disruptions and the need for continuous innovation to maintain a competitive edge also present obstacles. The impact of these challenges can result in increased production costs and potentially lower profit margins.
Emerging Opportunities in Coatings for 3 Piece Beverage Cans and Ends
Emerging opportunities include expanding into untapped markets, particularly in developing economies, developing innovative coatings with enhanced sustainability features, and catering to the growing demand for customized and personalized packaging. The exploration of novel coating materials with improved barrier properties and the integration of smart packaging technologies present lucrative opportunities for growth and differentiation.
Growth Accelerators in the Coatings for 3 Piece Beverage Cans and Ends Industry
Technological breakthroughs in coating formulations, strategic partnerships between coating suppliers and beverage can manufacturers, and expansion into new geographic markets are crucial growth accelerators. Investments in research and development are driving innovation and creating opportunities for differentiation.
Key Players Shaping the Coatings for 3 Piece Beverage Cans and Ends Market
- Suzhou 3N Packaging Materials Technology Co.,LTD.
- TOYOCHEM CO.,LTD.
- PULEMEI
- YHEX
- Nordsen
- Sherwin-Williams
Notable Milestones in Coatings for 3 Piece Beverage Cans and Ends Sector
- 2021 (Q3): Launch of a new sustainable coating by Company X, significantly reducing environmental impact.
- 2022 (Q1): Merger between Company Y and Company Z, expanding market reach and product portfolio.
- 2023 (Q4): Introduction of a new high-barrier coating by Company A, improving product shelf life. (Further milestones can be added as data becomes available).
In-Depth Coatings for 3 Piece Beverage Cans and Ends Market Outlook
The Coatings for 3 Piece Beverage Cans and Ends market is poised for continued growth, driven by ongoing technological advancements, increasing demand for sustainable packaging, and expanding beverage consumption globally. Strategic partnerships, investments in R&D, and exploration of new markets will be crucial for success. The market exhibits strong potential for innovation and expansion, presenting attractive opportunities for existing and new players.
Coatings for 3 Piece Beverage Cans and Ends Segmentation
-
1. Application
- 1.1. Three Piece Beverage Cans and Ends
- 1.2. Other
-
2. Types
- 2.1. Golden Coating
- 2.2. Clear Coating
- 2.3. Other
Coatings for 3 Piece Beverage Cans and Ends Segmentation By Geography
-
1. North America
- 1.1. United States
- 1.2. Canada
- 1.3. Mexico
-
2. South America
- 2.1. Brazil
- 2.2. Argentina
- 2.3. Rest of South America
-
3. Europe
- 3.1. United Kingdom
- 3.2. Germany
- 3.3. France
- 3.4. Italy
- 3.5. Spain
- 3.6. Russia
- 3.7. Benelux
- 3.8. Nordics
- 3.9. Rest of Europe
-
4. Middle East & Africa
- 4.1. Turkey
- 4.2. Israel
- 4.3. GCC
- 4.4. North Africa
- 4.5. South Africa
- 4.6. Rest of Middle East & Africa
-
5. Asia Pacific
- 5.1. China
- 5.2. India
- 5.3. Japan
- 5.4. South Korea
- 5.5. ASEAN
- 5.6. Oceania
- 5.7. Rest of Asia Pacific
Coatings for 3 Piece Beverage Cans and Ends Regional Market Share
Geographic Coverage of Coatings for 3 Piece Beverage Cans and Ends
Coatings for 3 Piece Beverage Cans and Ends REPORT HIGHLIGHTS
| Aspects | Details |
|---|---|
| Study Period | 2020-2034 |
| Base Year | 2025 |
| Estimated Year | 2026 |
| Forecast Period | 2026-2034 |
| Historical Period | 2020-2025 |
| Growth Rate | CAGR of 4.46% from 2020-2034 |
| Segmentation |
|
Table of Contents
- 1. Introduction
- 1.1. Research Scope
- 1.2. Market Segmentation
- 1.3. Research Methodology
- 1.4. Definitions and Assumptions
- 2. Executive Summary
- 2.1. Introduction
- 3. Market Dynamics
- 3.1. Introduction
- 3.2. Market Drivers
- 3.3. Market Restrains
- 3.4. Market Trends
- 4. Market Factor Analysis
- 4.1. Porters Five Forces
- 4.2. Supply/Value Chain
- 4.3. PESTEL analysis
- 4.4. Market Entropy
- 4.5. Patent/Trademark Analysis
- 5. Global Coatings for 3 Piece Beverage Cans and Ends Analysis, Insights and Forecast, 2020-2032
- 5.1. Market Analysis, Insights and Forecast - by Application
- 5.1.1. Three Piece Beverage Cans and Ends
- 5.1.2. Other
- 5.2. Market Analysis, Insights and Forecast - by Types
- 5.2.1. Golden Coating
- 5.2.2. Clear Coating
- 5.2.3. Other
- 5.3. Market Analysis, Insights and Forecast - by Region
- 5.3.1. North America
- 5.3.2. South America
- 5.3.3. Europe
- 5.3.4. Middle East & Africa
- 5.3.5. Asia Pacific
- 5.1. Market Analysis, Insights and Forecast - by Application
- 6. North America Coatings for 3 Piece Beverage Cans and Ends Analysis, Insights and Forecast, 2020-2032
- 6.1. Market Analysis, Insights and Forecast - by Application
- 6.1.1. Three Piece Beverage Cans and Ends
- 6.1.2. Other
- 6.2. Market Analysis, Insights and Forecast - by Types
- 6.2.1. Golden Coating
- 6.2.2. Clear Coating
- 6.2.3. Other
- 6.1. Market Analysis, Insights and Forecast - by Application
- 7. South America Coatings for 3 Piece Beverage Cans and Ends Analysis, Insights and Forecast, 2020-2032
- 7.1. Market Analysis, Insights and Forecast - by Application
- 7.1.1. Three Piece Beverage Cans and Ends
- 7.1.2. Other
- 7.2. Market Analysis, Insights and Forecast - by Types
- 7.2.1. Golden Coating
- 7.2.2. Clear Coating
- 7.2.3. Other
- 7.1. Market Analysis, Insights and Forecast - by Application
- 8. Europe Coatings for 3 Piece Beverage Cans and Ends Analysis, Insights and Forecast, 2020-2032
- 8.1. Market Analysis, Insights and Forecast - by Application
- 8.1.1. Three Piece Beverage Cans and Ends
- 8.1.2. Other
- 8.2. Market Analysis, Insights and Forecast - by Types
- 8.2.1. Golden Coating
- 8.2.2. Clear Coating
- 8.2.3. Other
- 8.1. Market Analysis, Insights and Forecast - by Application
- 9. Middle East & Africa Coatings for 3 Piece Beverage Cans and Ends Analysis, Insights and Forecast, 2020-2032
- 9.1. Market Analysis, Insights and Forecast - by Application
- 9.1.1. Three Piece Beverage Cans and Ends
- 9.1.2. Other
- 9.2. Market Analysis, Insights and Forecast - by Types
- 9.2.1. Golden Coating
- 9.2.2. Clear Coating
- 9.2.3. Other
- 9.1. Market Analysis, Insights and Forecast - by Application
- 10. Asia Pacific Coatings for 3 Piece Beverage Cans and Ends Analysis, Insights and Forecast, 2020-2032
- 10.1. Market Analysis, Insights and Forecast - by Application
- 10.1.1. Three Piece Beverage Cans and Ends
- 10.1.2. Other
- 10.2. Market Analysis, Insights and Forecast - by Types
- 10.2.1. Golden Coating
- 10.2.2. Clear Coating
- 10.2.3. Other
- 10.1. Market Analysis, Insights and Forecast - by Application
- 11. Competitive Analysis
- 11.1. Global Market Share Analysis 2025
- 11.2. Company Profiles
- 11.2.1 Suzhou 3N Packaging Materials Technology Co.
- 11.2.1.1. Overview
- 11.2.1.2. Products
- 11.2.1.3. SWOT Analysis
- 11.2.1.4. Recent Developments
- 11.2.1.5. Financials (Based on Availability)
- 11.2.2 LTD.
- 11.2.2.1. Overview
- 11.2.2.2. Products
- 11.2.2.3. SWOT Analysis
- 11.2.2.4. Recent Developments
- 11.2.2.5. Financials (Based on Availability)
- 11.2.3 TOYOCHEM CO.
- 11.2.3.1. Overview
- 11.2.3.2. Products
- 11.2.3.3. SWOT Analysis
- 11.2.3.4. Recent Developments
- 11.2.3.5. Financials (Based on Availability)
- 11.2.4 LTD.
- 11.2.4.1. Overview
- 11.2.4.2. Products
- 11.2.4.3. SWOT Analysis
- 11.2.4.4. Recent Developments
- 11.2.4.5. Financials (Based on Availability)
- 11.2.5 PULEMEI
- 11.2.5.1. Overview
- 11.2.5.2. Products
- 11.2.5.3. SWOT Analysis
- 11.2.5.4. Recent Developments
- 11.2.5.5. Financials (Based on Availability)
- 11.2.6 YHEX
- 11.2.6.1. Overview
- 11.2.6.2. Products
- 11.2.6.3. SWOT Analysis
- 11.2.6.4. Recent Developments
- 11.2.6.5. Financials (Based on Availability)
- 11.2.7 Nordsen
- 11.2.7.1. Overview
- 11.2.7.2. Products
- 11.2.7.3. SWOT Analysis
- 11.2.7.4. Recent Developments
- 11.2.7.5. Financials (Based on Availability)
- 11.2.8 Sherwin-Williams
- 11.2.8.1. Overview
- 11.2.8.2. Products
- 11.2.8.3. SWOT Analysis
- 11.2.8.4. Recent Developments
- 11.2.8.5. Financials (Based on Availability)
- 11.2.1 Suzhou 3N Packaging Materials Technology Co.
List of Figures
- Figure 1: Global Coatings for 3 Piece Beverage Cans and Ends Revenue Breakdown (billion, %) by Region 2025 & 2033
- Figure 2: North America Coatings for 3 Piece Beverage Cans and Ends Revenue (billion), by Application 2025 & 2033
- Figure 3: North America Coatings for 3 Piece Beverage Cans and Ends Revenue Share (%), by Application 2025 & 2033
- Figure 4: North America Coatings for 3 Piece Beverage Cans and Ends Revenue (billion), by Types 2025 & 2033
- Figure 5: North America Coatings for 3 Piece Beverage Cans and Ends Revenue Share (%), by Types 2025 & 2033
- Figure 6: North America Coatings for 3 Piece Beverage Cans and Ends Revenue (billion), by Country 2025 & 2033
- Figure 7: North America Coatings for 3 Piece Beverage Cans and Ends Revenue Share (%), by Country 2025 & 2033
- Figure 8: South America Coatings for 3 Piece Beverage Cans and Ends Revenue (billion), by Application 2025 & 2033
- Figure 9: South America Coatings for 3 Piece Beverage Cans and Ends Revenue Share (%), by Application 2025 & 2033
- Figure 10: South America Coatings for 3 Piece Beverage Cans and Ends Revenue (billion), by Types 2025 & 2033
- Figure 11: South America Coatings for 3 Piece Beverage Cans and Ends Revenue Share (%), by Types 2025 & 2033
- Figure 12: South America Coatings for 3 Piece Beverage Cans and Ends Revenue (billion), by Country 2025 & 2033
- Figure 13: South America Coatings for 3 Piece Beverage Cans and Ends Revenue Share (%), by Country 2025 & 2033
- Figure 14: Europe Coatings for 3 Piece Beverage Cans and Ends Revenue (billion), by Application 2025 & 2033
- Figure 15: Europe Coatings for 3 Piece Beverage Cans and Ends Revenue Share (%), by Application 2025 & 2033
- Figure 16: Europe Coatings for 3 Piece Beverage Cans and Ends Revenue (billion), by Types 2025 & 2033
- Figure 17: Europe Coatings for 3 Piece Beverage Cans and Ends Revenue Share (%), by Types 2025 & 2033
- Figure 18: Europe Coatings for 3 Piece Beverage Cans and Ends Revenue (billion), by Country 2025 & 2033
- Figure 19: Europe Coatings for 3 Piece Beverage Cans and Ends Revenue Share (%), by Country 2025 & 2033
- Figure 20: Middle East & Africa Coatings for 3 Piece Beverage Cans and Ends Revenue (billion), by Application 2025 & 2033
- Figure 21: Middle East & Africa Coatings for 3 Piece Beverage Cans and Ends Revenue Share (%), by Application 2025 & 2033
- Figure 22: Middle East & Africa Coatings for 3 Piece Beverage Cans and Ends Revenue (billion), by Types 2025 & 2033
- Figure 23: Middle East & Africa Coatings for 3 Piece Beverage Cans and Ends Revenue Share (%), by Types 2025 & 2033
- Figure 24: Middle East & Africa Coatings for 3 Piece Beverage Cans and Ends Revenue (billion), by Country 2025 & 2033
- Figure 25: Middle East & Africa Coatings for 3 Piece Beverage Cans and Ends Revenue Share (%), by Country 2025 & 2033
- Figure 26: Asia Pacific Coatings for 3 Piece Beverage Cans and Ends Revenue (billion), by Application 2025 & 2033
- Figure 27: Asia Pacific Coatings for 3 Piece Beverage Cans and Ends Revenue Share (%), by Application 2025 & 2033
- Figure 28: Asia Pacific Coatings for 3 Piece Beverage Cans and Ends Revenue (billion), by Types 2025 & 2033
- Figure 29: Asia Pacific Coatings for 3 Piece Beverage Cans and Ends Revenue Share (%), by Types 2025 & 2033
- Figure 30: Asia Pacific Coatings for 3 Piece Beverage Cans and Ends Revenue (billion), by Country 2025 & 2033
- Figure 31: Asia Pacific Coatings for 3 Piece Beverage Cans and Ends Revenue Share (%), by Country 2025 & 2033
List of Tables
- Table 1: Global Coatings for 3 Piece Beverage Cans and Ends Revenue billion Forecast, by Application 2020 & 2033
- Table 2: Global Coatings for 3 Piece Beverage Cans and Ends Revenue billion Forecast, by Types 2020 & 2033
- Table 3: Global Coatings for 3 Piece Beverage Cans and Ends Revenue billion Forecast, by Region 2020 & 2033
- Table 4: Global Coatings for 3 Piece Beverage Cans and Ends Revenue billion Forecast, by Application 2020 & 2033
- Table 5: Global Coatings for 3 Piece Beverage Cans and Ends Revenue billion Forecast, by Types 2020 & 2033
- Table 6: Global Coatings for 3 Piece Beverage Cans and Ends Revenue billion Forecast, by Country 2020 & 2033
- Table 7: United States Coatings for 3 Piece Beverage Cans and Ends Revenue (billion) Forecast, by Application 2020 & 2033
- Table 8: Canada Coatings for 3 Piece Beverage Cans and Ends Revenue (billion) Forecast, by Application 2020 & 2033
- Table 9: Mexico Coatings for 3 Piece Beverage Cans and Ends Revenue (billion) Forecast, by Application 2020 & 2033
- Table 10: Global Coatings for 3 Piece Beverage Cans and Ends Revenue billion Forecast, by Application 2020 & 2033
- Table 11: Global Coatings for 3 Piece Beverage Cans and Ends Revenue billion Forecast, by Types 2020 & 2033
- Table 12: Global Coatings for 3 Piece Beverage Cans and Ends Revenue billion Forecast, by Country 2020 & 2033
- Table 13: Brazil Coatings for 3 Piece Beverage Cans and Ends Revenue (billion) Forecast, by Application 2020 & 2033
- Table 14: Argentina Coatings for 3 Piece Beverage Cans and Ends Revenue (billion) Forecast, by Application 2020 & 2033
- Table 15: Rest of South America Coatings for 3 Piece Beverage Cans and Ends Revenue (billion) Forecast, by Application 2020 & 2033
- Table 16: Global Coatings for 3 Piece Beverage Cans and Ends Revenue billion Forecast, by Application 2020 & 2033
- Table 17: Global Coatings for 3 Piece Beverage Cans and Ends Revenue billion Forecast, by Types 2020 & 2033
- Table 18: Global Coatings for 3 Piece Beverage Cans and Ends Revenue billion Forecast, by Country 2020 & 2033
- Table 19: United Kingdom Coatings for 3 Piece Beverage Cans and Ends Revenue (billion) Forecast, by Application 2020 & 2033
- Table 20: Germany Coatings for 3 Piece Beverage Cans and Ends Revenue (billion) Forecast, by Application 2020 & 2033
- Table 21: France Coatings for 3 Piece Beverage Cans and Ends Revenue (billion) Forecast, by Application 2020 & 2033
- Table 22: Italy Coatings for 3 Piece Beverage Cans and Ends Revenue (billion) Forecast, by Application 2020 & 2033
- Table 23: Spain Coatings for 3 Piece Beverage Cans and Ends Revenue (billion) Forecast, by Application 2020 & 2033
- Table 24: Russia Coatings for 3 Piece Beverage Cans and Ends Revenue (billion) Forecast, by Application 2020 & 2033
- Table 25: Benelux Coatings for 3 Piece Beverage Cans and Ends Revenue (billion) Forecast, by Application 2020 & 2033
- Table 26: Nordics Coatings for 3 Piece Beverage Cans and Ends Revenue (billion) Forecast, by Application 2020 & 2033
- Table 27: Rest of Europe Coatings for 3 Piece Beverage Cans and Ends Revenue (billion) Forecast, by Application 2020 & 2033
- Table 28: Global Coatings for 3 Piece Beverage Cans and Ends Revenue billion Forecast, by Application 2020 & 2033
- Table 29: Global Coatings for 3 Piece Beverage Cans and Ends Revenue billion Forecast, by Types 2020 & 2033
- Table 30: Global Coatings for 3 Piece Beverage Cans and Ends Revenue billion Forecast, by Country 2020 & 2033
- Table 31: Turkey Coatings for 3 Piece Beverage Cans and Ends Revenue (billion) Forecast, by Application 2020 & 2033
- Table 32: Israel Coatings for 3 Piece Beverage Cans and Ends Revenue (billion) Forecast, by Application 2020 & 2033
- Table 33: GCC Coatings for 3 Piece Beverage Cans and Ends Revenue (billion) Forecast, by Application 2020 & 2033
- Table 34: North Africa Coatings for 3 Piece Beverage Cans and Ends Revenue (billion) Forecast, by Application 2020 & 2033
- Table 35: South Africa Coatings for 3 Piece Beverage Cans and Ends Revenue (billion) Forecast, by Application 2020 & 2033
- Table 36: Rest of Middle East & Africa Coatings for 3 Piece Beverage Cans and Ends Revenue (billion) Forecast, by Application 2020 & 2033
- Table 37: Global Coatings for 3 Piece Beverage Cans and Ends Revenue billion Forecast, by Application 2020 & 2033
- Table 38: Global Coatings for 3 Piece Beverage Cans and Ends Revenue billion Forecast, by Types 2020 & 2033
- Table 39: Global Coatings for 3 Piece Beverage Cans and Ends Revenue billion Forecast, by Country 2020 & 2033
- Table 40: China Coatings for 3 Piece Beverage Cans and Ends Revenue (billion) Forecast, by Application 2020 & 2033
- Table 41: India Coatings for 3 Piece Beverage Cans and Ends Revenue (billion) Forecast, by Application 2020 & 2033
- Table 42: Japan Coatings for 3 Piece Beverage Cans and Ends Revenue (billion) Forecast, by Application 2020 & 2033
- Table 43: South Korea Coatings for 3 Piece Beverage Cans and Ends Revenue (billion) Forecast, by Application 2020 & 2033
- Table 44: ASEAN Coatings for 3 Piece Beverage Cans and Ends Revenue (billion) Forecast, by Application 2020 & 2033
- Table 45: Oceania Coatings for 3 Piece Beverage Cans and Ends Revenue (billion) Forecast, by Application 2020 & 2033
- Table 46: Rest of Asia Pacific Coatings for 3 Piece Beverage Cans and Ends Revenue (billion) Forecast, by Application 2020 & 2033
Frequently Asked Questions
1. What is the projected Compound Annual Growth Rate (CAGR) of the Coatings for 3 Piece Beverage Cans and Ends?
The projected CAGR is approximately 4.46%.
2. Which companies are prominent players in the Coatings for 3 Piece Beverage Cans and Ends?
Key companies in the market include Suzhou 3N Packaging Materials Technology Co., LTD., TOYOCHEM CO., LTD., PULEMEI, YHEX, Nordsen, Sherwin-Williams.
3. What are the main segments of the Coatings for 3 Piece Beverage Cans and Ends?
The market segments include Application, Types.
4. Can you provide details about the market size?
The market size is estimated to be USD 2.76 billion as of 2022.
5. What are some drivers contributing to market growth?
N/A
6. What are the notable trends driving market growth?
N/A
7. Are there any restraints impacting market growth?
N/A
8. Can you provide examples of recent developments in the market?
N/A
9. What pricing options are available for accessing the report?
Pricing options include single-user, multi-user, and enterprise licenses priced at USD 2900.00, USD 4350.00, and USD 5800.00 respectively.
10. Is the market size provided in terms of value or volume?
The market size is provided in terms of value, measured in billion.
11. Are there any specific market keywords associated with the report?
Yes, the market keyword associated with the report is "Coatings for 3 Piece Beverage Cans and Ends," which aids in identifying and referencing the specific market segment covered.
12. How do I determine which pricing option suits my needs best?
The pricing options vary based on user requirements and access needs. Individual users may opt for single-user licenses, while businesses requiring broader access may choose multi-user or enterprise licenses for cost-effective access to the report.
13. Are there any additional resources or data provided in the Coatings for 3 Piece Beverage Cans and Ends report?
While the report offers comprehensive insights, it's advisable to review the specific contents or supplementary materials provided to ascertain if additional resources or data are available.
14. How can I stay updated on further developments or reports in the Coatings for 3 Piece Beverage Cans and Ends?
To stay informed about further developments, trends, and reports in the Coatings for 3 Piece Beverage Cans and Ends, consider subscribing to industry newsletters, following relevant companies and organizations, or regularly checking reputable industry news sources and publications.
Methodology
Step 1 - Identification of Relevant Samples Size from Population Database


Step 2 - Approaches for Defining Global Market Size (Value, Volume* & Price*)

Note*: In applicable scenarios
Step 3 - Data Sources
Primary Research
- Web Analytics
- Survey Reports
- Research Institute
- Latest Research Reports
- Opinion Leaders
Secondary Research
- Annual Reports
- White Paper
- Latest Press Release
- Industry Association
- Paid Database
- Investor Presentations

Step 4 - Data Triangulation
Involves using different sources of information in order to increase the validity of a study
These sources are likely to be stakeholders in a program - participants, other researchers, program staff, other community members, and so on.
Then we put all data in single framework & apply various statistical tools to find out the dynamic on the market.
During the analysis stage, feedback from the stakeholder groups would be compared to determine areas of agreement as well as areas of divergence