

Key Insights
The global Golf Low Speed Vehicle (LSV) market is poised for robust expansion, projected to reach an estimated USD 2.32 billion in 2025. This growth is fueled by a compelling Compound Annual Growth Rate (CAGR) of 7.17% during the forecast period of 2025-2033. A significant driver for this upward trajectory is the increasing adoption of LSVs in residential communities and commercial campuses for short-distance travel and utility purposes. Furthermore, the growing demand for eco-friendly transportation solutions, coupled with advancements in battery technology leading to improved range and performance, is propelling market penetration. The industry is also witnessing a trend towards smart features and enhanced comfort in LSVs, making them more appealing for a wider range of applications beyond traditional golf courses.
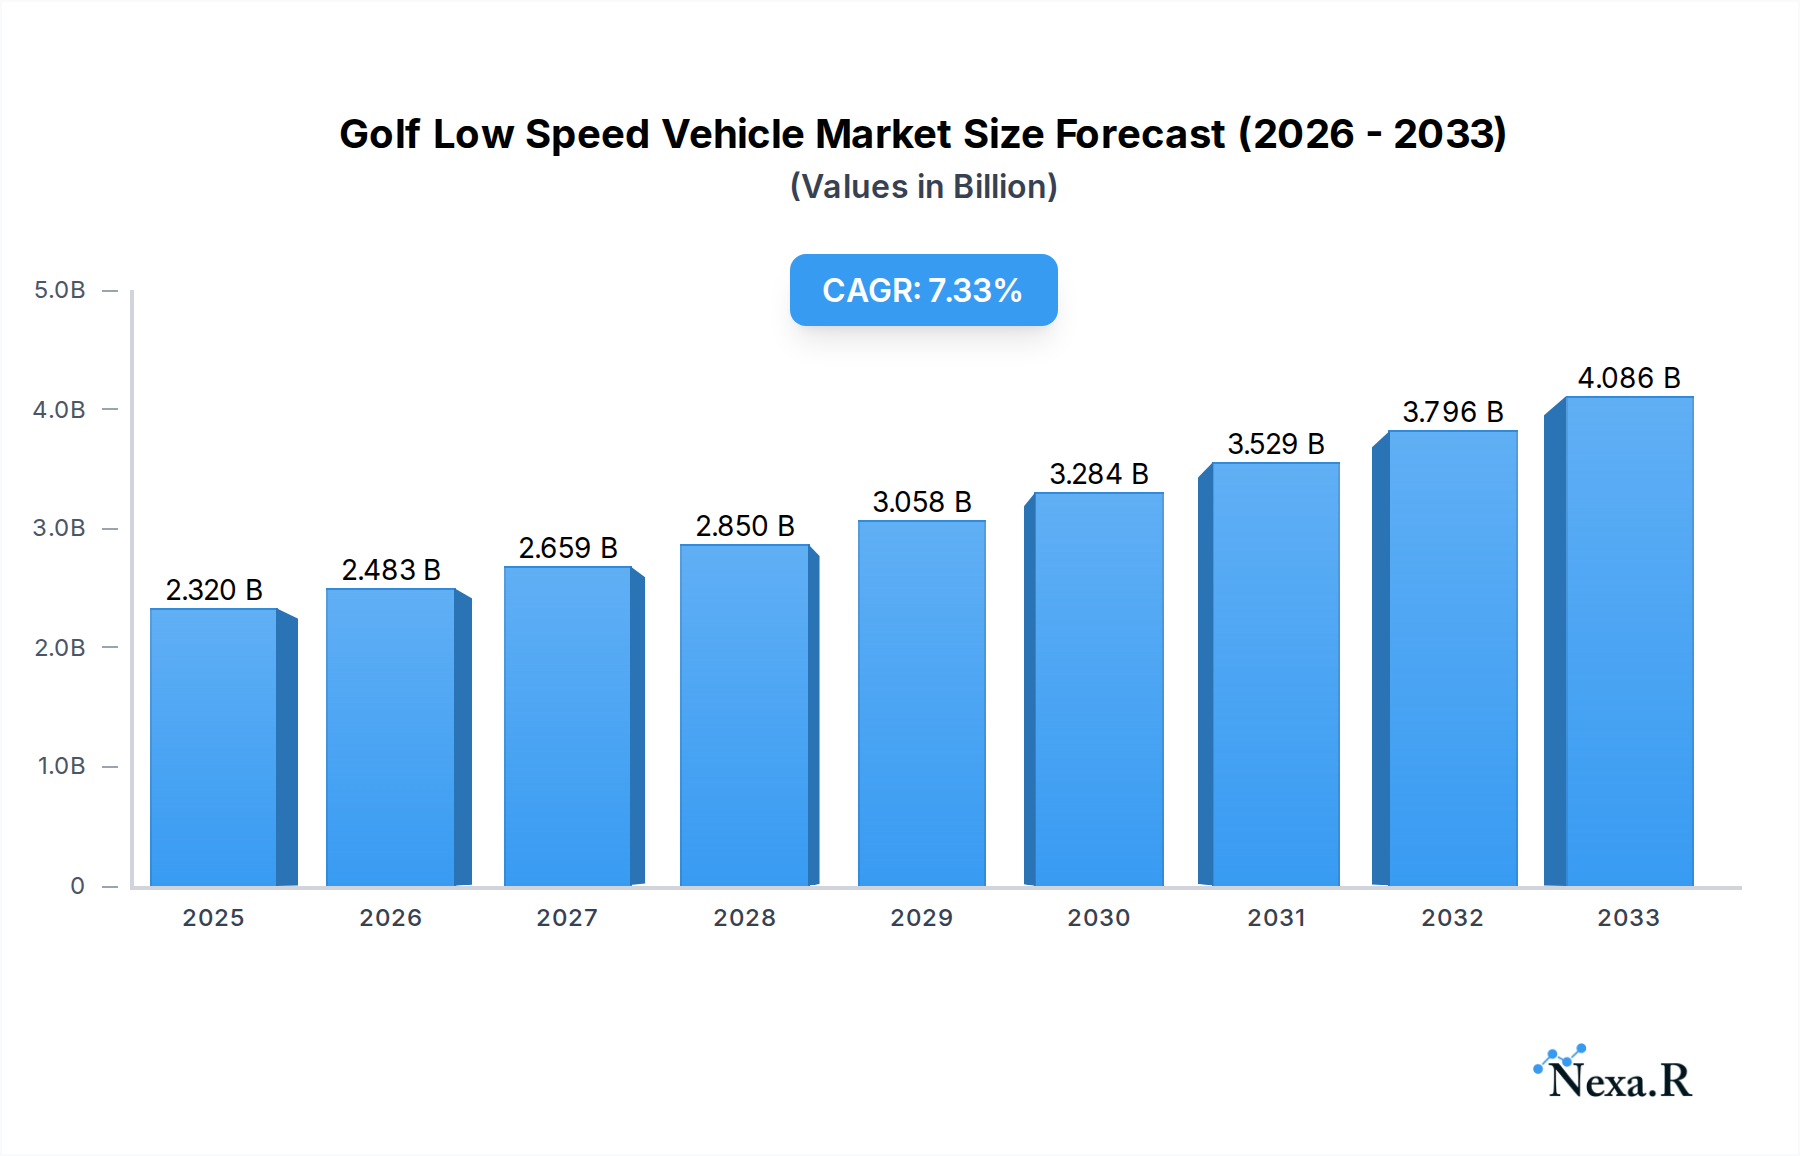
Golf Low Speed Vehicle Market Size (In Billion)
The market is segmented across various applications, including small and medium cars, and large cars, catering to diverse user needs. Type segmentation highlights the increasing prominence of electric LSVs, driven by environmental regulations and a shift towards sustainable mobility. While the market exhibits strong growth potential, certain restraints, such as regulatory hurdles in some regions and the initial cost of electric LSVs, may pose challenges. However, the widespread efforts by key players like Byvin Corporation, Yogomo, and Yamaha to innovate and expand their product portfolios are expected to mitigate these restraints. The presence of established automotive manufacturers like Renault alongside specialized LSV producers indicates a dynamic and competitive landscape, suggesting continued investment in research and development to meet evolving consumer preferences.

Golf Low Speed Vehicle Company Market Share
Golf Low Speed Vehicle Market Analysis: Growth, Trends, and Competitive Landscape (2019–2033)
This comprehensive report offers an in-depth analysis of the global Golf Low Speed Vehicle (LSV) market, exploring its dynamics, growth trajectory, competitive landscape, and future outlook from 2019 to 2033. With a base year of 2025, the report meticulously examines market segmentation, technological advancements, regulatory influences, and the strategic initiatives of key players. Uncover critical insights into the evolving needs of consumers and industries, and identify the catalysts that will shape the future of LSV adoption. This report is essential for industry professionals seeking to understand market penetration, investment opportunities, and competitive strategies in the rapidly expanding LSV sector.
Golf Low Speed Vehicle Market Dynamics & Structure
The Golf Low Speed Vehicle market is characterized by a dynamic interplay of factors influencing its structure and growth. Market concentration varies across regions, with some areas exhibiting a fragmented landscape and others dominated by a few key manufacturers. Technological innovation is a primary driver, fueled by advancements in battery technology, electric powertrains, and smart connectivity features, enabling enhanced performance and user experience. Regulatory frameworks, including safety standards and emissions regulations, play a crucial role in shaping product development and market accessibility. Competitive product substitutes, such as utility vehicles and smaller traditional cars, pose a constant challenge, pushing LSV manufacturers to differentiate through specialized features and cost-effectiveness. End-user demographics are expanding beyond traditional golf courses to include gated communities, industrial campuses, and urban mobility solutions, driving demand for diverse LSV applications. Mergers and acquisitions (M&A) are a notable trend, with established automotive players and technology firms entering the LSV space, indicating a maturing market and a drive for consolidated growth.
- Market Concentration: Moderate to high in established markets, with emerging regions showing greater fragmentation.
- Technological Innovation: Focus on battery range, charging efficiency, and autonomous capabilities.
- Regulatory Frameworks: Evolving safety and emissions standards influencing product design and market entry.
- Competitive Product Substitutes: Impacting pricing strategies and feature differentiation.
- End-User Demographics: Diversifying beyond golf courses to urban mobility and commercial applications.
- M&A Trends: Increasing consolidation as major players seek market share and technological integration.
Golf Low Speed Vehicle Growth Trends & Insights
The global Golf Low Speed Vehicle (LSV) market is poised for significant expansion, driven by a confluence of factors including increasing urbanization, a growing demand for sustainable transportation, and the expanding applications of LSVs beyond their traditional golf course use. The market size evolution is projected to witness a robust Compound Annual Growth Rate (CAGR) during the forecast period. This growth is underpinned by rising adoption rates, particularly in North America and Europe, where environmental consciousness and the need for efficient short-distance mobility are paramount. Technological disruptions are continuously reshaping the LSV landscape, with advancements in lithium-ion battery technology leading to improved range, faster charging times, and reduced battery costs, making electric LSVs increasingly attractive. Furthermore, the integration of smart features, such as GPS tracking, remote diagnostics, and personalized user interfaces, is enhancing the appeal and functionality of these vehicles.
Consumer behavior shifts are also playing a pivotal role. A growing segment of the population is actively seeking eco-friendly alternatives to traditional internal combustion engine vehicles for last-mile connectivity and within campus environments. This preference for sustainable solutions, coupled with the inherent cost-effectiveness and ease of operation of LSVs, is driving market penetration across various end-user segments. The development of specialized LSV models tailored for specific applications, such as last-mile delivery, campus security, and resort transportation, further fuels market expansion. The rising disposable incomes in emerging economies and government initiatives promoting electric mobility are expected to unlock new growth avenues. Analyzing these trends, the LSV market is not just about golf courses anymore; it's a burgeoning segment within the broader electric vehicle ecosystem. The estimated market size for LSVs in the base year of 2025 is valued at approximately $15.2 billion units, with projections indicating substantial growth to $27.5 billion units by 2033. This represents a CAGR of approximately 7.8%. The market penetration is steadily increasing, with electric variants capturing an ever-larger share of the total LSV market.
Dominant Regions, Countries, or Segments in Golf Low Speed Vehicle
North America currently stands as the dominant region in the global Golf Low Speed Vehicle (LSV) market, driven by a well-established golf culture, a strong emphasis on sustainable urban mobility, and supportive regulatory frameworks. Within North America, the United States leads the charge, accounting for a significant portion of LSV sales and usage. This dominance is attributed to a combination of factors:
- Economic Policies: Favorable incentives for electric vehicles, including tax credits and rebates, have made LSVs more accessible to consumers and businesses. The investment in green infrastructure further supports the adoption of electric LSVs.
- Infrastructure Development: The presence of numerous golf courses, retirement communities, and large campuses with dedicated pathways and infrastructure conducive to LSV operation provides a ready market. Many municipalities are also adapting urban planning to accommodate LSVs in specific zones.
- Consumer Preferences: A growing awareness and preference for environmentally friendly transportation solutions, coupled with the convenience and cost-effectiveness of LSVs for short-distance travel, are key demand drivers. The increasing popularity of recreational activities and outdoor living also contributes to LSV adoption.
- Technological Adoption: The early adoption of electric vehicle technology and a receptive consumer base for new mobility solutions have positioned North America at the forefront of LSV innovation and sales.
The Electric segment within the Type category is witnessing the most robust growth and dominance across all regions, including North America. This is a direct consequence of global trends favoring electrification and emission reduction. Electric LSVs offer lower operating costs, reduced environmental impact, and quieter operation, making them increasingly appealing to both consumers and commercial entities. The Small and Medium Car application segment also plays a crucial role in market dominance, as LSVs are often designed to navigate confined spaces and offer an alternative to traditional cars for personal and commercial use in urban environments and residential areas. The market share for electric LSVs in North America is estimated to be around 65% of the total LSV market in 2025, with a projected growth to 80% by 2033. The small and medium car application segment accounts for an estimated 55% market share in 2025.
Golf Low Speed Vehicle Product Landscape
The Golf Low Speed Vehicle (LSV) product landscape is evolving rapidly, with manufacturers focusing on enhancing performance, safety, and user experience. Innovations in battery technology, particularly the widespread adoption of lithium-ion batteries, have significantly improved range and reduced charging times, making electric LSVs a viable and attractive option. Products are increasingly incorporating advanced features such as regenerative braking systems for energy efficiency, sophisticated suspension for a smoother ride, and durable chassis designs for longevity. Connectivity features, including GPS, Bluetooth integration, and onboard diagnostics, are becoming standard, offering enhanced convenience and operational insights. Manufacturers are also diversifying their offerings with specialized models designed for various applications, from enhanced comfort on golf courses to practical utility for campus environments and light cargo transport. The unique selling propositions often lie in customizability, adherence to evolving safety standards, and competitive pricing.
Key Drivers, Barriers & Challenges in Golf Low Speed Vehicle
Key Drivers:
- Growing Demand for Electric & Sustainable Mobility: Increasing environmental consciousness and stricter emissions regulations are propelling the shift towards electric LSVs.
- Technological Advancements: Innovations in battery technology, motor efficiency, and smart features enhance performance, range, and user appeal.
- Expanding Applications: Beyond golf, LSVs are finding utility in residential communities, industrial campuses, resorts, and last-mile delivery, broadening the market base.
- Cost-Effectiveness: Lower operating and maintenance costs compared to traditional vehicles make LSVs an attractive economic option for short-distance travel.
- Government Incentives: Subsidies and tax credits for electric vehicles further encourage LSV adoption.
Barriers & Challenges:
- Limited Range Anxiety: While improving, the range of some electric LSVs can still be a concern for certain use cases.
- Infrastructure Limitations: Lack of widespread charging infrastructure in some areas can hinder adoption.
- Regulatory Variations: Inconsistent regulations across different jurisdictions can create market access challenges.
- Perceived Safety Concerns: Public perception regarding the safety of LSVs in mixed traffic environments needs to be addressed.
- Competition from Emerging Technologies: The development of other micro-mobility solutions could pose competition.
- Supply Chain Disruptions: Global supply chain issues can impact the availability and cost of components, particularly batteries.
Emerging Opportunities in Golf Low Speed Vehicle
Emerging opportunities in the Golf Low Speed Vehicle (LSV) market are diverse and promising. The burgeoning last-mile delivery and logistics sector presents a significant growth avenue, with LSVs offering an efficient and eco-friendly solution for urban deliveries. Furthermore, the increasing adoption of shared mobility services for campuses, resorts, and even urban centers opens up new business models and revenue streams. The development of autonomous LSVs for controlled environments like retirement communities and industrial parks is another frontier, promising enhanced safety and convenience. Tapping into the Asian market, particularly in developing economies with growing urban populations and a need for affordable personal transport, offers substantial untapped potential. The integration of advanced connectivity and IoT solutions for fleet management and personalized user experiences will also drive demand for next-generation LSVs.
Growth Accelerators in the Golf Low Speed Vehicle Industry
Several key factors are accelerating growth in the Golf Low Speed Vehicle (LSV) industry. The relentless pace of technological breakthroughs, especially in battery energy density and charging infrastructure, is making electric LSVs more practical and cost-competitive than ever before. Strategic partnerships and collaborations between LSV manufacturers, battery technology providers, and automotive giants are fostering innovation and streamlining production. Furthermore, proactive market expansion strategies, targeting new geographies and diverse end-user segments beyond traditional golf applications, are crucial growth accelerators. The development of specialized LSV models tailored to specific industrial needs, such as waste management or security patrols, further solidifies market penetration. Investment in robust research and development to continuously improve vehicle performance, safety features, and user interfaces will maintain the industry's upward trajectory.
Key Players Shaping the Golf Low Speed Vehicle Market
- Byvin Corporation
- Yogomo
- Shifeng
- Ingersoll Rand
- Dojo
- Textron
- Lichi
- Polaris
- Yamaha
- GreenWheel EV
- Xinyuzhou
- Renault
- Eagle
- Tangjun
Notable Milestones in Golf Low Speed Vehicle Sector
- 2019: Increased regulatory clarity in several US states regarding LSV usage on public roads, boosting sales.
- 2020: Significant advancements in lithium-ion battery technology leading to longer ranges and faster charging times for electric LSVs.
- 2021: Emergence of new entrants and increased M&A activity as major automotive players and tech companies show interest in the LSV market.
- 2022: Introduction of more sophisticated connectivity features and advanced safety systems in newly launched LSV models.
- 2023: Growing adoption of LSVs for last-mile delivery services and in urban micro-mobility initiatives.
- 2024: Increased focus on sustainability and the development of LSVs using recycled materials and eco-friendly manufacturing processes.
In-Depth Golf Low Speed Vehicle Market Outlook
The future outlook for the Golf Low Speed Vehicle (LSV) market is exceptionally positive, driven by a confluence of sustained growth accelerators and emerging opportunities. Continued technological innovation, particularly in battery technology and vehicle efficiency, will further democratize LSV ownership and operation. Strategic partnerships will foster greater integration of LSVs into broader mobility ecosystems. The expansion into untapped geographic markets and the diversification of applications beyond golf will fuel significant market penetration. Companies focusing on developing smart, connected, and sustainable LSV solutions are best positioned for long-term success. The inherent cost-effectiveness and environmental benefits of LSVs will continue to make them an attractive choice for consumers and businesses alike, solidifying their role in shaping the future of personal and commercial transportation. The global LSV market is projected to reach an estimated $27.5 billion units by 2033, demonstrating a robust growth trajectory.
Golf Low Speed Vehicle Segmentation
-
1. Application
- 1.1. Small and Medium Car
- 1.2. Large Car
-
2. Type
- 2.1. Electric
- 2.2. Diesel
- 2.3. Gasoline
Golf Low Speed Vehicle Segmentation By Geography
-
1. North America
- 1.1. United States
- 1.2. Canada
- 1.3. Mexico
-
2. South America
- 2.1. Brazil
- 2.2. Argentina
- 2.3. Rest of South America
-
3. Europe
- 3.1. United Kingdom
- 3.2. Germany
- 3.3. France
- 3.4. Italy
- 3.5. Spain
- 3.6. Russia
- 3.7. Benelux
- 3.8. Nordics
- 3.9. Rest of Europe
-
4. Middle East & Africa
- 4.1. Turkey
- 4.2. Israel
- 4.3. GCC
- 4.4. North Africa
- 4.5. South Africa
- 4.6. Rest of Middle East & Africa
-
5. Asia Pacific
- 5.1. China
- 5.2. India
- 5.3. Japan
- 5.4. South Korea
- 5.5. ASEAN
- 5.6. Oceania
- 5.7. Rest of Asia Pacific
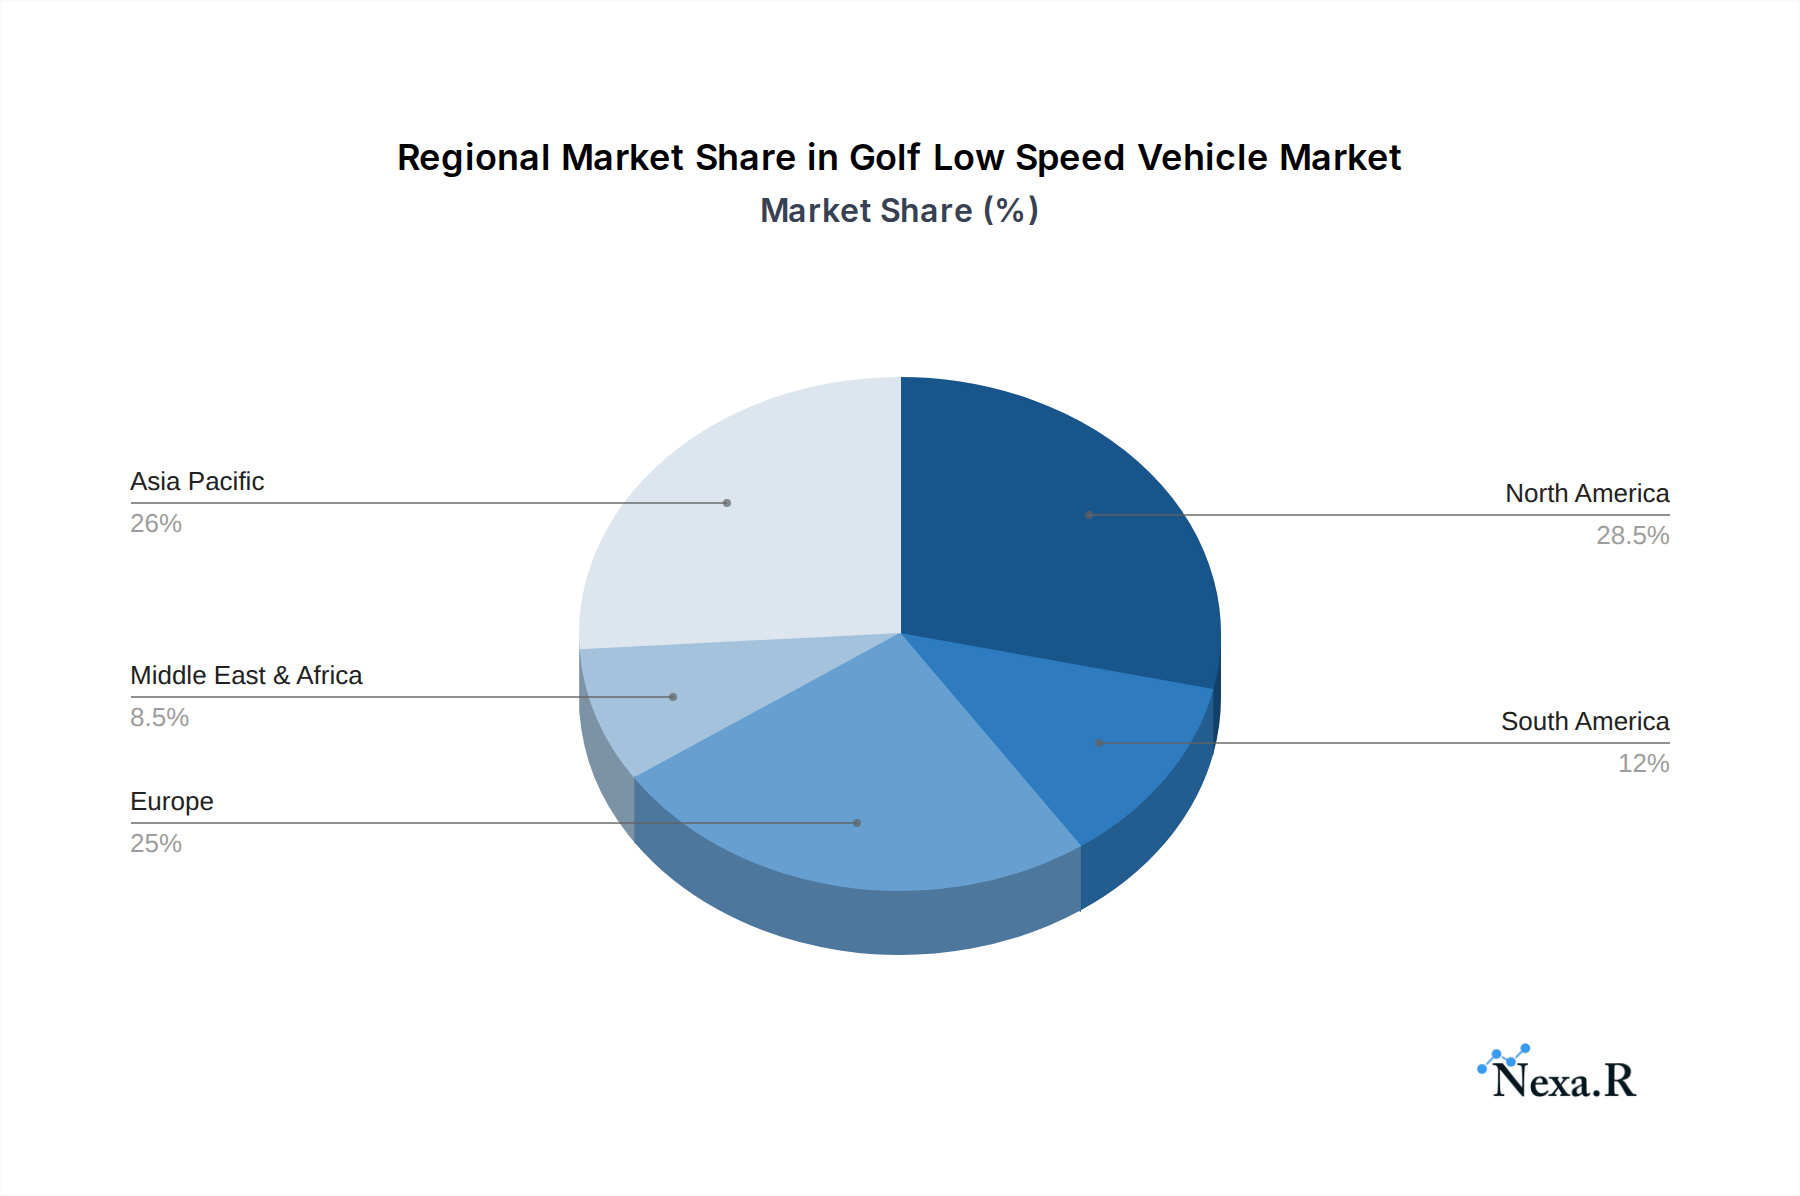
Golf Low Speed Vehicle Regional Market Share
Geographic Coverage of Golf Low Speed Vehicle
Golf Low Speed Vehicle REPORT HIGHLIGHTS
| Aspects | Details |
|---|---|
| Study Period | 2020-2034 |
| Base Year | 2025 |
| Estimated Year | 2026 |
| Forecast Period | 2026-2034 |
| Historical Period | 2020-2025 |
| Growth Rate | CAGR of 7.17% from 2020-2034 |
| Segmentation |
|
Table of Contents
- 1. Introduction
- 1.1. Research Scope
- 1.2. Market Segmentation
- 1.3. Research Methodology
- 1.4. Definitions and Assumptions
- 2. Executive Summary
- 2.1. Introduction
- 3. Market Dynamics
- 3.1. Introduction
- 3.2. Market Drivers
- 3.3. Market Restrains
- 3.4. Market Trends
- 4. Market Factor Analysis
- 4.1. Porters Five Forces
- 4.2. Supply/Value Chain
- 4.3. PESTEL analysis
- 4.4. Market Entropy
- 4.5. Patent/Trademark Analysis
- 5. Global Golf Low Speed Vehicle Analysis, Insights and Forecast, 2020-2032
- 5.1. Market Analysis, Insights and Forecast - by Application
- 5.1.1. Small and Medium Car
- 5.1.2. Large Car
- 5.2. Market Analysis, Insights and Forecast - by Type
- 5.2.1. Electric
- 5.2.2. Diesel
- 5.2.3. Gasoline
- 5.3. Market Analysis, Insights and Forecast - by Region
- 5.3.1. North America
- 5.3.2. South America
- 5.3.3. Europe
- 5.3.4. Middle East & Africa
- 5.3.5. Asia Pacific
- 5.1. Market Analysis, Insights and Forecast - by Application
- 6. North America Golf Low Speed Vehicle Analysis, Insights and Forecast, 2020-2032
- 6.1. Market Analysis, Insights and Forecast - by Application
- 6.1.1. Small and Medium Car
- 6.1.2. Large Car
- 6.2. Market Analysis, Insights and Forecast - by Type
- 6.2.1. Electric
- 6.2.2. Diesel
- 6.2.3. Gasoline
- 6.1. Market Analysis, Insights and Forecast - by Application
- 7. South America Golf Low Speed Vehicle Analysis, Insights and Forecast, 2020-2032
- 7.1. Market Analysis, Insights and Forecast - by Application
- 7.1.1. Small and Medium Car
- 7.1.2. Large Car
- 7.2. Market Analysis, Insights and Forecast - by Type
- 7.2.1. Electric
- 7.2.2. Diesel
- 7.2.3. Gasoline
- 7.1. Market Analysis, Insights and Forecast - by Application
- 8. Europe Golf Low Speed Vehicle Analysis, Insights and Forecast, 2020-2032
- 8.1. Market Analysis, Insights and Forecast - by Application
- 8.1.1. Small and Medium Car
- 8.1.2. Large Car
- 8.2. Market Analysis, Insights and Forecast - by Type
- 8.2.1. Electric
- 8.2.2. Diesel
- 8.2.3. Gasoline
- 8.1. Market Analysis, Insights and Forecast - by Application
- 9. Middle East & Africa Golf Low Speed Vehicle Analysis, Insights and Forecast, 2020-2032
- 9.1. Market Analysis, Insights and Forecast - by Application
- 9.1.1. Small and Medium Car
- 9.1.2. Large Car
- 9.2. Market Analysis, Insights and Forecast - by Type
- 9.2.1. Electric
- 9.2.2. Diesel
- 9.2.3. Gasoline
- 9.1. Market Analysis, Insights and Forecast - by Application
- 10. Asia Pacific Golf Low Speed Vehicle Analysis, Insights and Forecast, 2020-2032
- 10.1. Market Analysis, Insights and Forecast - by Application
- 10.1.1. Small and Medium Car
- 10.1.2. Large Car
- 10.2. Market Analysis, Insights and Forecast - by Type
- 10.2.1. Electric
- 10.2.2. Diesel
- 10.2.3. Gasoline
- 10.1. Market Analysis, Insights and Forecast - by Application
- 11. Competitive Analysis
- 11.1. Global Market Share Analysis 2025
- 11.2. Company Profiles
- 11.2.1 Byvin Corporation
- 11.2.1.1. Overview
- 11.2.1.2. Products
- 11.2.1.3. SWOT Analysis
- 11.2.1.4. Recent Developments
- 11.2.1.5. Financials (Based on Availability)
- 11.2.2 Yogomo
- 11.2.2.1. Overview
- 11.2.2.2. Products
- 11.2.2.3. SWOT Analysis
- 11.2.2.4. Recent Developments
- 11.2.2.5. Financials (Based on Availability)
- 11.2.3 Shifeng
- 11.2.3.1. Overview
- 11.2.3.2. Products
- 11.2.3.3. SWOT Analysis
- 11.2.3.4. Recent Developments
- 11.2.3.5. Financials (Based on Availability)
- 11.2.4 Ingersoll Rand
- 11.2.4.1. Overview
- 11.2.4.2. Products
- 11.2.4.3. SWOT Analysis
- 11.2.4.4. Recent Developments
- 11.2.4.5. Financials (Based on Availability)
- 11.2.5 Dojo
- 11.2.5.1. Overview
- 11.2.5.2. Products
- 11.2.5.3. SWOT Analysis
- 11.2.5.4. Recent Developments
- 11.2.5.5. Financials (Based on Availability)
- 11.2.6 Textron
- 11.2.6.1. Overview
- 11.2.6.2. Products
- 11.2.6.3. SWOT Analysis
- 11.2.6.4. Recent Developments
- 11.2.6.5. Financials (Based on Availability)
- 11.2.7 Lichi
- 11.2.7.1. Overview
- 11.2.7.2. Products
- 11.2.7.3. SWOT Analysis
- 11.2.7.4. Recent Developments
- 11.2.7.5. Financials (Based on Availability)
- 11.2.8 Polaris
- 11.2.8.1. Overview
- 11.2.8.2. Products
- 11.2.8.3. SWOT Analysis
- 11.2.8.4. Recent Developments
- 11.2.8.5. Financials (Based on Availability)
- 11.2.9 Yamaha
- 11.2.9.1. Overview
- 11.2.9.2. Products
- 11.2.9.3. SWOT Analysis
- 11.2.9.4. Recent Developments
- 11.2.9.5. Financials (Based on Availability)
- 11.2.10 GreenWheel EV
- 11.2.10.1. Overview
- 11.2.10.2. Products
- 11.2.10.3. SWOT Analysis
- 11.2.10.4. Recent Developments
- 11.2.10.5. Financials (Based on Availability)
- 11.2.11 Xinyuzhou
- 11.2.11.1. Overview
- 11.2.11.2. Products
- 11.2.11.3. SWOT Analysis
- 11.2.11.4. Recent Developments
- 11.2.11.5. Financials (Based on Availability)
- 11.2.12 Renault
- 11.2.12.1. Overview
- 11.2.12.2. Products
- 11.2.12.3. SWOT Analysis
- 11.2.12.4. Recent Developments
- 11.2.12.5. Financials (Based on Availability)
- 11.2.13 Eagle
- 11.2.13.1. Overview
- 11.2.13.2. Products
- 11.2.13.3. SWOT Analysis
- 11.2.13.4. Recent Developments
- 11.2.13.5. Financials (Based on Availability)
- 11.2.14 Tangjun
- 11.2.14.1. Overview
- 11.2.14.2. Products
- 11.2.14.3. SWOT Analysis
- 11.2.14.4. Recent Developments
- 11.2.14.5. Financials (Based on Availability)
- 11.2.1 Byvin Corporation
List of Figures
- Figure 1: Global Golf Low Speed Vehicle Revenue Breakdown (billion, %) by Region 2025 & 2033
- Figure 2: North America Golf Low Speed Vehicle Revenue (billion), by Application 2025 & 2033
- Figure 3: North America Golf Low Speed Vehicle Revenue Share (%), by Application 2025 & 2033
- Figure 4: North America Golf Low Speed Vehicle Revenue (billion), by Type 2025 & 2033
- Figure 5: North America Golf Low Speed Vehicle Revenue Share (%), by Type 2025 & 2033
- Figure 6: North America Golf Low Speed Vehicle Revenue (billion), by Country 2025 & 2033
- Figure 7: North America Golf Low Speed Vehicle Revenue Share (%), by Country 2025 & 2033
- Figure 8: South America Golf Low Speed Vehicle Revenue (billion), by Application 2025 & 2033
- Figure 9: South America Golf Low Speed Vehicle Revenue Share (%), by Application 2025 & 2033
- Figure 10: South America Golf Low Speed Vehicle Revenue (billion), by Type 2025 & 2033
- Figure 11: South America Golf Low Speed Vehicle Revenue Share (%), by Type 2025 & 2033
- Figure 12: South America Golf Low Speed Vehicle Revenue (billion), by Country 2025 & 2033
- Figure 13: South America Golf Low Speed Vehicle Revenue Share (%), by Country 2025 & 2033
- Figure 14: Europe Golf Low Speed Vehicle Revenue (billion), by Application 2025 & 2033
- Figure 15: Europe Golf Low Speed Vehicle Revenue Share (%), by Application 2025 & 2033
- Figure 16: Europe Golf Low Speed Vehicle Revenue (billion), by Type 2025 & 2033
- Figure 17: Europe Golf Low Speed Vehicle Revenue Share (%), by Type 2025 & 2033
- Figure 18: Europe Golf Low Speed Vehicle Revenue (billion), by Country 2025 & 2033
- Figure 19: Europe Golf Low Speed Vehicle Revenue Share (%), by Country 2025 & 2033
- Figure 20: Middle East & Africa Golf Low Speed Vehicle Revenue (billion), by Application 2025 & 2033
- Figure 21: Middle East & Africa Golf Low Speed Vehicle Revenue Share (%), by Application 2025 & 2033
- Figure 22: Middle East & Africa Golf Low Speed Vehicle Revenue (billion), by Type 2025 & 2033
- Figure 23: Middle East & Africa Golf Low Speed Vehicle Revenue Share (%), by Type 2025 & 2033
- Figure 24: Middle East & Africa Golf Low Speed Vehicle Revenue (billion), by Country 2025 & 2033
- Figure 25: Middle East & Africa Golf Low Speed Vehicle Revenue Share (%), by Country 2025 & 2033
- Figure 26: Asia Pacific Golf Low Speed Vehicle Revenue (billion), by Application 2025 & 2033
- Figure 27: Asia Pacific Golf Low Speed Vehicle Revenue Share (%), by Application 2025 & 2033
- Figure 28: Asia Pacific Golf Low Speed Vehicle Revenue (billion), by Type 2025 & 2033
- Figure 29: Asia Pacific Golf Low Speed Vehicle Revenue Share (%), by Type 2025 & 2033
- Figure 30: Asia Pacific Golf Low Speed Vehicle Revenue (billion), by Country 2025 & 2033
- Figure 31: Asia Pacific Golf Low Speed Vehicle Revenue Share (%), by Country 2025 & 2033
List of Tables
- Table 1: Global Golf Low Speed Vehicle Revenue billion Forecast, by Application 2020 & 2033
- Table 2: Global Golf Low Speed Vehicle Revenue billion Forecast, by Type 2020 & 2033
- Table 3: Global Golf Low Speed Vehicle Revenue billion Forecast, by Region 2020 & 2033
- Table 4: Global Golf Low Speed Vehicle Revenue billion Forecast, by Application 2020 & 2033
- Table 5: Global Golf Low Speed Vehicle Revenue billion Forecast, by Type 2020 & 2033
- Table 6: Global Golf Low Speed Vehicle Revenue billion Forecast, by Country 2020 & 2033
- Table 7: United States Golf Low Speed Vehicle Revenue (billion) Forecast, by Application 2020 & 2033
- Table 8: Canada Golf Low Speed Vehicle Revenue (billion) Forecast, by Application 2020 & 2033
- Table 9: Mexico Golf Low Speed Vehicle Revenue (billion) Forecast, by Application 2020 & 2033
- Table 10: Global Golf Low Speed Vehicle Revenue billion Forecast, by Application 2020 & 2033
- Table 11: Global Golf Low Speed Vehicle Revenue billion Forecast, by Type 2020 & 2033
- Table 12: Global Golf Low Speed Vehicle Revenue billion Forecast, by Country 2020 & 2033
- Table 13: Brazil Golf Low Speed Vehicle Revenue (billion) Forecast, by Application 2020 & 2033
- Table 14: Argentina Golf Low Speed Vehicle Revenue (billion) Forecast, by Application 2020 & 2033
- Table 15: Rest of South America Golf Low Speed Vehicle Revenue (billion) Forecast, by Application 2020 & 2033
- Table 16: Global Golf Low Speed Vehicle Revenue billion Forecast, by Application 2020 & 2033
- Table 17: Global Golf Low Speed Vehicle Revenue billion Forecast, by Type 2020 & 2033
- Table 18: Global Golf Low Speed Vehicle Revenue billion Forecast, by Country 2020 & 2033
- Table 19: United Kingdom Golf Low Speed Vehicle Revenue (billion) Forecast, by Application 2020 & 2033
- Table 20: Germany Golf Low Speed Vehicle Revenue (billion) Forecast, by Application 2020 & 2033
- Table 21: France Golf Low Speed Vehicle Revenue (billion) Forecast, by Application 2020 & 2033
- Table 22: Italy Golf Low Speed Vehicle Revenue (billion) Forecast, by Application 2020 & 2033
- Table 23: Spain Golf Low Speed Vehicle Revenue (billion) Forecast, by Application 2020 & 2033
- Table 24: Russia Golf Low Speed Vehicle Revenue (billion) Forecast, by Application 2020 & 2033
- Table 25: Benelux Golf Low Speed Vehicle Revenue (billion) Forecast, by Application 2020 & 2033
- Table 26: Nordics Golf Low Speed Vehicle Revenue (billion) Forecast, by Application 2020 & 2033
- Table 27: Rest of Europe Golf Low Speed Vehicle Revenue (billion) Forecast, by Application 2020 & 2033
- Table 28: Global Golf Low Speed Vehicle Revenue billion Forecast, by Application 2020 & 2033
- Table 29: Global Golf Low Speed Vehicle Revenue billion Forecast, by Type 2020 & 2033
- Table 30: Global Golf Low Speed Vehicle Revenue billion Forecast, by Country 2020 & 2033
- Table 31: Turkey Golf Low Speed Vehicle Revenue (billion) Forecast, by Application 2020 & 2033
- Table 32: Israel Golf Low Speed Vehicle Revenue (billion) Forecast, by Application 2020 & 2033
- Table 33: GCC Golf Low Speed Vehicle Revenue (billion) Forecast, by Application 2020 & 2033
- Table 34: North Africa Golf Low Speed Vehicle Revenue (billion) Forecast, by Application 2020 & 2033
- Table 35: South Africa Golf Low Speed Vehicle Revenue (billion) Forecast, by Application 2020 & 2033
- Table 36: Rest of Middle East & Africa Golf Low Speed Vehicle Revenue (billion) Forecast, by Application 2020 & 2033
- Table 37: Global Golf Low Speed Vehicle Revenue billion Forecast, by Application 2020 & 2033
- Table 38: Global Golf Low Speed Vehicle Revenue billion Forecast, by Type 2020 & 2033
- Table 39: Global Golf Low Speed Vehicle Revenue billion Forecast, by Country 2020 & 2033
- Table 40: China Golf Low Speed Vehicle Revenue (billion) Forecast, by Application 2020 & 2033
- Table 41: India Golf Low Speed Vehicle Revenue (billion) Forecast, by Application 2020 & 2033
- Table 42: Japan Golf Low Speed Vehicle Revenue (billion) Forecast, by Application 2020 & 2033
- Table 43: South Korea Golf Low Speed Vehicle Revenue (billion) Forecast, by Application 2020 & 2033
- Table 44: ASEAN Golf Low Speed Vehicle Revenue (billion) Forecast, by Application 2020 & 2033
- Table 45: Oceania Golf Low Speed Vehicle Revenue (billion) Forecast, by Application 2020 & 2033
- Table 46: Rest of Asia Pacific Golf Low Speed Vehicle Revenue (billion) Forecast, by Application 2020 & 2033
Frequently Asked Questions
1. What is the projected Compound Annual Growth Rate (CAGR) of the Golf Low Speed Vehicle?
The projected CAGR is approximately 7.17%.
2. Which companies are prominent players in the Golf Low Speed Vehicle?
Key companies in the market include Byvin Corporation, Yogomo, Shifeng, Ingersoll Rand, Dojo, Textron, Lichi, Polaris, Yamaha, GreenWheel EV, Xinyuzhou, Renault, Eagle, Tangjun.
3. What are the main segments of the Golf Low Speed Vehicle?
The market segments include Application, Type.
4. Can you provide details about the market size?
The market size is estimated to be USD 2.32 billion as of 2022.
5. What are some drivers contributing to market growth?
N/A
6. What are the notable trends driving market growth?
N/A
7. Are there any restraints impacting market growth?
N/A
8. Can you provide examples of recent developments in the market?
N/A
9. What pricing options are available for accessing the report?
Pricing options include single-user, multi-user, and enterprise licenses priced at USD 4250.00, USD 6375.00, and USD 8500.00 respectively.
10. Is the market size provided in terms of value or volume?
The market size is provided in terms of value, measured in billion.
11. Are there any specific market keywords associated with the report?
Yes, the market keyword associated with the report is "Golf Low Speed Vehicle," which aids in identifying and referencing the specific market segment covered.
12. How do I determine which pricing option suits my needs best?
The pricing options vary based on user requirements and access needs. Individual users may opt for single-user licenses, while businesses requiring broader access may choose multi-user or enterprise licenses for cost-effective access to the report.
13. Are there any additional resources or data provided in the Golf Low Speed Vehicle report?
While the report offers comprehensive insights, it's advisable to review the specific contents or supplementary materials provided to ascertain if additional resources or data are available.
14. How can I stay updated on further developments or reports in the Golf Low Speed Vehicle?
To stay informed about further developments, trends, and reports in the Golf Low Speed Vehicle, consider subscribing to industry newsletters, following relevant companies and organizations, or regularly checking reputable industry news sources and publications.
Methodology
Step 1 - Identification of Relevant Samples Size from Population Database


Step 2 - Approaches for Defining Global Market Size (Value, Volume* & Price*)

Note*: In applicable scenarios
Step 3 - Data Sources
Primary Research
- Web Analytics
- Survey Reports
- Research Institute
- Latest Research Reports
- Opinion Leaders
Secondary Research
- Annual Reports
- White Paper
- Latest Press Release
- Industry Association
- Paid Database
- Investor Presentations

Step 4 - Data Triangulation
Involves using different sources of information in order to increase the validity of a study
These sources are likely to be stakeholders in a program - participants, other researchers, program staff, other community members, and so on.
Then we put all data in single framework & apply various statistical tools to find out the dynamic on the market.
During the analysis stage, feedback from the stakeholder groups would be compared to determine areas of agreement as well as areas of divergence