

Key Insights
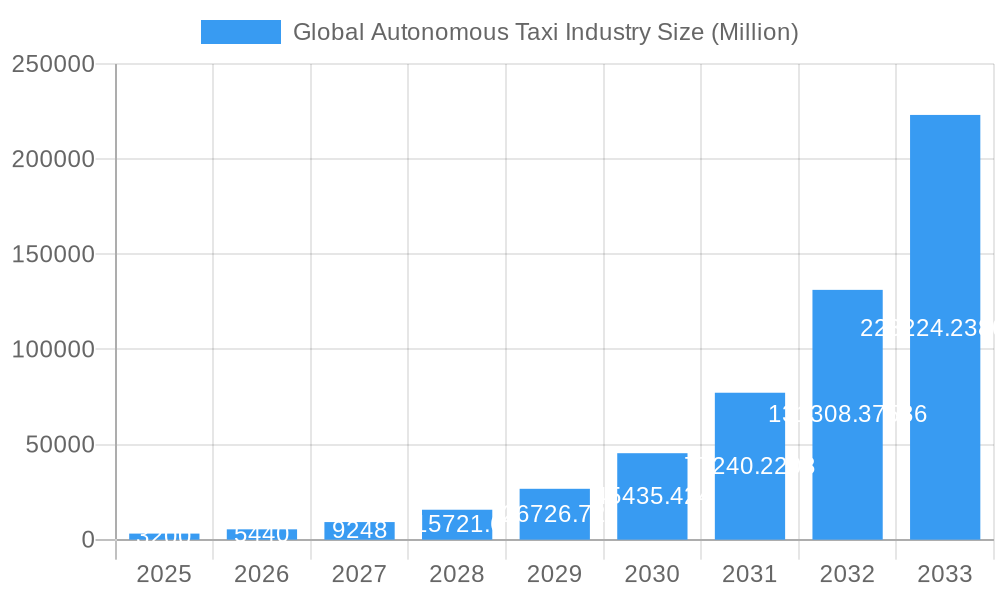
The global autonomous taxi market is experiencing rapid expansion, projected to grow at a Compound Annual Growth Rate (CAGR) of 70.00%. The market is anticipated to grow from an estimated $0.61 billion in 2025 to $82,150 million by 2033. This significant growth is propelled by advancements in AI and sensor technology, alongside increasing consumer demand for efficient, safe, and economical mobility. The trend towards electric vehicle adoption further complements the autonomous taxi sector, offering reduced operational costs and environmental benefits. Supportive regulatory frameworks in key regions are also facilitating commercial deployment and investment.
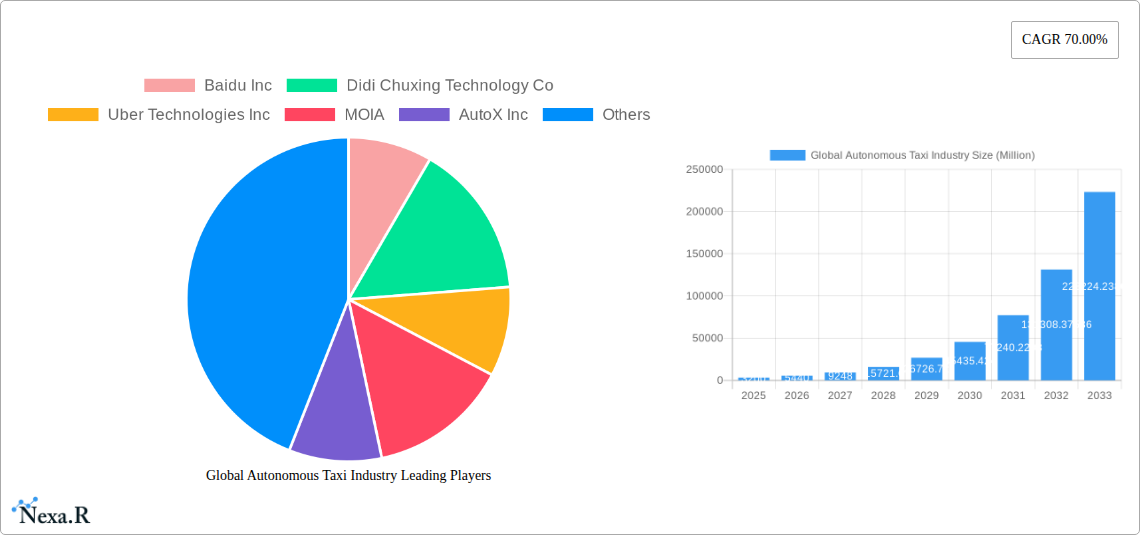
Global Autonomous Taxi Industry Market Size (In Million)
The market is segmented by autonomy levels, with a strong emphasis on Level 4 and Level 5. Electric vehicles lead propulsion technologies, supported by hybrid and fuel cell electric vehicles. Key vehicle types include cars and vans/shuttles, serving both passenger and goods transportation. Rental-based and station-based models are central to current service strategies. Leading companies such as Baidu Inc., Didi Chuxing, Uber Technologies Inc., Waymo LLC, and GM Cruise are driving innovation. North America and Asia Pacific, especially China, are expected to be leading adoption regions due to favorable government initiatives and substantial R&D investments.
Global Autonomous Taxi Industry Company Market Share
Global Autonomous Taxi Industry: Market Analysis and Forecast (2025-2033)
This report offers an in-depth analysis and forecast of the global autonomous taxi market from 2025 to 2033. It provides critical insights into market dynamics, growth trends, regional performance, product segmentation, key players, and emerging opportunities for industry professionals. The market is meticulously analyzed by autonomy level (Level 4, Level 5), propulsion (Electric Vehicles, Hybrid Vehicles, Fuel Cell Electric Vehicles), vehicle type (Car, Van/Shuttle), application (Passenger Transportation, Goods Transportation), and service type (Rental-Based, Station-Based). All quantitative data is presented in billion units.
Global Autonomous Taxi Industry Market Dynamics & Structure
The global autonomous taxi market is characterized by intense technological innovation and a dynamic competitive landscape, driven by advancements in AI, lidar, and sensor technology. Market concentration is gradually shifting as established automotive giants and tech behemoths vie for dominance. Key drivers include the pursuit of enhanced road safety, reduced traffic congestion, and optimized urban mobility solutions. Regulatory frameworks, though evolving, present a significant factor influencing market entry and operational scale. Competitive product substitutes, ranging from traditional ride-hailing services to public transportation, are gradually being challenged by the inherent benefits of autonomous taxis. End-user demographics are expanding beyond early adopters to a broader consumer base as trust and accessibility increase. Mergers and acquisitions (M&A) are prevalent, signaling strategic consolidation and investment in scaling operations.
- Market Concentration: Emerging consolidation driven by significant R&D investments and high capital requirements.
- Technological Innovation Drivers: Advancements in AI, machine learning, sensor fusion, and high-definition mapping are critical.
- Regulatory Frameworks: Varying regulations across regions present both opportunities and challenges for widespread deployment.
- Competitive Product Substitutes: Traditional ride-sharing, public transit, and personal vehicle ownership.
- End-User Demographics: Growing acceptance among tech-savvy individuals, urban dwellers, and those seeking convenient transportation.
- M&A Trends: Strategic partnerships and acquisitions aimed at technology acquisition and market expansion.
Global Autonomous Taxi Industry Growth Trends & Insights
The global autonomous taxi industry is poised for substantial growth, fueled by rapid technological advancements and increasing consumer acceptance of self-driving technologies. The market size is expected to witness a significant expansion, driven by the ongoing development and deployment of Level 4 and Level 5 autonomous systems. Adoption rates are projected to accelerate as safety records improve and regulatory hurdles are systematically addressed. Technological disruptions, such as advancements in battery technology for electric vehicles and the integration of sophisticated AI algorithms, are creating new avenues for innovation and efficiency. Consumer behavior shifts are a critical factor, with a growing preference for on-demand mobility solutions that offer convenience, cost-effectiveness, and enhanced safety. The integration of autonomous taxis into urban transportation ecosystems is expected to revolutionize personal and commercial transit, leading to more efficient city planning and reduced environmental impact. The report analyzes these trends with a focus on market penetration and the impact of evolving consumer preferences on the adoption curve of autonomous mobility solutions.
Dominant Regions, Countries, or Segments in Global Autonomous Taxi Industry
The global autonomous taxi industry's growth is heavily influenced by specific regions, countries, and market segments that are spearheading innovation and adoption. Currently, North America, particularly the United States, and Asia-Pacific, with China at the forefront, are leading the charge. These regions benefit from significant investments in research and development, supportive government initiatives, and a robust technological infrastructure. Within these regions, Level 4 autonomy is currently the dominant segment, enabling driverless operation under specific conditions, paving the way for wider commercial deployment. Electric Vehicles (EVs) are the preferred propulsion method due to environmental regulations and the inherent suitability for urban operation and charging infrastructure. Cars remain the primary vehicle type for autonomous taxi services, offering flexibility and passenger comfort. Passenger Transportation is the most significant application, directly addressing the needs of urban commuters and travelers. Rental-based service models are gaining traction, providing on-demand access to autonomous vehicles.
- Leading Regions: North America (USA) and Asia-Pacific (China) are at the forefront due to strong R&D, favorable policies, and significant investments.
- Dominant Country Drivers:
- USA: Pioneering technology development, extensive testing grounds, and significant venture capital funding.
- China: Rapid government support, large domestic market, and strategic investment in autonomous vehicle production.
- Dominant Segments:
- Level of Autonomy: Level 4, enabling driverless operation in defined areas and conditions.
- Propulsion: Electric Vehicles, driven by environmental concerns and operational efficiencies.
- Vehicle: Cars, offering optimal flexibility and passenger capacity for ride-hailing services.
- Application: Passenger Transportation, catering to the widespread demand for convenient urban mobility.
- Service Type: Rental-Based, aligning with the on-demand economy and reducing individual ownership burdens.
- Growth Potential: These dominant segments are expected to continue driving market expansion due to technological maturity, consumer acceptance, and favorable economic and policy environments.
Global Autonomous Taxi Industry Product Landscape
The product landscape of the global autonomous taxi industry is characterized by rapid innovation in sensor technology, AI algorithms, and vehicle integration. Companies are focused on developing highly reliable and safe autonomous systems capable of navigating complex urban environments. Unique selling propositions include enhanced passenger safety through advanced perception systems, increased efficiency by optimizing routes and reducing human error, and a more comfortable and personalized passenger experience. Technological advancements in areas like lidar resolution, real-time object detection, and predictive path planning are crucial differentiators. The integration of these technologies into purpose-built autonomous vehicles and retrofitted existing fleets is shaping the market.
Key Drivers, Barriers & Challenges in Global Autonomous Taxi Industry
Key Drivers: The primary forces propelling the global autonomous taxi industry include the relentless pursuit of enhanced road safety to reduce accidents and fatalities, the potential for significant cost reductions in transportation through increased efficiency and optimized fleet management, and the growing demand for convenient and on-demand mobility solutions in increasingly congested urban areas. Technological advancements in AI, lidar, radar, and sensor fusion are continuously improving the capabilities of autonomous vehicles. Furthermore, supportive government policies and initiatives aimed at promoting sustainable and efficient transportation are also playing a crucial role.
Barriers & Challenges: Significant challenges include stringent and evolving regulatory frameworks that differ across jurisdictions, leading to complex compliance requirements. Public perception and trust remain a critical hurdle, with concerns about safety and ethical considerations needing to be addressed. The high cost of research, development, and deployment of autonomous taxi technology represents a substantial financial barrier. Supply chain disruptions, particularly for specialized components like advanced sensors and AI processors, can impact production timelines. Lastly, cybersecurity threats pose a risk to the operational integrity and data security of autonomous fleets.
Emerging Opportunities in Global Autonomous Taxi Industry
Emerging opportunities in the global autonomous taxi industry lie in the expansion of autonomous services into new geographical markets with favorable regulatory environments and high urban density. The integration of autonomous taxis with broader mobility-as-a-service (MaaS) platforms presents a significant opportunity to offer seamless, multimodal transportation solutions. Furthermore, the development of specialized autonomous taxi services, such as last-mile delivery for goods or specialized transport for elderly and disabled individuals, offers untapped market potential. The evolution of charging infrastructure and battery technology for electric autonomous fleets will also unlock new operational efficiencies and expand service areas.
Growth Accelerators in the Global Autonomous Taxi Industry Industry
Growth accelerators for the global autonomous taxi industry are primarily driven by continued technological breakthroughs in artificial intelligence and sensor technology, leading to more robust and reliable autonomous systems. Strategic partnerships between technology providers, automakers, and ride-hailing companies are crucial for accelerating development, testing, and deployment. Market expansion strategies, including phased rollouts in pilot cities and gradual scaling of operations, are critical for demonstrating viability and building consumer confidence. The development of comprehensive regulatory frameworks that provide clarity and certainty for operators will also significantly accelerate market growth.
Key Players Shaping the Global Autonomous Taxi Industry Market
- Baidu Inc
- Didi Chuxing Technology Co
- Uber Technologies Inc
- MOIA
- AutoX Inc
- GM Cruise
- Tesla Inc
- Waymo LLC
- APTIV PLC
- EasyMile
- NAVYA SA
- AB Volvo
- ZF Friedrichshafen AG
Notable Milestones in Global Autonomous Taxi Industry Sector
- August 2022: Waymo LLC introduced new features designed to make its fleet of autonomous taxis more accessible to passengers with visual impairments and other disabilities.
- December 2021: AutoX Inc. introduced a production facility in China to produce Level 4 fully driverless RoboTaxis.
- May 2021: Agro AI introduced a new Lidar Sensor which has the ability to see 400 meters away with the high-resolution photorealistic quality and the ability to detect dark and distant objects with low reflectivity.
In-Depth Global Autonomous Taxi Industry Market Outlook
The future market outlook for the global autonomous taxi industry is exceptionally promising, driven by sustained advancements in core technologies and a growing global emphasis on smart city initiatives. Key growth accelerators include the maturation of AI-powered decision-making systems, leading to enhanced safety and operational efficiency, and the widespread adoption of electric vehicle powertrains, aligning with sustainability goals. Strategic partnerships will continue to be instrumental in scaling operations and expanding geographical reach. The ongoing evolution of regulatory landscapes towards more accommodating frameworks will further bolster confidence and investment. Future market potential is vast, encompassing not only passenger transportation but also significant opportunities in autonomous logistics and specialized transport services, positioning the industry as a cornerstone of future urban mobility.
Global Autonomous Taxi Industry Segmentation
-
1. Level of Autonomy
- 1.1. Level 4
- 1.2. Level 5
-
2. Propulsion
- 2.1. Electric Vehicles
- 2.2. Hybrid Vehicles
- 2.3. Fuel Cell Electric Vehicles
-
3. Vehicle
- 3.1. Car
- 3.2. Van/Shuttle
-
4. Application
- 4.1. Passenger Transportation
- 4.2. Goods Transportation
-
5. Service Type
- 5.1. Rental-Based
- 5.2. Station-Based
Global Autonomous Taxi Industry Segmentation By Geography
-
1. North America
- 1.1. United States
- 1.2. Canada
- 1.3. Rest of North America
-
2. Europe
- 2.1. Germany
- 2.2. United Kingdom
- 2.3. France
- 2.4. Italy
- 2.5. Spain
- 2.6. Rest of Europe
-
3. Asia Pacific
- 3.1. China
- 3.2. Japan
- 3.3. India
- 3.4. Rest of Asia Pacific
-
4. Rest of the World
- 4.1. South America
- 4.2. Middle East and Africa
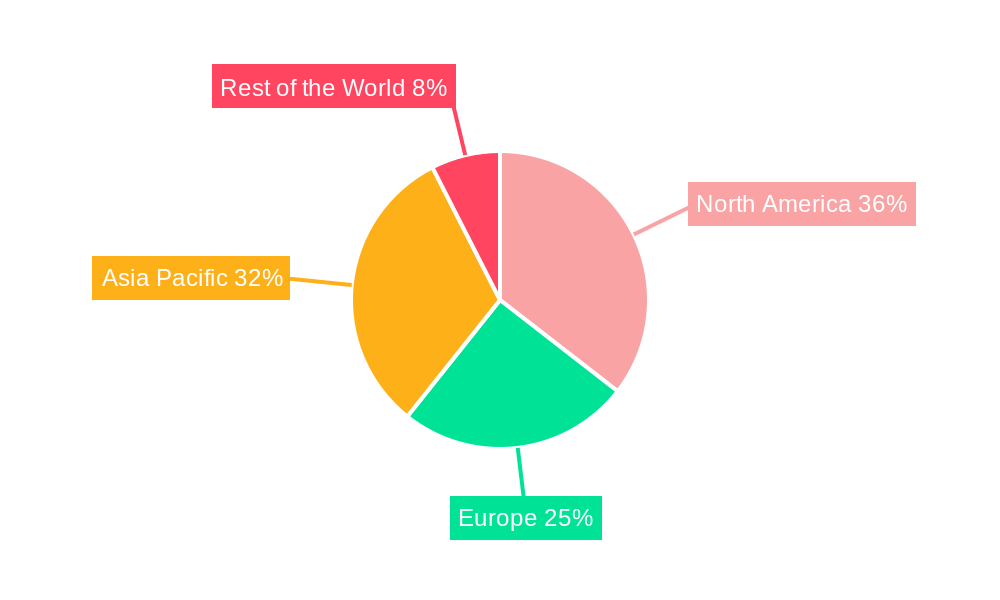
Global Autonomous Taxi Industry Regional Market Share
Geographic Coverage of Global Autonomous Taxi Industry
Global Autonomous Taxi Industry REPORT HIGHLIGHTS
| Aspects | Details |
|---|---|
| Study Period | 2020-2034 |
| Base Year | 2025 |
| Estimated Year | 2026 |
| Forecast Period | 2026-2034 |
| Historical Period | 2020-2025 |
| Growth Rate | CAGR of 99.1% from 2020-2034 |
| Segmentation |
|
Table of Contents
- 1. Introduction
- 1.1. Research Scope
- 1.2. Market Segmentation
- 1.3. Research Objective
- 1.4. Definitions and Assumptions
- 2. Executive Summary
- 2.1. Market Snapshot
- 3. Market Dynamics
- 3.1. Market Drivers
- 3.2. Market Restrains
- 3.3. Market Trends
- 3.4. Market Opportunities
- 4. Market Factor Analysis
- 4.1. Porters Five Forces
- 4.1.1. Bargaining Power of Suppliers
- 4.1.2. Bargaining Power of Buyers
- 4.1.3. Threat of New Entrants
- 4.1.4. Threat of Substitutes
- 4.1.5. Competitive Rivalry
- 4.2. PESTEL analysis
- 4.3. BCG Analysis
- 4.3.1. Stars (High Growth, High Market Share)
- 4.3.2. Cash Cows (Low Growth, High Market Share)
- 4.3.3. Question Mark (High Growth, Low Market Share)
- 4.3.4. Dogs (Low Growth, Low Market Share)
- 4.4. Ansoff Matrix Analysis
- 4.5. Supply Chain Analysis
- 4.6. Regulatory Landscape
- 4.7. Current Market Potential and Opportunity Assessment (TAM–SAM–SOM Framework)
- 4.8. NRP Analyst Note
- 4.1. Porters Five Forces
- 5. Market Analysis, Insights and Forecast 2021-2033
- 5.1. Market Analysis, Insights and Forecast - by Level of Autonomy
- 5.1.1. Level 4
- 5.1.2. Level 5
- 5.2. Market Analysis, Insights and Forecast - by Propulsion
- 5.2.1. Electric Vehicles
- 5.2.2. Hybrid Vehicles
- 5.2.3. Fuel Cell Electric Vehicles
- 5.3. Market Analysis, Insights and Forecast - by Vehicle
- 5.3.1. Car
- 5.3.2. Van/Shuttle
- 5.4. Market Analysis, Insights and Forecast - by Application
- 5.4.1. Passenger Transportation
- 5.4.2. Goods Transportation
- 5.5. Market Analysis, Insights and Forecast - by Service Type
- 5.5.1. Rental-Based
- 5.5.2. Station-Based
- 5.6. Market Analysis, Insights and Forecast - by Region
- 5.6.1. North America
- 5.6.2. Europe
- 5.6.3. Asia Pacific
- 5.6.4. Rest of the World
- 5.1. Market Analysis, Insights and Forecast - by Level of Autonomy
- 6. Global Autonomous Taxi Industry Analysis, Insights and Forecast, 2021-2033
- 6.1. Market Analysis, Insights and Forecast - by Level of Autonomy
- 6.1.1. Level 4
- 6.1.2. Level 5
- 6.2. Market Analysis, Insights and Forecast - by Propulsion
- 6.2.1. Electric Vehicles
- 6.2.2. Hybrid Vehicles
- 6.2.3. Fuel Cell Electric Vehicles
- 6.3. Market Analysis, Insights and Forecast - by Vehicle
- 6.3.1. Car
- 6.3.2. Van/Shuttle
- 6.4. Market Analysis, Insights and Forecast - by Application
- 6.4.1. Passenger Transportation
- 6.4.2. Goods Transportation
- 6.5. Market Analysis, Insights and Forecast - by Service Type
- 6.5.1. Rental-Based
- 6.5.2. Station-Based
- 6.1. Market Analysis, Insights and Forecast - by Level of Autonomy
- 7. North America Global Autonomous Taxi Industry Analysis, Insights and Forecast, 2020-2032
- 7.1. Market Analysis, Insights and Forecast - by Level of Autonomy
- 7.1.1. Level 4
- 7.1.2. Level 5
- 7.2. Market Analysis, Insights and Forecast - by Propulsion
- 7.2.1. Electric Vehicles
- 7.2.2. Hybrid Vehicles
- 7.2.3. Fuel Cell Electric Vehicles
- 7.3. Market Analysis, Insights and Forecast - by Vehicle
- 7.3.1. Car
- 7.3.2. Van/Shuttle
- 7.4. Market Analysis, Insights and Forecast - by Application
- 7.4.1. Passenger Transportation
- 7.4.2. Goods Transportation
- 7.5. Market Analysis, Insights and Forecast - by Service Type
- 7.5.1. Rental-Based
- 7.5.2. Station-Based
- 7.1. Market Analysis, Insights and Forecast - by Level of Autonomy
- 8. Europe Global Autonomous Taxi Industry Analysis, Insights and Forecast, 2020-2032
- 8.1. Market Analysis, Insights and Forecast - by Level of Autonomy
- 8.1.1. Level 4
- 8.1.2. Level 5
- 8.2. Market Analysis, Insights and Forecast - by Propulsion
- 8.2.1. Electric Vehicles
- 8.2.2. Hybrid Vehicles
- 8.2.3. Fuel Cell Electric Vehicles
- 8.3. Market Analysis, Insights and Forecast - by Vehicle
- 8.3.1. Car
- 8.3.2. Van/Shuttle
- 8.4. Market Analysis, Insights and Forecast - by Application
- 8.4.1. Passenger Transportation
- 8.4.2. Goods Transportation
- 8.5. Market Analysis, Insights and Forecast - by Service Type
- 8.5.1. Rental-Based
- 8.5.2. Station-Based
- 8.1. Market Analysis, Insights and Forecast - by Level of Autonomy
- 9. Asia Pacific Global Autonomous Taxi Industry Analysis, Insights and Forecast, 2020-2032
- 9.1. Market Analysis, Insights and Forecast - by Level of Autonomy
- 9.1.1. Level 4
- 9.1.2. Level 5
- 9.2. Market Analysis, Insights and Forecast - by Propulsion
- 9.2.1. Electric Vehicles
- 9.2.2. Hybrid Vehicles
- 9.2.3. Fuel Cell Electric Vehicles
- 9.3. Market Analysis, Insights and Forecast - by Vehicle
- 9.3.1. Car
- 9.3.2. Van/Shuttle
- 9.4. Market Analysis, Insights and Forecast - by Application
- 9.4.1. Passenger Transportation
- 9.4.2. Goods Transportation
- 9.5. Market Analysis, Insights and Forecast - by Service Type
- 9.5.1. Rental-Based
- 9.5.2. Station-Based
- 9.1. Market Analysis, Insights and Forecast - by Level of Autonomy
- 10. Rest of the World Global Autonomous Taxi Industry Analysis, Insights and Forecast, 2020-2032
- 10.1. Market Analysis, Insights and Forecast - by Level of Autonomy
- 10.1.1. Level 4
- 10.1.2. Level 5
- 10.2. Market Analysis, Insights and Forecast - by Propulsion
- 10.2.1. Electric Vehicles
- 10.2.2. Hybrid Vehicles
- 10.2.3. Fuel Cell Electric Vehicles
- 10.3. Market Analysis, Insights and Forecast - by Vehicle
- 10.3.1. Car
- 10.3.2. Van/Shuttle
- 10.4. Market Analysis, Insights and Forecast - by Application
- 10.4.1. Passenger Transportation
- 10.4.2. Goods Transportation
- 10.5. Market Analysis, Insights and Forecast - by Service Type
- 10.5.1. Rental-Based
- 10.5.2. Station-Based
- 10.1. Market Analysis, Insights and Forecast - by Level of Autonomy
- 11. Competitive Analysis
- 11.1. Company Profiles
- 11.1.1 Baidu Inc
- 11.1.1.1. Company Overview
- 11.1.1.2. Products
- 11.1.1.3. Company Financials
- 11.1.1.4. SWOT Analysis
- 11.1.2 Didi Chuxing Technology Co
- 11.1.2.1. Company Overview
- 11.1.2.2. Products
- 11.1.2.3. Company Financials
- 11.1.2.4. SWOT Analysis
- 11.1.3 Uber Technologies Inc
- 11.1.3.1. Company Overview
- 11.1.3.2. Products
- 11.1.3.3. Company Financials
- 11.1.3.4. SWOT Analysis
- 11.1.4 MOIA
- 11.1.4.1. Company Overview
- 11.1.4.2. Products
- 11.1.4.3. Company Financials
- 11.1.4.4. SWOT Analysis
- 11.1.5 AutoX Inc
- 11.1.5.1. Company Overview
- 11.1.5.2. Products
- 11.1.5.3. Company Financials
- 11.1.5.4. SWOT Analysis
- 11.1.6 GM Cruise
- 11.1.6.1. Company Overview
- 11.1.6.2. Products
- 11.1.6.3. Company Financials
- 11.1.6.4. SWOT Analysis
- 11.1.7 Tesla Inc *List Not Exhaustive
- 11.1.7.1. Company Overview
- 11.1.7.2. Products
- 11.1.7.3. Company Financials
- 11.1.7.4. SWOT Analysis
- 11.1.8 Waymo LLC
- 11.1.8.1. Company Overview
- 11.1.8.2. Products
- 11.1.8.3. Company Financials
- 11.1.8.4. SWOT Analysis
- 11.1.9 APTIV PLC
- 11.1.9.1. Company Overview
- 11.1.9.2. Products
- 11.1.9.3. Company Financials
- 11.1.9.4. SWOT Analysis
- 11.1.10 EasyMile
- 11.1.10.1. Company Overview
- 11.1.10.2. Products
- 11.1.10.3. Company Financials
- 11.1.10.4. SWOT Analysis
- 11.1.11 NAVYA SA
- 11.1.11.1. Company Overview
- 11.1.11.2. Products
- 11.1.11.3. Company Financials
- 11.1.11.4. SWOT Analysis
- 11.1.12 AB Volvo
- 11.1.12.1. Company Overview
- 11.1.12.2. Products
- 11.1.12.3. Company Financials
- 11.1.12.4. SWOT Analysis
- 11.1.13 ZF Friedrichshafen AG
- 11.1.13.1. Company Overview
- 11.1.13.2. Products
- 11.1.13.3. Company Financials
- 11.1.13.4. SWOT Analysis
- 11.1.1 Baidu Inc
- 11.2. Market Entropy
- 11.2.1 Company's Key Areas Served
- 11.2.2 Recent Developments
- 11.3. Company Market Share Analysis 2025
- 11.3.1 Top 5 Companies Market Share Analysis
- 11.3.2 Top 3 Companies Market Share Analysis
- 11.4. List of Potential Customers
- 12. Research Methodology
List of Figures
- Figure 1: Global Global Autonomous Taxi Industry Revenue Breakdown (billion, %) by Region 2025 & 2033
- Figure 2: North America Global Autonomous Taxi Industry Revenue (billion), by Level of Autonomy 2025 & 2033
- Figure 3: North America Global Autonomous Taxi Industry Revenue Share (%), by Level of Autonomy 2025 & 2033
- Figure 4: North America Global Autonomous Taxi Industry Revenue (billion), by Propulsion 2025 & 2033
- Figure 5: North America Global Autonomous Taxi Industry Revenue Share (%), by Propulsion 2025 & 2033
- Figure 6: North America Global Autonomous Taxi Industry Revenue (billion), by Vehicle 2025 & 2033
- Figure 7: North America Global Autonomous Taxi Industry Revenue Share (%), by Vehicle 2025 & 2033
- Figure 8: North America Global Autonomous Taxi Industry Revenue (billion), by Application 2025 & 2033
- Figure 9: North America Global Autonomous Taxi Industry Revenue Share (%), by Application 2025 & 2033
- Figure 10: North America Global Autonomous Taxi Industry Revenue (billion), by Service Type 2025 & 2033
- Figure 11: North America Global Autonomous Taxi Industry Revenue Share (%), by Service Type 2025 & 2033
- Figure 12: North America Global Autonomous Taxi Industry Revenue (billion), by Country 2025 & 2033
- Figure 13: North America Global Autonomous Taxi Industry Revenue Share (%), by Country 2025 & 2033
- Figure 14: Europe Global Autonomous Taxi Industry Revenue (billion), by Level of Autonomy 2025 & 2033
- Figure 15: Europe Global Autonomous Taxi Industry Revenue Share (%), by Level of Autonomy 2025 & 2033
- Figure 16: Europe Global Autonomous Taxi Industry Revenue (billion), by Propulsion 2025 & 2033
- Figure 17: Europe Global Autonomous Taxi Industry Revenue Share (%), by Propulsion 2025 & 2033
- Figure 18: Europe Global Autonomous Taxi Industry Revenue (billion), by Vehicle 2025 & 2033
- Figure 19: Europe Global Autonomous Taxi Industry Revenue Share (%), by Vehicle 2025 & 2033
- Figure 20: Europe Global Autonomous Taxi Industry Revenue (billion), by Application 2025 & 2033
- Figure 21: Europe Global Autonomous Taxi Industry Revenue Share (%), by Application 2025 & 2033
- Figure 22: Europe Global Autonomous Taxi Industry Revenue (billion), by Service Type 2025 & 2033
- Figure 23: Europe Global Autonomous Taxi Industry Revenue Share (%), by Service Type 2025 & 2033
- Figure 24: Europe Global Autonomous Taxi Industry Revenue (billion), by Country 2025 & 2033
- Figure 25: Europe Global Autonomous Taxi Industry Revenue Share (%), by Country 2025 & 2033
- Figure 26: Asia Pacific Global Autonomous Taxi Industry Revenue (billion), by Level of Autonomy 2025 & 2033
- Figure 27: Asia Pacific Global Autonomous Taxi Industry Revenue Share (%), by Level of Autonomy 2025 & 2033
- Figure 28: Asia Pacific Global Autonomous Taxi Industry Revenue (billion), by Propulsion 2025 & 2033
- Figure 29: Asia Pacific Global Autonomous Taxi Industry Revenue Share (%), by Propulsion 2025 & 2033
- Figure 30: Asia Pacific Global Autonomous Taxi Industry Revenue (billion), by Vehicle 2025 & 2033
- Figure 31: Asia Pacific Global Autonomous Taxi Industry Revenue Share (%), by Vehicle 2025 & 2033
- Figure 32: Asia Pacific Global Autonomous Taxi Industry Revenue (billion), by Application 2025 & 2033
- Figure 33: Asia Pacific Global Autonomous Taxi Industry Revenue Share (%), by Application 2025 & 2033
- Figure 34: Asia Pacific Global Autonomous Taxi Industry Revenue (billion), by Service Type 2025 & 2033
- Figure 35: Asia Pacific Global Autonomous Taxi Industry Revenue Share (%), by Service Type 2025 & 2033
- Figure 36: Asia Pacific Global Autonomous Taxi Industry Revenue (billion), by Country 2025 & 2033
- Figure 37: Asia Pacific Global Autonomous Taxi Industry Revenue Share (%), by Country 2025 & 2033
- Figure 38: Rest of the World Global Autonomous Taxi Industry Revenue (billion), by Level of Autonomy 2025 & 2033
- Figure 39: Rest of the World Global Autonomous Taxi Industry Revenue Share (%), by Level of Autonomy 2025 & 2033
- Figure 40: Rest of the World Global Autonomous Taxi Industry Revenue (billion), by Propulsion 2025 & 2033
- Figure 41: Rest of the World Global Autonomous Taxi Industry Revenue Share (%), by Propulsion 2025 & 2033
- Figure 42: Rest of the World Global Autonomous Taxi Industry Revenue (billion), by Vehicle 2025 & 2033
- Figure 43: Rest of the World Global Autonomous Taxi Industry Revenue Share (%), by Vehicle 2025 & 2033
- Figure 44: Rest of the World Global Autonomous Taxi Industry Revenue (billion), by Application 2025 & 2033
- Figure 45: Rest of the World Global Autonomous Taxi Industry Revenue Share (%), by Application 2025 & 2033
- Figure 46: Rest of the World Global Autonomous Taxi Industry Revenue (billion), by Service Type 2025 & 2033
- Figure 47: Rest of the World Global Autonomous Taxi Industry Revenue Share (%), by Service Type 2025 & 2033
- Figure 48: Rest of the World Global Autonomous Taxi Industry Revenue (billion), by Country 2025 & 2033
- Figure 49: Rest of the World Global Autonomous Taxi Industry Revenue Share (%), by Country 2025 & 2033
List of Tables
- Table 1: Global Autonomous Taxi Industry Revenue billion Forecast, by Level of Autonomy 2020 & 2033
- Table 2: Global Autonomous Taxi Industry Revenue billion Forecast, by Propulsion 2020 & 2033
- Table 3: Global Autonomous Taxi Industry Revenue billion Forecast, by Vehicle 2020 & 2033
- Table 4: Global Autonomous Taxi Industry Revenue billion Forecast, by Application 2020 & 2033
- Table 5: Global Autonomous Taxi Industry Revenue billion Forecast, by Service Type 2020 & 2033
- Table 6: Global Autonomous Taxi Industry Revenue billion Forecast, by Region 2020 & 2033
- Table 7: Global Autonomous Taxi Industry Revenue billion Forecast, by Level of Autonomy 2020 & 2033
- Table 8: Global Autonomous Taxi Industry Revenue billion Forecast, by Propulsion 2020 & 2033
- Table 9: Global Autonomous Taxi Industry Revenue billion Forecast, by Vehicle 2020 & 2033
- Table 10: Global Autonomous Taxi Industry Revenue billion Forecast, by Application 2020 & 2033
- Table 11: Global Autonomous Taxi Industry Revenue billion Forecast, by Service Type 2020 & 2033
- Table 12: Global Autonomous Taxi Industry Revenue billion Forecast, by Country 2020 & 2033
- Table 13: United States Global Autonomous Taxi Industry Revenue (billion) Forecast, by Application 2020 & 2033
- Table 14: Canada Global Autonomous Taxi Industry Revenue (billion) Forecast, by Application 2020 & 2033
- Table 15: Rest of North America Global Autonomous Taxi Industry Revenue (billion) Forecast, by Application 2020 & 2033
- Table 16: Global Autonomous Taxi Industry Revenue billion Forecast, by Level of Autonomy 2020 & 2033
- Table 17: Global Autonomous Taxi Industry Revenue billion Forecast, by Propulsion 2020 & 2033
- Table 18: Global Autonomous Taxi Industry Revenue billion Forecast, by Vehicle 2020 & 2033
- Table 19: Global Autonomous Taxi Industry Revenue billion Forecast, by Application 2020 & 2033
- Table 20: Global Autonomous Taxi Industry Revenue billion Forecast, by Service Type 2020 & 2033
- Table 21: Global Autonomous Taxi Industry Revenue billion Forecast, by Country 2020 & 2033
- Table 22: Germany Global Autonomous Taxi Industry Revenue (billion) Forecast, by Application 2020 & 2033
- Table 23: United Kingdom Global Autonomous Taxi Industry Revenue (billion) Forecast, by Application 2020 & 2033
- Table 24: France Global Autonomous Taxi Industry Revenue (billion) Forecast, by Application 2020 & 2033
- Table 25: Italy Global Autonomous Taxi Industry Revenue (billion) Forecast, by Application 2020 & 2033
- Table 26: Spain Global Autonomous Taxi Industry Revenue (billion) Forecast, by Application 2020 & 2033
- Table 27: Rest of Europe Global Autonomous Taxi Industry Revenue (billion) Forecast, by Application 2020 & 2033
- Table 28: Global Autonomous Taxi Industry Revenue billion Forecast, by Level of Autonomy 2020 & 2033
- Table 29: Global Autonomous Taxi Industry Revenue billion Forecast, by Propulsion 2020 & 2033
- Table 30: Global Autonomous Taxi Industry Revenue billion Forecast, by Vehicle 2020 & 2033
- Table 31: Global Autonomous Taxi Industry Revenue billion Forecast, by Application 2020 & 2033
- Table 32: Global Autonomous Taxi Industry Revenue billion Forecast, by Service Type 2020 & 2033
- Table 33: Global Autonomous Taxi Industry Revenue billion Forecast, by Country 2020 & 2033
- Table 34: China Global Autonomous Taxi Industry Revenue (billion) Forecast, by Application 2020 & 2033
- Table 35: Japan Global Autonomous Taxi Industry Revenue (billion) Forecast, by Application 2020 & 2033
- Table 36: India Global Autonomous Taxi Industry Revenue (billion) Forecast, by Application 2020 & 2033
- Table 37: Rest of Asia Pacific Global Autonomous Taxi Industry Revenue (billion) Forecast, by Application 2020 & 2033
- Table 38: Global Autonomous Taxi Industry Revenue billion Forecast, by Level of Autonomy 2020 & 2033
- Table 39: Global Autonomous Taxi Industry Revenue billion Forecast, by Propulsion 2020 & 2033
- Table 40: Global Autonomous Taxi Industry Revenue billion Forecast, by Vehicle 2020 & 2033
- Table 41: Global Autonomous Taxi Industry Revenue billion Forecast, by Application 2020 & 2033
- Table 42: Global Autonomous Taxi Industry Revenue billion Forecast, by Service Type 2020 & 2033
- Table 43: Global Autonomous Taxi Industry Revenue billion Forecast, by Country 2020 & 2033
- Table 44: South America Global Autonomous Taxi Industry Revenue (billion) Forecast, by Application 2020 & 2033
- Table 45: Middle East and Africa Global Autonomous Taxi Industry Revenue (billion) Forecast, by Application 2020 & 2033
Frequently Asked Questions
1. What is the projected Compound Annual Growth Rate (CAGR) of the Global Autonomous Taxi Industry?
The projected CAGR is approximately 99.1%.
2. Which companies are prominent players in the Global Autonomous Taxi Industry?
Key companies in the market include Baidu Inc, Didi Chuxing Technology Co, Uber Technologies Inc, MOIA, AutoX Inc, GM Cruise, Tesla Inc *List Not Exhaustive, Waymo LLC, APTIV PLC, EasyMile, NAVYA SA, AB Volvo, ZF Friedrichshafen AG.
3. What are the main segments of the Global Autonomous Taxi Industry?
The market segments include Level of Autonomy, Propulsion, Vehicle, Application, Service Type.
4. Can you provide details about the market size?
The market size is estimated to be USD 0.61 billion as of 2022.
5. What are some drivers contributing to market growth?
Increase in Leisure Activities in the Country.
6. What are the notable trends driving market growth?
Robo-Taxis Are Attracting People Around the World.
7. Are there any restraints impacting market growth?
Strict Vehicle Emission Regulations.
8. Can you provide examples of recent developments in the market?
In August 2022, Waymo LLC introduced new features designed to make its fleet of autonomous taxis more accessible to passengers with visual impairments and other disabilities.
9. What pricing options are available for accessing the report?
Pricing options include single-user, multi-user, and enterprise licenses priced at USD 4750, USD 5250, and USD 8750 respectively.
10. Is the market size provided in terms of value or volume?
The market size is provided in terms of value, measured in billion.
11. Are there any specific market keywords associated with the report?
Yes, the market keyword associated with the report is "Global Autonomous Taxi Industry," which aids in identifying and referencing the specific market segment covered.
12. How do I determine which pricing option suits my needs best?
The pricing options vary based on user requirements and access needs. Individual users may opt for single-user licenses, while businesses requiring broader access may choose multi-user or enterprise licenses for cost-effective access to the report.
13. Are there any additional resources or data provided in the Global Autonomous Taxi Industry report?
While the report offers comprehensive insights, it's advisable to review the specific contents or supplementary materials provided to ascertain if additional resources or data are available.
14. How can I stay updated on further developments or reports in the Global Autonomous Taxi Industry?
To stay informed about further developments, trends, and reports in the Global Autonomous Taxi Industry, consider subscribing to industry newsletters, following relevant companies and organizations, or regularly checking reputable industry news sources and publications.
Methodology
Step 1 - Identification of Relevant Samples Size from Population Database


Step 2 - Approaches for Defining Global Market Size (Value, Volume* & Price*)

Note*: In applicable scenarios
Step 3 - Data Sources
Primary Research
- Web Analytics
- Survey Reports
- Research Institute
- Latest Research Reports
- Opinion Leaders
Secondary Research
- Annual Reports
- White Paper
- Latest Press Release
- Industry Association
- Paid Database
- Investor Presentations

Step 4 - Data Triangulation
Involves using different sources of information in order to increase the validity of a study
These sources are likely to be stakeholders in a program - participants, other researchers, program staff, other community members, and so on.
Then we put all data in single framework & apply various statistical tools to find out the dynamic on the market.
During the analysis stage, feedback from the stakeholder groups would be compared to determine areas of agreement as well as areas of divergence