

Key Insights
The Mobility as a Service (MaaS) market is poised for significant expansion, projected to reach a substantial valuation driven by a Compound Annual Growth Rate (CAGR) of 7.43%. This growth trajectory is underpinned by a confluence of transformative factors. The increasing adoption of multimodal transportation solutions, seamlessly integrating various transport options into a single platform, is a primary catalyst. Users are increasingly prioritizing convenience, cost-effectiveness, and sustainability, all of which MaaS offerings are designed to address. Furthermore, advancements in digital technologies, including sophisticated AI-powered planning tools, real-time data analytics, and integrated payment systems, are enhancing the user experience and operational efficiency of MaaS platforms. The expanding urban populations globally are also fueling demand for more efficient and less congested urban mobility solutions, positioning MaaS as a vital component of smart city initiatives. The market's robustness is further supported by substantial investments in infrastructure development, including shared mobility fleets and digital platforms, by both public and private entities.
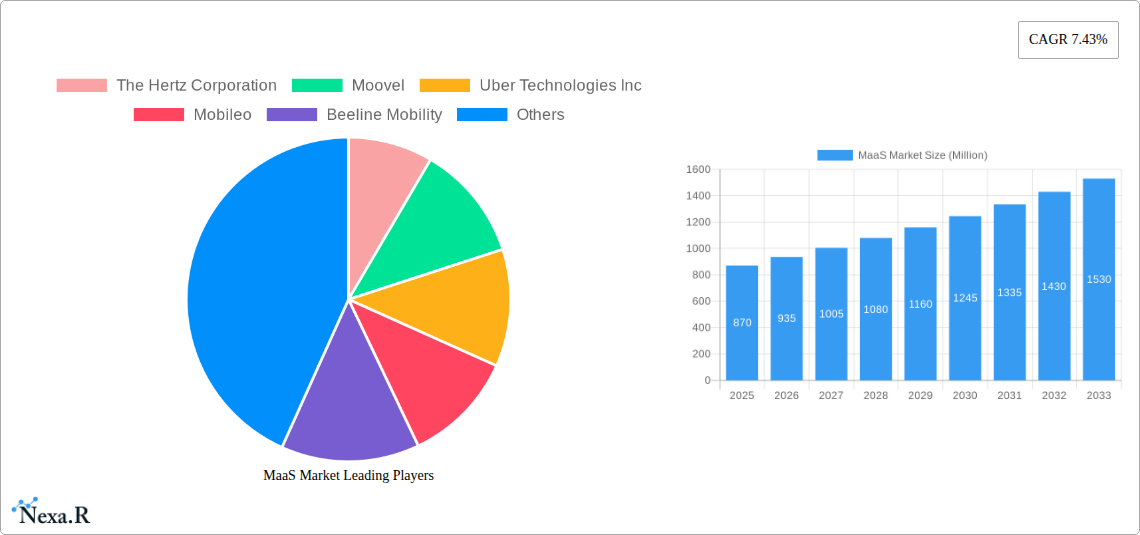
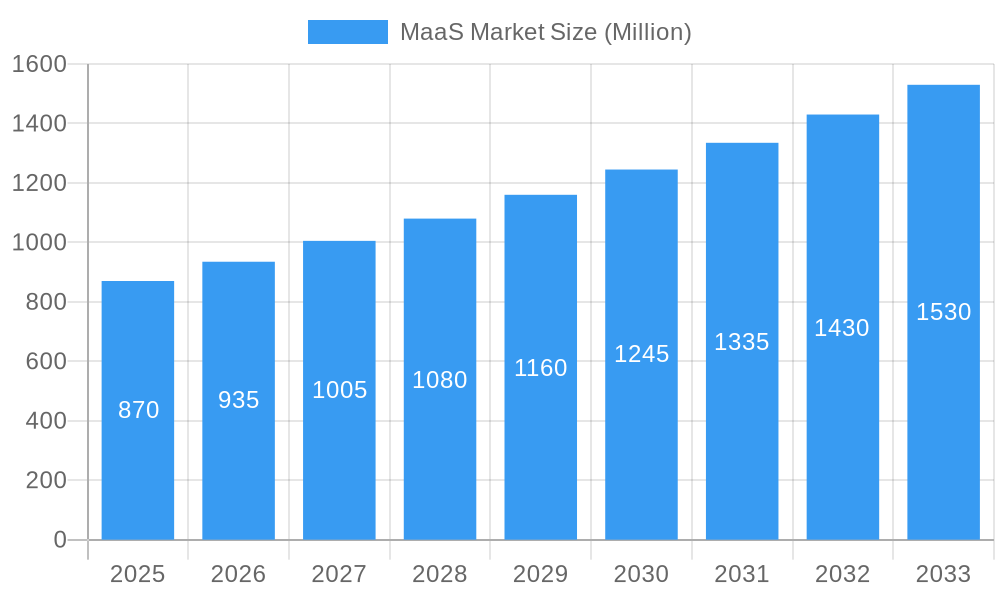
MaaS Market Market Size (In Million)
The MaaS market's expansion is also shaped by evolving consumer preferences and a growing awareness of environmental impact. As individuals seek alternatives to private vehicle ownership, particularly in densely populated urban areas, MaaS offers a compelling value proposition. The market is segmented across various service types, including car-sharing, ride-hailing, and public transit integration, as well as transportation types such as public and private mobility. Key players are actively innovating, introducing subscription-based models, on-demand services, and integrated ticketing solutions to capture market share. While the market presents immense opportunities, potential restraints include regulatory hurdles in certain regions, the need for robust data privacy and security measures, and the challenge of ensuring equitable access to services across diverse demographics. Overcoming these challenges will be crucial for realizing the full potential of MaaS in creating more sustainable, efficient, and user-centric urban mobility ecosystems.
MaaS Market Company Market Share
This in-depth report provides a definitive analysis of the global Mobility as a Service (MaaS) market, covering historical trends, current dynamics, and future projections through 2033. With a base year of 2025, the report offers granular insights into market evolution, segmented by service type (Car, Bus, Bike) and transportation type (Public, Private). It is essential for industry stakeholders, including transport operators, technology providers, urban planners, and investors, seeking to understand the intricate landscape of integrated mobility solutions.
MaaS Market Market Dynamics & Structure
The MaaS market is characterized by a dynamic interplay of technological innovation, evolving regulatory frameworks, and shifting consumer preferences. Market concentration is gradually increasing as established players like Uber Technologies Inc. and Didi Chuxing leverage their vast user bases and technological prowess to integrate a wider array of mobility services. However, the emergence of specialized MaaS platforms and regional initiatives, such as Whim (Maas Global) in Europe, fosters a degree of fragmentation, creating opportunities for niche players. Technological innovation remains a primary driver, with advancements in AI, data analytics, and payment integration enabling seamless multimodal trip planning and execution. Regulatory landscapes are varied, with some regions actively promoting MaaS adoption through supportive policies and infrastructure development, while others grapple with integration challenges and data privacy concerns. Competitive product substitutes, including traditional private vehicle ownership and standalone ride-hailing services, continue to exert influence, necessitating compelling value propositions from MaaS providers. End-user demographics are increasingly urbanized and digitally savvy, demanding convenient, cost-effective, and sustainable transportation options. Mergers and acquisitions (M&A) are expected to play a crucial role in market consolidation, with major players acquiring smaller service providers or technology firms to expand their service offerings and geographical reach. For instance, the acquisition of ride-sharing companies or micromobility providers by established MaaS platforms is a recurring theme. Barriers to innovation include the complexity of integrating diverse transportation modes, the need for interoperable data standards, and the significant capital investment required for platform development and service deployment.
- Market Concentration: Moderate to high, with consolidation expected through M&A.
- Technological Drivers: AI for route optimization, data analytics for personalization, blockchain for secure payments.
- Regulatory Frameworks: Varying levels of support and standardization across regions.
- Competitive Substitutes: Private vehicle ownership, traditional public transport, single-mode mobility apps.
- End-User Demographics: Urban dwellers, millennials and Gen Z, environmentally conscious consumers.
- M&A Trends: Strategic acquisitions of niche players, technology providers, and service operators.
- Innovation Barriers: Interoperability, data standardization, high initial investment, consumer adoption hurdles.
MaaS Market Growth Trends & Insights
The global MaaS market is poised for substantial growth, driven by increasing urbanization, a growing demand for sustainable transportation, and the proliferation of smart technologies. The market is projected to expand significantly in terms of both value and user adoption over the forecast period (2025–2033). The adoption rate of MaaS solutions is escalating as consumers become more accustomed to integrated digital services and seek alternatives to private car ownership. Technological disruptions, including the advancement of autonomous vehicles and the expansion of 5G networks, will further accelerate this trend by enabling more efficient and seamless mobility experiences. Consumer behavior is shifting towards a preference for pay-as-you-go models, on-demand services, and integrated multimodal journeys that offer greater flexibility and cost savings. This paradigm shift away from traditional ownership models is creating fertile ground for MaaS platforms to thrive.
The market size evolution is directly linked to the increasing penetration of smartphones and the development of smart city initiatives worldwide. As cities invest in digital infrastructure and aim to reduce traffic congestion and environmental impact, MaaS emerges as a critical component of their mobility strategies. The integration of public transit, ride-sharing, bike-sharing, and other on-demand services into a single, user-friendly application is proving to be a compelling proposition for urban commuters. Furthermore, the increasing focus on environmental sustainability is driving demand for greener transportation options, which MaaS platforms are well-positioned to offer by promoting the use of public transport, cycling, and electric vehicles. The CAGR is expected to be robust, reflecting the early stage of market penetration and the immense growth potential. Market penetration will deepen as more cities implement MaaS frameworks and more transportation providers integrate their services.
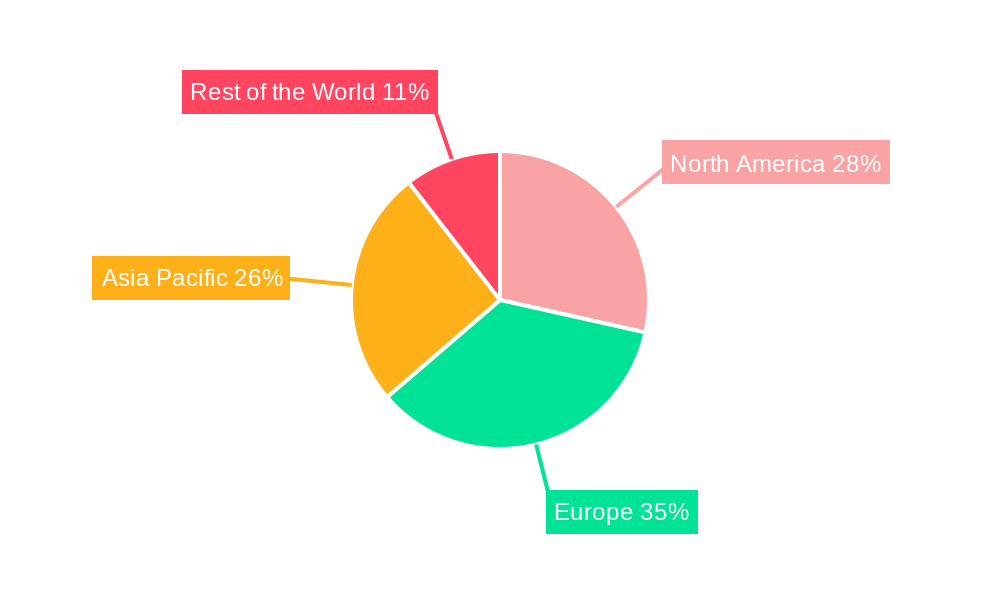
Dominant Regions, Countries, or Segments in MaaS Market
Europe is currently leading the MaaS market, driven by a strong emphasis on sustainable urban mobility, supportive government policies, and the early adoption of integrated transport solutions. Countries like Finland, with its pioneering Whim app, have established a benchmark for MaaS implementation, fostering a culture of multimodal travel. The strong public transportation infrastructure in many European cities, coupled with a growing awareness of environmental issues, provides a fertile ground for MaaS to flourish. Market share within Europe is distributed among various providers, but the overall commitment to MaaS is high.
Within the Service Type segment, Car services, encompassing ride-hailing and car-sharing, currently hold a significant market share due to their convenience and widespread availability. However, the Bus segment is experiencing a surge in importance as cities look to optimize public transit networks and integrate them seamlessly into MaaS offerings, thereby enhancing accessibility and efficiency. The Bike segment is also gaining traction, fueled by the growing popularity of micromobility solutions and their role in providing first-and-last-mile connectivity.
In terms of Transportation Type, the Public transportation segment is a cornerstone of the MaaS ecosystem. Governments and transit authorities are increasingly collaborating with MaaS providers to digitize ticketing, improve journey planning, and encourage greater ridership. The Private transportation segment, including ride-hailing and private car rentals, complements public transit by offering flexibility and catering to specific travel needs. The synergy between public and private modes is crucial for the success of a comprehensive MaaS strategy. The growth potential in Asia Pacific and North America is substantial, with increasing investments in smart city infrastructure and a rapidly growing urban population driving MaaS adoption. Economic policies that incentivize sustainable transportation and technological advancements in connectivity will further propel these regions.
MaaS Market Product Landscape
The MaaS product landscape is characterized by increasingly sophisticated and integrated digital platforms. Innovations revolve around user-centric design, predictive analytics for personalized recommendations, and seamless payment integration across diverse mobility services. Key applications include multimodal journey planners that offer real-time updates and dynamic rerouting, subscription-based mobility packages that provide cost-effective access to a range of transport options, and integrated ticketing systems that eliminate the need for multiple apps or passes. Performance metrics are focused on user engagement, trip completion rates, customer satisfaction, and the reduction of individual carbon footprints. Unique selling propositions include unparalleled convenience, cost savings through bundled services, and a more sustainable approach to urban travel. Technological advancements are centered on AI-powered optimization engines, secure blockchain-based payment solutions, and robust data analytics for service improvement.
Key Drivers, Barriers & Challenges in MaaS Market
Key Drivers:
- Urbanization and Congestion: Growing urban populations lead to increased traffic congestion, driving demand for efficient, alternative mobility solutions.
- Sustainability Concerns: A heightened global focus on reducing carbon emissions and promoting eco-friendly transportation fuels the adoption of MaaS, which integrates greener modes.
- Technological Advancements: Ubiquitous smartphone penetration, advanced GPS, AI, and 5G connectivity enable seamless integration and operation of MaaS platforms.
- Demand for Convenience and Cost-Effectiveness: Consumers increasingly seek integrated, user-friendly, and affordable mobility options that simplify travel planning and payment.
- Government Support and Smart City Initiatives: Proactive policies and investments in smart city infrastructure by governments worldwide are fostering MaaS development.
Barriers & Challenges:
- Interoperability and Data Standardization: Integrating diverse data streams from various mobility providers and ensuring seamless interoperability between different platforms remains a significant challenge.
- Regulatory Hurdles and Policy Fragmentation: Inconsistent regulations across different jurisdictions and the complexity of navigating various transit authorities can impede widespread adoption.
- Consumer Adoption and Behavior Change: Shifting ingrained habits of private car ownership and encouraging users to trust and adopt integrated mobility platforms requires significant effort.
- Business Model Sustainability: Developing profitable and scalable business models that balance service provision costs with user affordability is crucial for long-term success.
- Cybersecurity and Data Privacy: Ensuring the security of user data and maintaining privacy are paramount concerns that require robust technological and policy frameworks.
- Infrastructure Limitations: The availability and quality of existing public transit and micromobility infrastructure can limit the scope and effectiveness of MaaS solutions in certain areas.
Emerging Opportunities in MaaS Market
Emerging opportunities in the MaaS market lie in the expansion of integrated offerings to include new mobility services, such as on-demand delivery and autonomous vehicle integration. Untapped markets in developing regions, where rapid urbanization is creating a demand for efficient transportation solutions, present significant growth potential. Innovative applications focused on specific user needs, such as corporate mobility solutions for businesses or specialized mobility services for the elderly and disabled, are also gaining traction. Evolving consumer preferences for flexible, subscription-based models and a growing desire for hyper-personalized travel experiences are creating further avenues for innovation and market penetration. The integration of MaaS with other urban services, such as smart city platforms and local commerce, offers a pathway to enhanced value creation and user engagement.
Growth Accelerators in the MaaS Market Industry
The MaaS market industry is propelled by several key growth accelerators. Technological breakthroughs in AI for predictive analytics and route optimization are enhancing user experience and operational efficiency. Strategic partnerships between mobility providers, technology companies, and public transit authorities are crucial for expanding service networks and creating seamless integrated offerings. Market expansion strategies, including the development of localized MaaS solutions tailored to the specific needs of different cities and regions, are vital for sustained growth. The increasing investment in sustainable transportation infrastructure, coupled with government incentives for MaaS adoption, further fuels market expansion. The development of open data platforms and standardized APIs is fostering greater collaboration and innovation within the ecosystem.
Key Players Shaping the MaaS Market Market
- The Hertz Corporation
- Moovel
- Uber Technologies Inc.
- Mobileo
- Beeline Mobility
- Enterprise Holdings Inc.
- Avis Budget Group
- Moovit Inc.
- Whim (Maas Global)
- Didi Chuxing
- Bridj Technology Pty Ltd
- Ubigo (via-id)
- Citymapper
Notable Milestones in MaaS Market Sector
- February 2023: Uber partnered with financial services firm HSBC to launch a digital payments solution in Egypt, enabling unbanked drivers to receive on-demand cash outs into mobile wallets, enhancing financial inclusion and convenience.
- January 2023: DiDi began collaborating with Jordan Transfer Guidance to integrate taxi dispatch services on routes that include the last mile, within Jordan's MaaS service and tourism DX business, anticipating the return of tourists.
- December 2022: Moovit launched a new urban mobility app in Tampa, assisting users in planning multimodal trips, including walking, biking, scooting, driving, streetcar, and bus, as part of a pilot program integrating multimodal trip planning and HART mobile ticketing.
In-Depth MaaS Market Market Outlook
The MaaS market outlook is exceptionally promising, driven by a confluence of transformative trends. The growing demand for sustainable, efficient, and integrated urban mobility solutions will continue to be the primary growth engine. Strategic partnerships and ongoing technological innovations, particularly in AI and data analytics, will further refine user experiences and operational efficiencies. The expansion of MaaS into emerging economies, coupled with supportive government policies and smart city initiatives, presents significant untapped potential. Opportunities abound in developing hyper-personalized mobility packages, integrating new mobility services like autonomous vehicles, and creating holistic urban transport ecosystems that enhance quality of life and economic productivity. The continuous evolution of consumer preferences towards on-demand, flexible, and eco-conscious travel will solidify MaaS as an indispensable component of future urban living.
MaaS Market Segmentation
-
1. Service Type
- 1.1. Car
- 1.2. Bus
- 1.3. Bike
-
2. Transportation Type
- 2.1. Public
- 2.2. Private
MaaS Market Segmentation By Geography
-
1. North America
- 1.1. United States
- 1.2. Canada
- 1.3. Rest of North America
-
2. Europe
- 2.1. Germany
- 2.2. United Kingdom
- 2.3. France
- 2.4. Rest of Europe
-
3. Asia Pacific
- 3.1. India
- 3.2. China
- 3.3. Japan
- 3.4. South Korea
- 3.5. Rest of Asia Pacific
-
4. Rest of the World
- 4.1. South America
- 4.2. Middle East and Africa
MaaS Market Regional Market Share
Geographic Coverage of MaaS Market
MaaS Market REPORT HIGHLIGHTS
| Aspects | Details |
|---|---|
| Study Period | 2020-2034 |
| Base Year | 2025 |
| Estimated Year | 2026 |
| Forecast Period | 2026-2034 |
| Historical Period | 2020-2025 |
| Growth Rate | CAGR of 7.43% from 2020-2034 |
| Segmentation |
|
Table of Contents
- 1. Introduction
- 1.1. Research Scope
- 1.2. Market Segmentation
- 1.3. Research Objective
- 1.4. Definitions and Assumptions
- 2. Executive Summary
- 2.1. Market Snapshot
- 3. Market Dynamics
- 3.1. Market Drivers
- 3.2. Market Restrains
- 3.3. Market Trends
- 3.4. Market Opportunities
- 4. Market Factor Analysis
- 4.1. Porters Five Forces
- 4.1.1. Bargaining Power of Suppliers
- 4.1.2. Bargaining Power of Buyers
- 4.1.3. Threat of New Entrants
- 4.1.4. Threat of Substitutes
- 4.1.5. Competitive Rivalry
- 4.2. PESTEL analysis
- 4.3. BCG Analysis
- 4.3.1. Stars (High Growth, High Market Share)
- 4.3.2. Cash Cows (Low Growth, High Market Share)
- 4.3.3. Question Mark (High Growth, Low Market Share)
- 4.3.4. Dogs (Low Growth, Low Market Share)
- 4.4. Ansoff Matrix Analysis
- 4.5. Supply Chain Analysis
- 4.6. Regulatory Landscape
- 4.7. Current Market Potential and Opportunity Assessment (TAM–SAM–SOM Framework)
- 4.8. NRP Analyst Note
- 4.1. Porters Five Forces
- 5. Market Analysis, Insights and Forecast 2021-2033
- 5.1. Market Analysis, Insights and Forecast - by Service Type
- 5.1.1. Car
- 5.1.2. Bus
- 5.1.3. Bike
- 5.2. Market Analysis, Insights and Forecast - by Transportation Type
- 5.2.1. Public
- 5.2.2. Private
- 5.3. Market Analysis, Insights and Forecast - by Region
- 5.3.1. North America
- 5.3.2. Europe
- 5.3.3. Asia Pacific
- 5.3.4. Rest of the World
- 5.1. Market Analysis, Insights and Forecast - by Service Type
- 6. Global MaaS Market Analysis, Insights and Forecast, 2021-2033
- 6.1. Market Analysis, Insights and Forecast - by Service Type
- 6.1.1. Car
- 6.1.2. Bus
- 6.1.3. Bike
- 6.2. Market Analysis, Insights and Forecast - by Transportation Type
- 6.2.1. Public
- 6.2.2. Private
- 6.1. Market Analysis, Insights and Forecast - by Service Type
- 7. North America MaaS Market Analysis, Insights and Forecast, 2020-2032
- 7.1. Market Analysis, Insights and Forecast - by Service Type
- 7.1.1. Car
- 7.1.2. Bus
- 7.1.3. Bike
- 7.2. Market Analysis, Insights and Forecast - by Transportation Type
- 7.2.1. Public
- 7.2.2. Private
- 7.1. Market Analysis, Insights and Forecast - by Service Type
- 8. Europe MaaS Market Analysis, Insights and Forecast, 2020-2032
- 8.1. Market Analysis, Insights and Forecast - by Service Type
- 8.1.1. Car
- 8.1.2. Bus
- 8.1.3. Bike
- 8.2. Market Analysis, Insights and Forecast - by Transportation Type
- 8.2.1. Public
- 8.2.2. Private
- 8.1. Market Analysis, Insights and Forecast - by Service Type
- 9. Asia Pacific MaaS Market Analysis, Insights and Forecast, 2020-2032
- 9.1. Market Analysis, Insights and Forecast - by Service Type
- 9.1.1. Car
- 9.1.2. Bus
- 9.1.3. Bike
- 9.2. Market Analysis, Insights and Forecast - by Transportation Type
- 9.2.1. Public
- 9.2.2. Private
- 9.1. Market Analysis, Insights and Forecast - by Service Type
- 10. Rest of the World MaaS Market Analysis, Insights and Forecast, 2020-2032
- 10.1. Market Analysis, Insights and Forecast - by Service Type
- 10.1.1. Car
- 10.1.2. Bus
- 10.1.3. Bike
- 10.2. Market Analysis, Insights and Forecast - by Transportation Type
- 10.2.1. Public
- 10.2.2. Private
- 10.1. Market Analysis, Insights and Forecast - by Service Type
- 11. Competitive Analysis
- 11.1. Company Profiles
- 11.1.1 The Hertz Corporation
- 11.1.1.1. Company Overview
- 11.1.1.2. Products
- 11.1.1.3. Company Financials
- 11.1.1.4. SWOT Analysis
- 11.1.2 Moovel
- 11.1.2.1. Company Overview
- 11.1.2.2. Products
- 11.1.2.3. Company Financials
- 11.1.2.4. SWOT Analysis
- 11.1.3 Uber Technologies Inc
- 11.1.3.1. Company Overview
- 11.1.3.2. Products
- 11.1.3.3. Company Financials
- 11.1.3.4. SWOT Analysis
- 11.1.4 Mobileo
- 11.1.4.1. Company Overview
- 11.1.4.2. Products
- 11.1.4.3. Company Financials
- 11.1.4.4. SWOT Analysis
- 11.1.5 Beeline Mobility
- 11.1.5.1. Company Overview
- 11.1.5.2. Products
- 11.1.5.3. Company Financials
- 11.1.5.4. SWOT Analysis
- 11.1.6 Enterprise Holdings Inc
- 11.1.6.1. Company Overview
- 11.1.6.2. Products
- 11.1.6.3. Company Financials
- 11.1.6.4. SWOT Analysis
- 11.1.7 Avis Budget Group
- 11.1.7.1. Company Overview
- 11.1.7.2. Products
- 11.1.7.3. Company Financials
- 11.1.7.4. SWOT Analysis
- 11.1.8 Moovit Inc
- 11.1.8.1. Company Overview
- 11.1.8.2. Products
- 11.1.8.3. Company Financials
- 11.1.8.4. SWOT Analysis
- 11.1.9 Whim (Maas Global)
- 11.1.9.1. Company Overview
- 11.1.9.2. Products
- 11.1.9.3. Company Financials
- 11.1.9.4. SWOT Analysis
- 11.1.10 Didi Chuxing
- 11.1.10.1. Company Overview
- 11.1.10.2. Products
- 11.1.10.3. Company Financials
- 11.1.10.4. SWOT Analysis
- 11.1.11 Bridj Technology Pty Ltd
- 11.1.11.1. Company Overview
- 11.1.11.2. Products
- 11.1.11.3. Company Financials
- 11.1.11.4. SWOT Analysis
- 11.1.12 Ubigo (via-id)
- 11.1.12.1. Company Overview
- 11.1.12.2. Products
- 11.1.12.3. Company Financials
- 11.1.12.4. SWOT Analysis
- 11.1.13 Citymapper
- 11.1.13.1. Company Overview
- 11.1.13.2. Products
- 11.1.13.3. Company Financials
- 11.1.13.4. SWOT Analysis
- 11.1.1 The Hertz Corporation
- 11.2. Market Entropy
- 11.2.1 Company's Key Areas Served
- 11.2.2 Recent Developments
- 11.3. Company Market Share Analysis 2025
- 11.3.1 Top 5 Companies Market Share Analysis
- 11.3.2 Top 3 Companies Market Share Analysis
- 11.4. List of Potential Customers
- 12. Research Methodology
List of Figures
- Figure 1: Global MaaS Market Revenue Breakdown (Million, %) by Region 2025 & 2033
- Figure 2: North America MaaS Market Revenue (Million), by Service Type 2025 & 2033
- Figure 3: North America MaaS Market Revenue Share (%), by Service Type 2025 & 2033
- Figure 4: North America MaaS Market Revenue (Million), by Transportation Type 2025 & 2033
- Figure 5: North America MaaS Market Revenue Share (%), by Transportation Type 2025 & 2033
- Figure 6: North America MaaS Market Revenue (Million), by Country 2025 & 2033
- Figure 7: North America MaaS Market Revenue Share (%), by Country 2025 & 2033
- Figure 8: Europe MaaS Market Revenue (Million), by Service Type 2025 & 2033
- Figure 9: Europe MaaS Market Revenue Share (%), by Service Type 2025 & 2033
- Figure 10: Europe MaaS Market Revenue (Million), by Transportation Type 2025 & 2033
- Figure 11: Europe MaaS Market Revenue Share (%), by Transportation Type 2025 & 2033
- Figure 12: Europe MaaS Market Revenue (Million), by Country 2025 & 2033
- Figure 13: Europe MaaS Market Revenue Share (%), by Country 2025 & 2033
- Figure 14: Asia Pacific MaaS Market Revenue (Million), by Service Type 2025 & 2033
- Figure 15: Asia Pacific MaaS Market Revenue Share (%), by Service Type 2025 & 2033
- Figure 16: Asia Pacific MaaS Market Revenue (Million), by Transportation Type 2025 & 2033
- Figure 17: Asia Pacific MaaS Market Revenue Share (%), by Transportation Type 2025 & 2033
- Figure 18: Asia Pacific MaaS Market Revenue (Million), by Country 2025 & 2033
- Figure 19: Asia Pacific MaaS Market Revenue Share (%), by Country 2025 & 2033
- Figure 20: Rest of the World MaaS Market Revenue (Million), by Service Type 2025 & 2033
- Figure 21: Rest of the World MaaS Market Revenue Share (%), by Service Type 2025 & 2033
- Figure 22: Rest of the World MaaS Market Revenue (Million), by Transportation Type 2025 & 2033
- Figure 23: Rest of the World MaaS Market Revenue Share (%), by Transportation Type 2025 & 2033
- Figure 24: Rest of the World MaaS Market Revenue (Million), by Country 2025 & 2033
- Figure 25: Rest of the World MaaS Market Revenue Share (%), by Country 2025 & 2033
List of Tables
- Table 1: Global MaaS Market Revenue Million Forecast, by Service Type 2020 & 2033
- Table 2: Global MaaS Market Revenue Million Forecast, by Transportation Type 2020 & 2033
- Table 3: Global MaaS Market Revenue Million Forecast, by Region 2020 & 2033
- Table 4: Global MaaS Market Revenue Million Forecast, by Service Type 2020 & 2033
- Table 5: Global MaaS Market Revenue Million Forecast, by Transportation Type 2020 & 2033
- Table 6: Global MaaS Market Revenue Million Forecast, by Country 2020 & 2033
- Table 7: United States MaaS Market Revenue (Million) Forecast, by Application 2020 & 2033
- Table 8: Canada MaaS Market Revenue (Million) Forecast, by Application 2020 & 2033
- Table 9: Rest of North America MaaS Market Revenue (Million) Forecast, by Application 2020 & 2033
- Table 10: Global MaaS Market Revenue Million Forecast, by Service Type 2020 & 2033
- Table 11: Global MaaS Market Revenue Million Forecast, by Transportation Type 2020 & 2033
- Table 12: Global MaaS Market Revenue Million Forecast, by Country 2020 & 2033
- Table 13: Germany MaaS Market Revenue (Million) Forecast, by Application 2020 & 2033
- Table 14: United Kingdom MaaS Market Revenue (Million) Forecast, by Application 2020 & 2033
- Table 15: France MaaS Market Revenue (Million) Forecast, by Application 2020 & 2033
- Table 16: Rest of Europe MaaS Market Revenue (Million) Forecast, by Application 2020 & 2033
- Table 17: Global MaaS Market Revenue Million Forecast, by Service Type 2020 & 2033
- Table 18: Global MaaS Market Revenue Million Forecast, by Transportation Type 2020 & 2033
- Table 19: Global MaaS Market Revenue Million Forecast, by Country 2020 & 2033
- Table 20: India MaaS Market Revenue (Million) Forecast, by Application 2020 & 2033
- Table 21: China MaaS Market Revenue (Million) Forecast, by Application 2020 & 2033
- Table 22: Japan MaaS Market Revenue (Million) Forecast, by Application 2020 & 2033
- Table 23: South Korea MaaS Market Revenue (Million) Forecast, by Application 2020 & 2033
- Table 24: Rest of Asia Pacific MaaS Market Revenue (Million) Forecast, by Application 2020 & 2033
- Table 25: Global MaaS Market Revenue Million Forecast, by Service Type 2020 & 2033
- Table 26: Global MaaS Market Revenue Million Forecast, by Transportation Type 2020 & 2033
- Table 27: Global MaaS Market Revenue Million Forecast, by Country 2020 & 2033
- Table 28: South America MaaS Market Revenue (Million) Forecast, by Application 2020 & 2033
- Table 29: Middle East and Africa MaaS Market Revenue (Million) Forecast, by Application 2020 & 2033
Frequently Asked Questions
1. What is the projected Compound Annual Growth Rate (CAGR) of the MaaS Market?
The projected CAGR is approximately 7.43%.
2. Which companies are prominent players in the MaaS Market?
Key companies in the market include The Hertz Corporation, Moovel, Uber Technologies Inc, Mobileo, Beeline Mobility, Enterprise Holdings Inc, Avis Budget Group, Moovit Inc, Whim (Maas Global), Didi Chuxing, Bridj Technology Pty Ltd, Ubigo (via-id), Citymapper.
3. What are the main segments of the MaaS Market?
The market segments include Service Type, Transportation Type.
4. Can you provide details about the market size?
The market size is estimated to be USD 0.78 Million as of 2022.
5. What are some drivers contributing to market growth?
Increasing Vehicle Production; Emphasis on Vehicle Comfort and NVH Reduction.
6. What are the notable trends driving market growth?
Increasing Traffic Congestion Drive the Demand in the Market.
7. Are there any restraints impacting market growth?
Economic Fluctuations And Uncertainties.
8. Can you provide examples of recent developments in the market?
In February 2023, Uber partnered with financial services firm HSBC to launch a digital payments solution that allows unbanked drivers in Egypt to receive on-demand cash outs into mobile wallets. Through this collaboration, the companies hope to provide Uber platform drivers with access to 100% of their earnings in a timely and convenient manner via HSBC Net's payment solution.
9. What pricing options are available for accessing the report?
Pricing options include single-user, multi-user, and enterprise licenses priced at USD 4750, USD 5250, and USD 8750 respectively.
10. Is the market size provided in terms of value or volume?
The market size is provided in terms of value, measured in Million.
11. Are there any specific market keywords associated with the report?
Yes, the market keyword associated with the report is "MaaS Market," which aids in identifying and referencing the specific market segment covered.
12. How do I determine which pricing option suits my needs best?
The pricing options vary based on user requirements and access needs. Individual users may opt for single-user licenses, while businesses requiring broader access may choose multi-user or enterprise licenses for cost-effective access to the report.
13. Are there any additional resources or data provided in the MaaS Market report?
While the report offers comprehensive insights, it's advisable to review the specific contents or supplementary materials provided to ascertain if additional resources or data are available.
14. How can I stay updated on further developments or reports in the MaaS Market?
To stay informed about further developments, trends, and reports in the MaaS Market, consider subscribing to industry newsletters, following relevant companies and organizations, or regularly checking reputable industry news sources and publications.
Methodology
Step 1 - Identification of Relevant Samples Size from Population Database


Step 2 - Approaches for Defining Global Market Size (Value, Volume* & Price*)

Note*: In applicable scenarios
Step 3 - Data Sources
Primary Research
- Web Analytics
- Survey Reports
- Research Institute
- Latest Research Reports
- Opinion Leaders
Secondary Research
- Annual Reports
- White Paper
- Latest Press Release
- Industry Association
- Paid Database
- Investor Presentations

Step 4 - Data Triangulation
Involves using different sources of information in order to increase the validity of a study
These sources are likely to be stakeholders in a program - participants, other researchers, program staff, other community members, and so on.
Then we put all data in single framework & apply various statistical tools to find out the dynamic on the market.
During the analysis stage, feedback from the stakeholder groups would be compared to determine areas of agreement as well as areas of divergence