

Key Insights
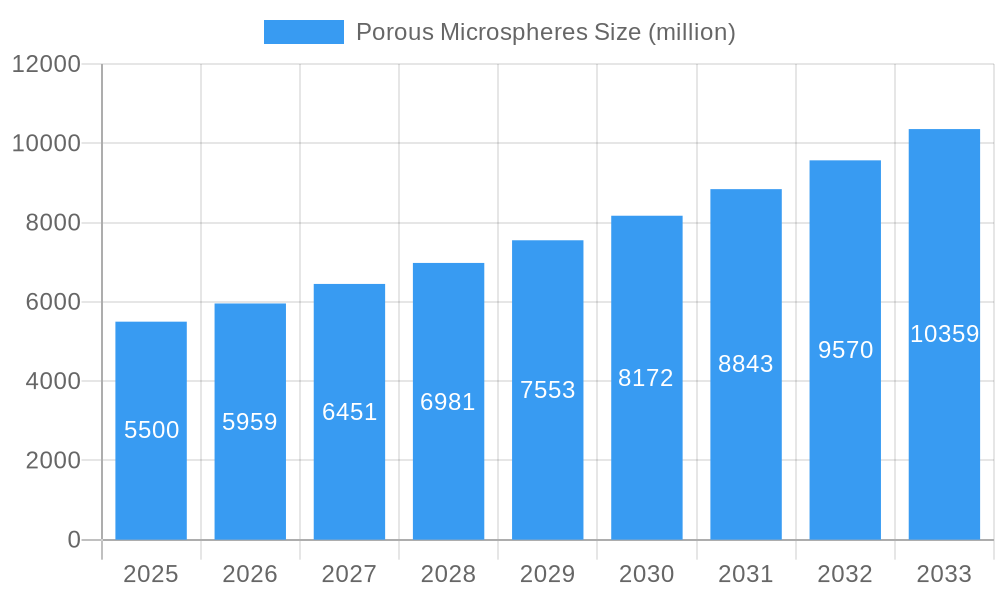
The global porous microspheres market is poised for significant expansion, projected to reach an estimated USD 5.5 billion by 2025, with a robust Compound Annual Growth Rate (CAGR) of 8.5% expected throughout the forecast period of 2025-2033. This impressive growth is primarily fueled by the escalating demand across a multitude of industries, including pharmaceuticals, where porous microspheres play a critical role in controlled drug delivery systems and advanced therapeutic formulations. The chemical industry is another major contributor, leveraging these versatile materials for catalysis, separation processes, and as functional additives. Furthermore, the increasing focus on environmental applications, such as water purification and pollutant remediation, is driving innovation and adoption. The food ingredients sector is also witnessing a rise in their utilization for texture modification and encapsulation of active compounds.
Porous Microspheres Market Size (In Billion)
Key drivers underpinning this market growth include advancements in material science leading to the development of microspheres with tailored porosity, surface area, and biocompatibility. The development of novel applications in diagnostics and biotechnology further bolsters market prospects. However, certain restraints exist, such as the high cost of production for specialized microspheres and stringent regulatory hurdles for specific applications, particularly in the pharmaceutical and food industries. Despite these challenges, the inherent versatility and unique properties of porous microspheres, encompassing porous silica, polymer, and calcium carbonate variants, position them as indispensable components in a wide array of cutting-edge technologies and industrial processes, ensuring sustained market momentum.
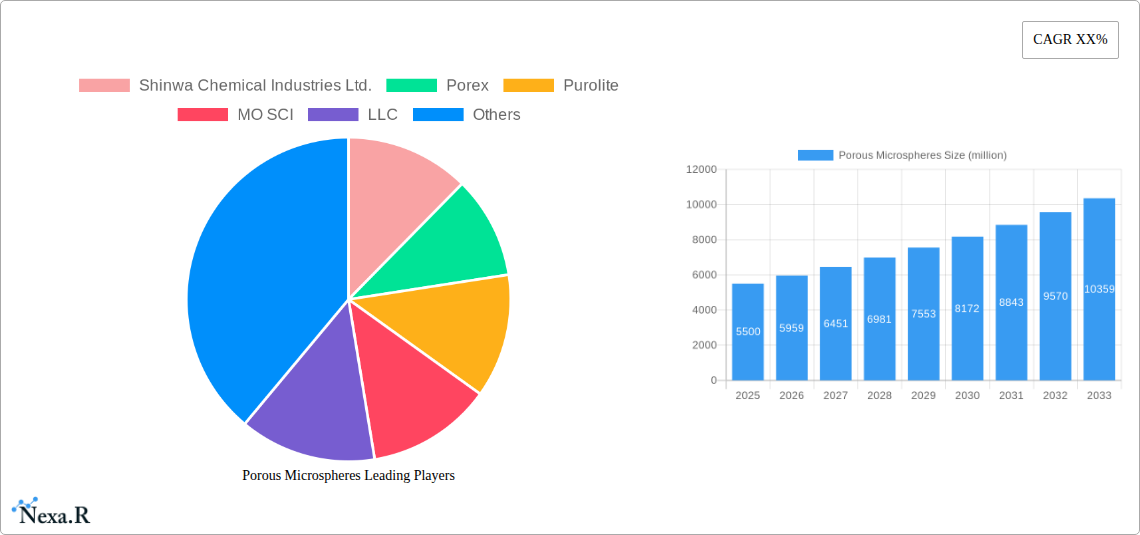
Porous Microspheres Company Market Share
Porous Microspheres Market Report: Innovations, Growth, and Future Outlook (2019-2033)
This comprehensive report delves into the dynamic global Porous Microspheres market, offering in-depth analysis of market structure, growth trajectories, regional dominance, product landscape, and future opportunities. Spanning the historical period of 2019-2024 and extending to a detailed forecast for 2025-2033, with the base and estimated year of 2025, this study provides critical insights for stakeholders. We analyze the market's evolution, driven by advancements in pharmaceuticals, the chemical industry, environmental solutions, and food ingredients, covering key types like Porous Silica Microspheres, Porous Polymer Microspheres, and Porous Calcium Carbonate Microspheres.
Porous Microspheres Market Dynamics & Structure
The global porous microspheres market is characterized by a moderately consolidated structure, with leading players like Shinwa Chemical Industries Ltd., Porex, Purolite, and MO SCI, LLC holding significant influence. Technological innovation serves as a primary driver, fueled by the continuous demand for advanced materials with enhanced surface area and controlled porosity for applications in drug delivery, catalysis, and filtration. Regulatory frameworks, particularly concerning product safety and environmental impact, play a crucial role in shaping market entry and product development. Competitive product substitutes, such as non-porous microspheres or alternative particulate materials, present a constant challenge, necessitating ongoing innovation and cost optimization. End-user demographics are increasingly sophisticated, demanding tailored solutions for specific industrial needs. Mergers and acquisitions (M&A) trends, while not rampant, indicate strategic moves by larger entities to acquire specialized technologies or expand their market reach. For instance, past M&A activities have often focused on integrating novel synthesis techniques or expanding production capacities, contributing to a market concentration of approximately 45% among the top five players by 2025. Innovation barriers include the high cost of research and development for novel materials and the stringent validation processes required in highly regulated sectors like pharmaceuticals.
Porous Microspheres Growth Trends & Insights
The global porous microspheres market is poised for substantial expansion, projected to grow at a Compound Annual Growth Rate (CAGR) of 7.5% from 2025 to 2033. This impressive growth trajectory is underpinned by a confluence of factors, including escalating demand from the pharmaceutical sector for advanced drug delivery systems, where enhanced bioavailability and controlled release mechanisms are paramount. The chemical industry's increasing reliance on porous microspheres as catalysts and supports for various chemical reactions further bolsters market penetration. Environmental applications, such as water purification and air filtration, are witnessing significant adoption due to growing global concerns over pollution and the need for efficient separation technologies. Moreover, the food ingredients segment is exploring porous microspheres for encapsulation of flavors, nutrients, and active compounds, contributing to product innovation and shelf-life extension.
Technological disruptions are playing a pivotal role. Advances in synthesis techniques, including emulsion-templated synthesis and spray drying, are enabling the production of microspheres with precisely controlled pore size, surface area, and morphology. This has opened up new application frontiers and improved the performance of existing ones. For example, the development of stimuli-responsive porous microspheres that release encapsulated substances under specific conditions (e.g., pH, temperature) is a major innovation gaining traction. Consumer behavior shifts are also influencing the market. There is a growing preference for products that offer enhanced efficacy, sustainability, and safety, all of which can be facilitated by the unique properties of porous microspheres. The estimated market size in 2025 is $5,200 million, with projections reaching over $9,000 million by 2033. Market penetration is steadily increasing across all key application segments, with pharmaceuticals currently leading, accounting for an estimated 30% of the total market share in 2025. The "Others" segment, encompassing niche applications in diagnostics and cosmetics, is also showing promising growth.
Dominant Regions, Countries, or Segments in Porous Microspheres
The Pharmaceuticals application segment is the undisputed leader in the global porous microspheres market, driving significant growth and innovation. In 2025, this segment is estimated to hold approximately 30% of the total market share, valued at $1,560 million. The dominance of pharmaceuticals is attributed to the critical need for advanced materials in drug formulation, enabling controlled drug release, improved bioavailability, and targeted delivery of therapeutics. This translates into enhanced patient outcomes and reduced side effects. The development of porous silica microspheres for injectables and porous polymer microspheres for oral drug delivery systems are key examples of their pivotal role.
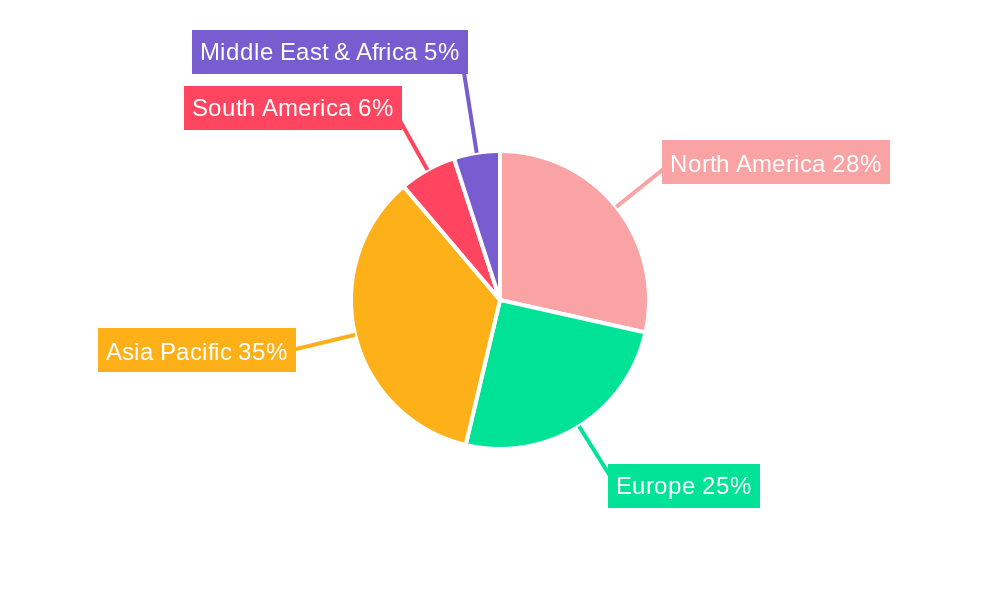
Geographically, North America is the leading region, accounting for an estimated 35% of the global market share in 2025, valued at $1,820 million. This dominance is fueled by a robust pharmaceutical industry, significant investment in R&D, and a strong regulatory environment that encourages the adoption of innovative healthcare solutions. The United States, in particular, benefits from a high prevalence of chronic diseases, driving demand for advanced drug delivery technologies. Key drivers in this region include government funding for biomedical research, the presence of major pharmaceutical and biotechnology companies, and a well-established healthcare infrastructure.
The Chemical Industry stands as the second-largest application segment, contributing an estimated 25% to the market in 2025, valued at $1,300 million. Porous microspheres are indispensable in this sector as catalysts, catalyst supports, adsorbents, and separation media due to their high surface area and tailored pore structures. The growing demand for efficient and sustainable chemical processes, including green chemistry initiatives, further propels the use of these materials.
Key Drivers in North America:
- Strong pharmaceutical and biotechnology sector presence.
- High per capita healthcare expenditure.
- Significant government and private investment in R&D.
- Favorable regulatory landscape for medical devices and pharmaceuticals.
- Advancements in materials science research.
Dominance Factors for Pharmaceuticals Segment:
- Enhanced drug efficacy and patient compliance.
- Development of personalized medicine.
- Cost-effectiveness in the long run through reduced dosage and side effects.
- Growing pipeline of novel drug formulations.
Porous Microspheres Product Landscape
The porous microspheres product landscape is characterized by continuous innovation, with a strong emphasis on tailoring material properties for specific applications. Porous silica microspheres, a cornerstone, offer excellent biocompatibility and tunable porosity, making them ideal for controlled drug release, chromatography, and imaging agents. Porous polymer microspheres are gaining traction due to their versatility, allowing for a wide range of surface modifications and encapsulation capabilities, particularly in drug delivery and cosmetic formulations. Porous calcium carbonate microspheres are emerging as a sustainable and cost-effective alternative for applications in coatings, fillers, and biomedical scaffolds. Unique selling propositions include high surface area, controlled pore size distribution, and the ability to encapsulate active ingredients. Technological advancements in synthesis and surface functionalization are enabling the development of smart microspheres with stimuli-responsive properties.
Key Drivers, Barriers & Challenges in Porous Microspheres
Key Drivers:
- Technological Advancements: Innovations in synthesis techniques leading to precisely engineered pore structures and surface functionalities.
- Growing Demand in Pharmaceuticals: Need for advanced drug delivery systems, enhanced bioavailability, and targeted therapies.
- Environmental Concerns: Increasing use in water purification, air filtration, and pollution control.
- Expanding Chemical Industry Applications: Utilization as catalysts, adsorbents, and separation media in diverse chemical processes.
Barriers & Challenges:
- High R&D Costs: Developing novel porous microspheres with specific properties requires substantial investment.
- Stringent Regulatory Approvals: Particularly in pharmaceuticals and food ingredients, leading to lengthy validation processes.
- Scalability of Production: Transitioning from laboratory-scale synthesis to industrial-scale production can be challenging and costly.
- Competition from Alternatives: Non-porous materials or other particulate systems can offer similar functionalities at a lower cost in some applications.
- Supply Chain Volatility: Sourcing of specialized raw materials can be subject to price fluctuations and availability issues, impacting production costs by an estimated 5-10%.
Emerging Opportunities in Porous Microspheres
Emerging opportunities in the porous microspheres market are abundant and largely driven by advancements in material science and an increasing demand for sustainable and high-performance solutions. The field of regenerative medicine presents a significant untapped market, with porous microspheres being explored for tissue engineering scaffolds and cell delivery systems. In the cosmetics industry, there is growing interest in porous microspheres for controlled release of active ingredients, UV protection, and texture enhancement. The development of smart microspheres that respond to external stimuli, such as temperature, pH, or magnetic fields, opens doors for highly targeted drug delivery and advanced diagnostic applications. Furthermore, the increasing focus on circular economy principles is driving research into bio-based and biodegradable porous microspheres. The market for specialty coatings and adhesives is also expanding, where porous microspheres can enhance properties like insulation, flame retardancy, and adhesion.
Growth Accelerators in the Porous Microspheres Industry
Several key catalysts are propelling the long-term growth of the porous microspheres industry. Technological breakthroughs in nanotechnology and advanced manufacturing, such as 3D printing of microspheres, are enabling the creation of increasingly complex and functional materials. Strategic partnerships between material science companies, research institutions, and end-user industries are accelerating the development and commercialization of novel applications. For instance, collaborations for developing advanced drug delivery formulations or novel catalytic systems are proving highly effective. Furthermore, market expansion strategies targeting rapidly growing economies and emerging application areas, such as advanced agricultural chemicals and innovative food packaging, are significantly contributing to sustained growth. The increasing global emphasis on sustainability and eco-friendly solutions is also a major accelerator, driving the development of biodegradable and recyclable porous microspheres.
Key Players Shaping the Porous Microspheres Market
- Shinwa Chemical Industries Ltd.
- Porex
- Purolite
- MO SCI, LLC
Notable Milestones in Porous Microspheres Sector
- 2019: Launch of novel porous silica microspheres with enhanced surface area for advanced chromatographic separations.
- 2020: Development of biodegradable porous polymer microspheres for controlled drug release applications.
- 2021: Significant advancements in spray drying techniques enabling the mass production of highly uniform porous microspheres.
- 2022: Introduction of porous calcium carbonate microspheres with antimicrobial properties for food packaging applications.
- 2023: Strategic acquisition of a specialized microsphere technology company by a major chemical conglomerate to expand its specialty materials portfolio.
- 2024: Breakthrough in developing stimuli-responsive porous microspheres for targeted cancer therapy.
In-Depth Porous Microspheres Market Outlook
The future outlook for the porous microspheres market is exceptionally bright, driven by its indispensable role in advancing key industries. Growth accelerators, including continuous technological innovation in materials science, strategic collaborations between industry leaders and research institutions, and targeted market expansion into emerging economies and novel application domains, will fuel sustained expansion. The increasing demand for customized solutions in pharmaceuticals, the imperative for sustainable practices in the chemical and environmental sectors, and the growing consumer preference for advanced and safe products in food ingredients will create substantial opportunities. The market is poised to witness a significant CAGR of approximately 7.5% through 2033, with the estimated market size in 2025 projected to reach $5,200 million and further ascend to over $9,000 million by 2033. Strategic investments in R&D and production capabilities will be crucial for stakeholders to capitalize on the vast potential of this dynamic market.
Porous Microspheres Segmentation
-
1. Application
- 1.1. Pharmaceuticals
- 1.2. Chemical Industry
- 1.3. Environmental
- 1.4. Food Ingredients
- 1.5. Others
-
2. Types
- 2.1. Porous Silica Microspheres
- 2.2. Porous Polymer Microspheres
- 2.3. Porous Calcium Carbonate Microspheres
- 2.4. Others
Porous Microspheres Segmentation By Geography
-
1. North America
- 1.1. United States
- 1.2. Canada
- 1.3. Mexico
-
2. South America
- 2.1. Brazil
- 2.2. Argentina
- 2.3. Rest of South America
-
3. Europe
- 3.1. United Kingdom
- 3.2. Germany
- 3.3. France
- 3.4. Italy
- 3.5. Spain
- 3.6. Russia
- 3.7. Benelux
- 3.8. Nordics
- 3.9. Rest of Europe
-
4. Middle East & Africa
- 4.1. Turkey
- 4.2. Israel
- 4.3. GCC
- 4.4. North Africa
- 4.5. South Africa
- 4.6. Rest of Middle East & Africa
-
5. Asia Pacific
- 5.1. China
- 5.2. India
- 5.3. Japan
- 5.4. South Korea
- 5.5. ASEAN
- 5.6. Oceania
- 5.7. Rest of Asia Pacific
Porous Microspheres Regional Market Share
Geographic Coverage of Porous Microspheres
Porous Microspheres REPORT HIGHLIGHTS
| Aspects | Details |
|---|---|
| Study Period | 2020-2034 |
| Base Year | 2025 |
| Estimated Year | 2026 |
| Forecast Period | 2026-2034 |
| Historical Period | 2020-2025 |
| Growth Rate | CAGR of XX% from 2020-2034 |
| Segmentation |
|
Table of Contents
- 1. Introduction
- 1.1. Research Scope
- 1.2. Market Segmentation
- 1.3. Research Methodology
- 1.4. Definitions and Assumptions
- 2. Executive Summary
- 2.1. Introduction
- 3. Market Dynamics
- 3.1. Introduction
- 3.2. Market Drivers
- 3.3. Market Restrains
- 3.4. Market Trends
- 4. Market Factor Analysis
- 4.1. Porters Five Forces
- 4.2. Supply/Value Chain
- 4.3. PESTEL analysis
- 4.4. Market Entropy
- 4.5. Patent/Trademark Analysis
- 5. Global Porous Microspheres Analysis, Insights and Forecast, 2020-2032
- 5.1. Market Analysis, Insights and Forecast - by Application
- 5.1.1. Pharmaceuticals
- 5.1.2. Chemical Industry
- 5.1.3. Environmental
- 5.1.4. Food Ingredients
- 5.1.5. Others
- 5.2. Market Analysis, Insights and Forecast - by Types
- 5.2.1. Porous Silica Microspheres
- 5.2.2. Porous Polymer Microspheres
- 5.2.3. Porous Calcium Carbonate Microspheres
- 5.2.4. Others
- 5.3. Market Analysis, Insights and Forecast - by Region
- 5.3.1. North America
- 5.3.2. South America
- 5.3.3. Europe
- 5.3.4. Middle East & Africa
- 5.3.5. Asia Pacific
- 5.1. Market Analysis, Insights and Forecast - by Application
- 6. North America Porous Microspheres Analysis, Insights and Forecast, 2020-2032
- 6.1. Market Analysis, Insights and Forecast - by Application
- 6.1.1. Pharmaceuticals
- 6.1.2. Chemical Industry
- 6.1.3. Environmental
- 6.1.4. Food Ingredients
- 6.1.5. Others
- 6.2. Market Analysis, Insights and Forecast - by Types
- 6.2.1. Porous Silica Microspheres
- 6.2.2. Porous Polymer Microspheres
- 6.2.3. Porous Calcium Carbonate Microspheres
- 6.2.4. Others
- 6.1. Market Analysis, Insights and Forecast - by Application
- 7. South America Porous Microspheres Analysis, Insights and Forecast, 2020-2032
- 7.1. Market Analysis, Insights and Forecast - by Application
- 7.1.1. Pharmaceuticals
- 7.1.2. Chemical Industry
- 7.1.3. Environmental
- 7.1.4. Food Ingredients
- 7.1.5. Others
- 7.2. Market Analysis, Insights and Forecast - by Types
- 7.2.1. Porous Silica Microspheres
- 7.2.2. Porous Polymer Microspheres
- 7.2.3. Porous Calcium Carbonate Microspheres
- 7.2.4. Others
- 7.1. Market Analysis, Insights and Forecast - by Application
- 8. Europe Porous Microspheres Analysis, Insights and Forecast, 2020-2032
- 8.1. Market Analysis, Insights and Forecast - by Application
- 8.1.1. Pharmaceuticals
- 8.1.2. Chemical Industry
- 8.1.3. Environmental
- 8.1.4. Food Ingredients
- 8.1.5. Others
- 8.2. Market Analysis, Insights and Forecast - by Types
- 8.2.1. Porous Silica Microspheres
- 8.2.2. Porous Polymer Microspheres
- 8.2.3. Porous Calcium Carbonate Microspheres
- 8.2.4. Others
- 8.1. Market Analysis, Insights and Forecast - by Application
- 9. Middle East & Africa Porous Microspheres Analysis, Insights and Forecast, 2020-2032
- 9.1. Market Analysis, Insights and Forecast - by Application
- 9.1.1. Pharmaceuticals
- 9.1.2. Chemical Industry
- 9.1.3. Environmental
- 9.1.4. Food Ingredients
- 9.1.5. Others
- 9.2. Market Analysis, Insights and Forecast - by Types
- 9.2.1. Porous Silica Microspheres
- 9.2.2. Porous Polymer Microspheres
- 9.2.3. Porous Calcium Carbonate Microspheres
- 9.2.4. Others
- 9.1. Market Analysis, Insights and Forecast - by Application
- 10. Asia Pacific Porous Microspheres Analysis, Insights and Forecast, 2020-2032
- 10.1. Market Analysis, Insights and Forecast - by Application
- 10.1.1. Pharmaceuticals
- 10.1.2. Chemical Industry
- 10.1.3. Environmental
- 10.1.4. Food Ingredients
- 10.1.5. Others
- 10.2. Market Analysis, Insights and Forecast - by Types
- 10.2.1. Porous Silica Microspheres
- 10.2.2. Porous Polymer Microspheres
- 10.2.3. Porous Calcium Carbonate Microspheres
- 10.2.4. Others
- 10.1. Market Analysis, Insights and Forecast - by Application
- 11. Competitive Analysis
- 11.1. Global Market Share Analysis 2025
- 11.2. Company Profiles
- 11.2.1 Shinwa Chemical Industries Ltd.
- 11.2.1.1. Overview
- 11.2.1.2. Products
- 11.2.1.3. SWOT Analysis
- 11.2.1.4. Recent Developments
- 11.2.1.5. Financials (Based on Availability)
- 11.2.2 Porex
- 11.2.2.1. Overview
- 11.2.2.2. Products
- 11.2.2.3. SWOT Analysis
- 11.2.2.4. Recent Developments
- 11.2.2.5. Financials (Based on Availability)
- 11.2.3 Purolite
- 11.2.3.1. Overview
- 11.2.3.2. Products
- 11.2.3.3. SWOT Analysis
- 11.2.3.4. Recent Developments
- 11.2.3.5. Financials (Based on Availability)
- 11.2.4 MO SCI
- 11.2.4.1. Overview
- 11.2.4.2. Products
- 11.2.4.3. SWOT Analysis
- 11.2.4.4. Recent Developments
- 11.2.4.5. Financials (Based on Availability)
- 11.2.5 LLC
- 11.2.5.1. Overview
- 11.2.5.2. Products
- 11.2.5.3. SWOT Analysis
- 11.2.5.4. Recent Developments
- 11.2.5.5. Financials (Based on Availability)
- 11.2.1 Shinwa Chemical Industries Ltd.
List of Figures
- Figure 1: Global Porous Microspheres Revenue Breakdown (million, %) by Region 2025 & 2033
- Figure 2: North America Porous Microspheres Revenue (million), by Application 2025 & 2033
- Figure 3: North America Porous Microspheres Revenue Share (%), by Application 2025 & 2033
- Figure 4: North America Porous Microspheres Revenue (million), by Types 2025 & 2033
- Figure 5: North America Porous Microspheres Revenue Share (%), by Types 2025 & 2033
- Figure 6: North America Porous Microspheres Revenue (million), by Country 2025 & 2033
- Figure 7: North America Porous Microspheres Revenue Share (%), by Country 2025 & 2033
- Figure 8: South America Porous Microspheres Revenue (million), by Application 2025 & 2033
- Figure 9: South America Porous Microspheres Revenue Share (%), by Application 2025 & 2033
- Figure 10: South America Porous Microspheres Revenue (million), by Types 2025 & 2033
- Figure 11: South America Porous Microspheres Revenue Share (%), by Types 2025 & 2033
- Figure 12: South America Porous Microspheres Revenue (million), by Country 2025 & 2033
- Figure 13: South America Porous Microspheres Revenue Share (%), by Country 2025 & 2033
- Figure 14: Europe Porous Microspheres Revenue (million), by Application 2025 & 2033
- Figure 15: Europe Porous Microspheres Revenue Share (%), by Application 2025 & 2033
- Figure 16: Europe Porous Microspheres Revenue (million), by Types 2025 & 2033
- Figure 17: Europe Porous Microspheres Revenue Share (%), by Types 2025 & 2033
- Figure 18: Europe Porous Microspheres Revenue (million), by Country 2025 & 2033
- Figure 19: Europe Porous Microspheres Revenue Share (%), by Country 2025 & 2033
- Figure 20: Middle East & Africa Porous Microspheres Revenue (million), by Application 2025 & 2033
- Figure 21: Middle East & Africa Porous Microspheres Revenue Share (%), by Application 2025 & 2033
- Figure 22: Middle East & Africa Porous Microspheres Revenue (million), by Types 2025 & 2033
- Figure 23: Middle East & Africa Porous Microspheres Revenue Share (%), by Types 2025 & 2033
- Figure 24: Middle East & Africa Porous Microspheres Revenue (million), by Country 2025 & 2033
- Figure 25: Middle East & Africa Porous Microspheres Revenue Share (%), by Country 2025 & 2033
- Figure 26: Asia Pacific Porous Microspheres Revenue (million), by Application 2025 & 2033
- Figure 27: Asia Pacific Porous Microspheres Revenue Share (%), by Application 2025 & 2033
- Figure 28: Asia Pacific Porous Microspheres Revenue (million), by Types 2025 & 2033
- Figure 29: Asia Pacific Porous Microspheres Revenue Share (%), by Types 2025 & 2033
- Figure 30: Asia Pacific Porous Microspheres Revenue (million), by Country 2025 & 2033
- Figure 31: Asia Pacific Porous Microspheres Revenue Share (%), by Country 2025 & 2033
List of Tables
- Table 1: Global Porous Microspheres Revenue million Forecast, by Application 2020 & 2033
- Table 2: Global Porous Microspheres Revenue million Forecast, by Types 2020 & 2033
- Table 3: Global Porous Microspheres Revenue million Forecast, by Region 2020 & 2033
- Table 4: Global Porous Microspheres Revenue million Forecast, by Application 2020 & 2033
- Table 5: Global Porous Microspheres Revenue million Forecast, by Types 2020 & 2033
- Table 6: Global Porous Microspheres Revenue million Forecast, by Country 2020 & 2033
- Table 7: United States Porous Microspheres Revenue (million) Forecast, by Application 2020 & 2033
- Table 8: Canada Porous Microspheres Revenue (million) Forecast, by Application 2020 & 2033
- Table 9: Mexico Porous Microspheres Revenue (million) Forecast, by Application 2020 & 2033
- Table 10: Global Porous Microspheres Revenue million Forecast, by Application 2020 & 2033
- Table 11: Global Porous Microspheres Revenue million Forecast, by Types 2020 & 2033
- Table 12: Global Porous Microspheres Revenue million Forecast, by Country 2020 & 2033
- Table 13: Brazil Porous Microspheres Revenue (million) Forecast, by Application 2020 & 2033
- Table 14: Argentina Porous Microspheres Revenue (million) Forecast, by Application 2020 & 2033
- Table 15: Rest of South America Porous Microspheres Revenue (million) Forecast, by Application 2020 & 2033
- Table 16: Global Porous Microspheres Revenue million Forecast, by Application 2020 & 2033
- Table 17: Global Porous Microspheres Revenue million Forecast, by Types 2020 & 2033
- Table 18: Global Porous Microspheres Revenue million Forecast, by Country 2020 & 2033
- Table 19: United Kingdom Porous Microspheres Revenue (million) Forecast, by Application 2020 & 2033
- Table 20: Germany Porous Microspheres Revenue (million) Forecast, by Application 2020 & 2033
- Table 21: France Porous Microspheres Revenue (million) Forecast, by Application 2020 & 2033
- Table 22: Italy Porous Microspheres Revenue (million) Forecast, by Application 2020 & 2033
- Table 23: Spain Porous Microspheres Revenue (million) Forecast, by Application 2020 & 2033
- Table 24: Russia Porous Microspheres Revenue (million) Forecast, by Application 2020 & 2033
- Table 25: Benelux Porous Microspheres Revenue (million) Forecast, by Application 2020 & 2033
- Table 26: Nordics Porous Microspheres Revenue (million) Forecast, by Application 2020 & 2033
- Table 27: Rest of Europe Porous Microspheres Revenue (million) Forecast, by Application 2020 & 2033
- Table 28: Global Porous Microspheres Revenue million Forecast, by Application 2020 & 2033
- Table 29: Global Porous Microspheres Revenue million Forecast, by Types 2020 & 2033
- Table 30: Global Porous Microspheres Revenue million Forecast, by Country 2020 & 2033
- Table 31: Turkey Porous Microspheres Revenue (million) Forecast, by Application 2020 & 2033
- Table 32: Israel Porous Microspheres Revenue (million) Forecast, by Application 2020 & 2033
- Table 33: GCC Porous Microspheres Revenue (million) Forecast, by Application 2020 & 2033
- Table 34: North Africa Porous Microspheres Revenue (million) Forecast, by Application 2020 & 2033
- Table 35: South Africa Porous Microspheres Revenue (million) Forecast, by Application 2020 & 2033
- Table 36: Rest of Middle East & Africa Porous Microspheres Revenue (million) Forecast, by Application 2020 & 2033
- Table 37: Global Porous Microspheres Revenue million Forecast, by Application 2020 & 2033
- Table 38: Global Porous Microspheres Revenue million Forecast, by Types 2020 & 2033
- Table 39: Global Porous Microspheres Revenue million Forecast, by Country 2020 & 2033
- Table 40: China Porous Microspheres Revenue (million) Forecast, by Application 2020 & 2033
- Table 41: India Porous Microspheres Revenue (million) Forecast, by Application 2020 & 2033
- Table 42: Japan Porous Microspheres Revenue (million) Forecast, by Application 2020 & 2033
- Table 43: South Korea Porous Microspheres Revenue (million) Forecast, by Application 2020 & 2033
- Table 44: ASEAN Porous Microspheres Revenue (million) Forecast, by Application 2020 & 2033
- Table 45: Oceania Porous Microspheres Revenue (million) Forecast, by Application 2020 & 2033
- Table 46: Rest of Asia Pacific Porous Microspheres Revenue (million) Forecast, by Application 2020 & 2033
Frequently Asked Questions
1. What is the projected Compound Annual Growth Rate (CAGR) of the Porous Microspheres?
The projected CAGR is approximately XX%.
2. Which companies are prominent players in the Porous Microspheres?
Key companies in the market include Shinwa Chemical Industries Ltd., Porex, Purolite, MO SCI, LLC.
3. What are the main segments of the Porous Microspheres?
The market segments include Application, Types.
4. Can you provide details about the market size?
The market size is estimated to be USD XXX million as of 2022.
5. What are some drivers contributing to market growth?
N/A
6. What are the notable trends driving market growth?
N/A
7. Are there any restraints impacting market growth?
N/A
8. Can you provide examples of recent developments in the market?
N/A
9. What pricing options are available for accessing the report?
Pricing options include single-user, multi-user, and enterprise licenses priced at USD 2900.00, USD 4350.00, and USD 5800.00 respectively.
10. Is the market size provided in terms of value or volume?
The market size is provided in terms of value, measured in million.
11. Are there any specific market keywords associated with the report?
Yes, the market keyword associated with the report is "Porous Microspheres," which aids in identifying and referencing the specific market segment covered.
12. How do I determine which pricing option suits my needs best?
The pricing options vary based on user requirements and access needs. Individual users may opt for single-user licenses, while businesses requiring broader access may choose multi-user or enterprise licenses for cost-effective access to the report.
13. Are there any additional resources or data provided in the Porous Microspheres report?
While the report offers comprehensive insights, it's advisable to review the specific contents or supplementary materials provided to ascertain if additional resources or data are available.
14. How can I stay updated on further developments or reports in the Porous Microspheres?
To stay informed about further developments, trends, and reports in the Porous Microspheres, consider subscribing to industry newsletters, following relevant companies and organizations, or regularly checking reputable industry news sources and publications.
Methodology
Step 1 - Identification of Relevant Samples Size from Population Database


Step 2 - Approaches for Defining Global Market Size (Value, Volume* & Price*)

Note*: In applicable scenarios
Step 3 - Data Sources
Primary Research
- Web Analytics
- Survey Reports
- Research Institute
- Latest Research Reports
- Opinion Leaders
Secondary Research
- Annual Reports
- White Paper
- Latest Press Release
- Industry Association
- Paid Database
- Investor Presentations

Step 4 - Data Triangulation
Involves using different sources of information in order to increase the validity of a study
These sources are likely to be stakeholders in a program - participants, other researchers, program staff, other community members, and so on.
Then we put all data in single framework & apply various statistical tools to find out the dynamic on the market.
During the analysis stage, feedback from the stakeholder groups would be compared to determine areas of agreement as well as areas of divergence