

Key Insights
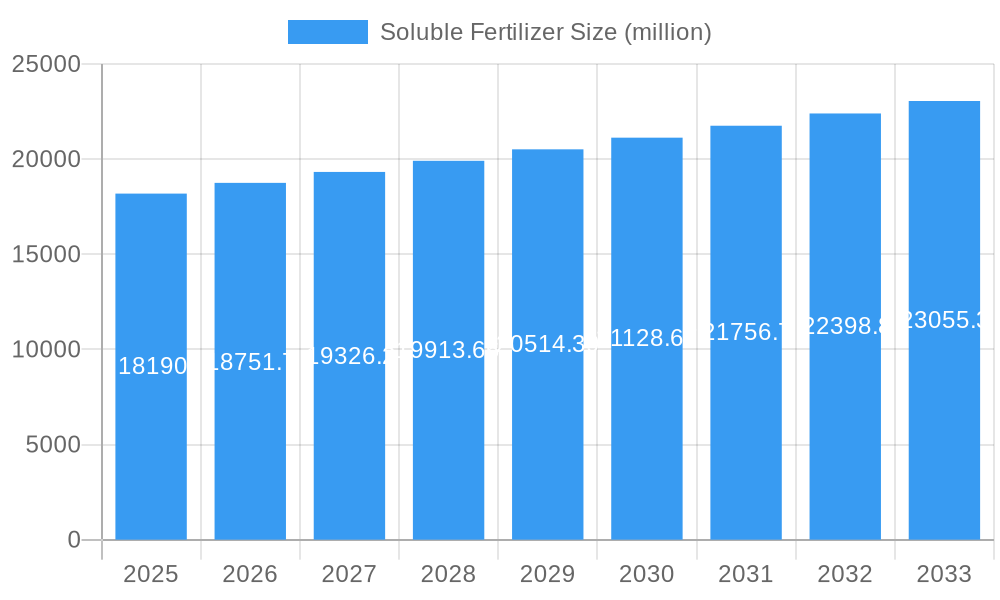
The soluble fertilizer market, currently valued at approximately $18.19 billion in 2025, is projected to experience steady growth, exhibiting a compound annual growth rate (CAGR) of 3% from 2025 to 2033. This growth is driven by several key factors. Increasing global food demand, coupled with the need for efficient and precise nutrient delivery to crops, fuels the adoption of soluble fertilizers. Farmers are increasingly recognizing the benefits of soluble fertilizers, including enhanced nutrient uptake by plants, improved crop yields, and reduced environmental impact compared to traditional granular fertilizers. The trend towards precision agriculture and technological advancements in fertilizer application techniques further bolster market expansion. Government initiatives promoting sustainable agriculture practices and investment in research and development for improved fertilizer formulations also contribute to market growth.
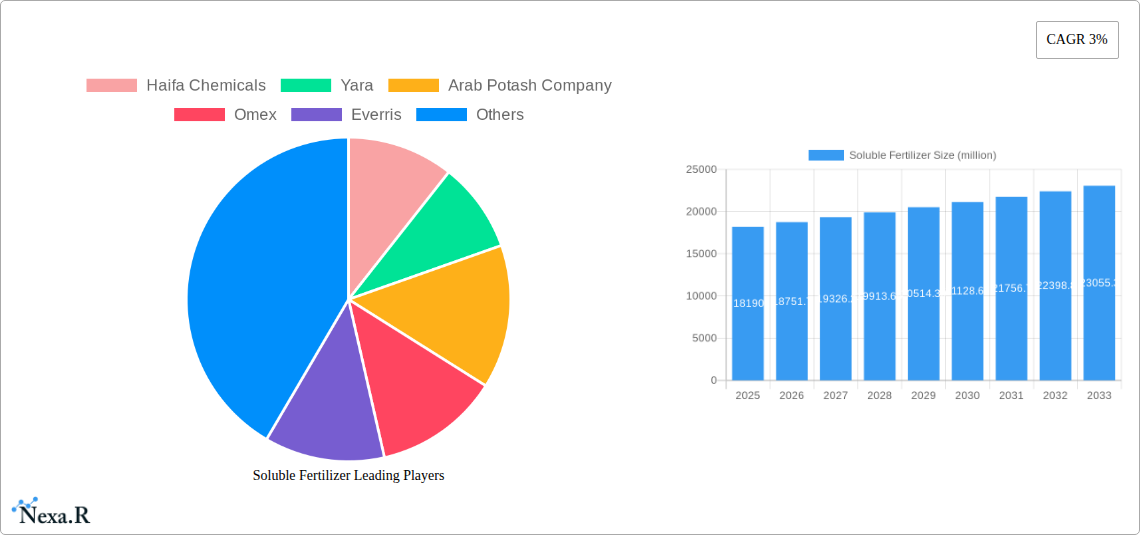
Soluble Fertilizer Market Size (In Billion)
However, the market faces certain restraints. Fluctuations in raw material prices, particularly potash and phosphate, can significantly impact production costs and profitability. Concerns regarding the potential environmental impact of fertilizer use, particularly nutrient runoff and water pollution, necessitate the development and adoption of sustainable fertilizer management practices. Competition from established players and the emergence of new entrants pose challenges to market participants. Despite these constraints, the long-term outlook for the soluble fertilizer market remains positive, driven by the continued growth in global food demand and the increasing adoption of advanced agricultural techniques. Major players like Haifa Chemicals, Yara, and ICL Fertilizers are expected to maintain significant market share, leveraging their established distribution networks and strong brand recognition. The market will witness increased innovation in fertilizer formulations, aiming to enhance nutrient efficiency and reduce environmental impact.
Soluble Fertilizer Company Market Share
Soluble Fertilizer Market Report: 2019-2033
This comprehensive report provides an in-depth analysis of the soluble fertilizer market, encompassing market dynamics, growth trends, regional dominance, product landscape, key challenges, emerging opportunities, and key players. The study period spans 2019-2033, with 2025 serving as the base and estimated year. The forecast period covers 2025-2033, and the historical period encompasses 2019-2024. The report is essential for industry professionals, investors, and strategic decision-makers seeking to understand and capitalize on the evolving soluble fertilizer landscape. The market is valued at xx million units in 2025 and is projected to reach xx million units by 2033.
Soluble Fertilizer Market Dynamics & Structure
The soluble fertilizer market is characterized by moderate concentration, with key players like Haifa Chemicals, Yara, and ICL Fertilizers holding significant market share (estimated at xx% combined in 2025). Technological innovation, particularly in controlled-release formulations and nutrient efficiency, is a key driver. Stringent environmental regulations concerning nutrient runoff are shaping product development and market access. Competitive substitutes include slow-release fertilizers and organic amendments, presenting ongoing challenges. End-user demographics are heavily influenced by agricultural practices and technological adoption in different regions. M&A activity in the sector remains moderate, with an estimated xx million units in deal volume during the historical period, mainly focused on expanding geographic reach and product portfolios.
- Market Concentration: Moderately concentrated, with top 5 players holding approximately xx% market share in 2025.
- Technological Innovation: Focus on controlled-release, nutrient efficiency, and precision application technologies.
- Regulatory Landscape: Stringent environmental regulations impacting product formulation and distribution.
- Competitive Substitutes: Slow-release fertilizers and organic amendments pose competitive pressure.
- M&A Activity: Moderate activity (xx million units in deal volume from 2019-2024), driven by expansion strategies.
- Innovation Barriers: High R&D costs and regulatory approval processes.
Soluble Fertilizer Growth Trends & Insights
The soluble fertilizer market experienced a CAGR of xx% during the historical period (2019-2024), driven by increasing global food demand and the rising adoption of intensive agricultural practices. Market penetration in developing economies remains relatively low, presenting substantial growth opportunities. Technological advancements, particularly in precision farming and data-driven agriculture, are enhancing the efficiency and effectiveness of soluble fertilizers. Consumer behavior shifts toward sustainable and environmentally friendly agricultural practices are influencing the demand for specialized soluble fertilizer formulations. The market is expected to maintain a robust growth trajectory, with a projected CAGR of xx% during the forecast period (2025-2033), reaching an estimated xx million units by 2033.
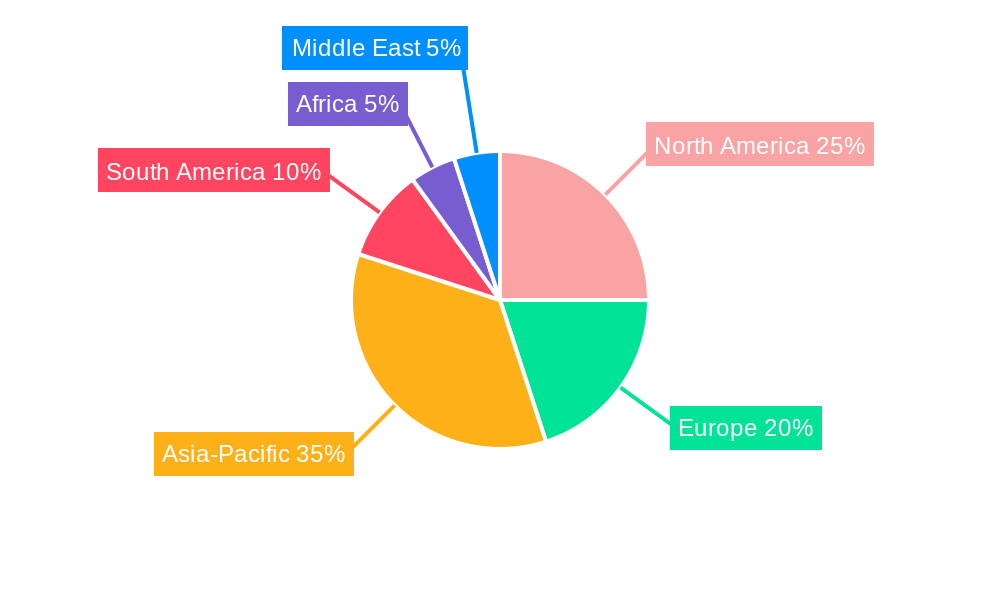
Dominant Regions, Countries, or Segments in Soluble Fertilizer
The North American and European markets currently dominate the soluble fertilizer landscape, driven by high agricultural output, advanced farming techniques, and established distribution networks. However, Asia-Pacific is poised for significant growth due to rapid agricultural expansion, rising incomes, and government support for agricultural modernization. Key drivers include favorable economic policies incentivizing fertilizer adoption, investments in agricultural infrastructure, and increasing awareness of improved nutrient management practices.
- North America: High adoption of advanced farming techniques and established distribution network.
- Europe: Stringent environmental regulations driving demand for efficient and environmentally friendly products.
- Asia-Pacific: Rapid agricultural expansion and rising incomes fueling market growth.
- South America: Growing demand from large-scale agricultural operations.
- Africa: Significant growth potential, but hampered by infrastructure limitations and access to technology.
Soluble Fertilizer Product Landscape
The soluble fertilizer market offers a diverse range of products tailored to specific crop needs and soil conditions. Innovations include controlled-release formulations that minimize nutrient loss and optimize plant uptake, as well as products enriched with micronutrients for enhanced crop yields. These advancements offer unique selling propositions such as improved nutrient use efficiency, reduced environmental impact, and enhanced crop quality.
Key Drivers, Barriers & Challenges in Soluble Fertilizer
Key Drivers:
- Increasing global food demand.
- Rising adoption of intensive agricultural practices.
- Technological advancements in fertilizer application.
- Government support for agricultural modernization.
Key Challenges & Restraints:
- Fluctuating raw material prices impacting production costs.
- Stringent environmental regulations.
- Competition from alternative fertilizers.
- Supply chain disruptions (quantifiable impact: xx% reduction in supply during xx).
Emerging Opportunities in Soluble Fertilizer
- Growing demand for organic and bio-based soluble fertilizers.
- Expanding application in hydroponics and vertical farming.
- Development of precision application technologies.
- Untapped markets in developing economies.
Growth Accelerators in the Soluble Fertilizer Industry
Strategic partnerships between fertilizer producers and agricultural technology companies are driving innovation and market expansion. Technological breakthroughs in controlled-release and nutrient management systems are enhancing fertilizer efficiency and reducing environmental impact. Market expansion into developing economies, particularly in Africa and Asia, presents substantial growth opportunities.
Key Players Shaping the Soluble Fertilizer Market
- Haifa Chemicals
- Yara
- Arab Potash Company
- Omex
- Everris
- Bunge
- SQM
- UralChem
- ICL Fertilizers
- Sinclair
- Grow More
- EuroChem Group
- Mosaicco
- Nutrite
- Aries Agro
- Lemagro NV
- Dongbu Farm Hannong
- Stanley
- Hebei Monbang
- CNAMPGC Holding
- Hanfeng
- Batian
- Kingenta
- Sichuan Guoguang Agrochemical
- Beijing Jinggeng Tianxia Agricultural Science and Technology
- Strongwill group
Notable Milestones in Soluble Fertilizer Sector
- 2021: Launch of a new controlled-release fertilizer by Haifa Chemicals.
- 2022: Merger between two major soluble fertilizer producers in Europe (xx million units deal value).
- 2023: Introduction of a precision application technology by Yara.
In-Depth Soluble Fertilizer Market Outlook
The soluble fertilizer market is poised for sustained growth driven by technological innovation, increasing global food demand, and expanding agricultural intensification. Strategic investments in research and development, strategic partnerships, and market expansion initiatives will be crucial for success in this dynamic and competitive market. The focus on sustainable and environmentally friendly practices will shape future product development and market dynamics.
Soluble Fertilizer Segmentation
-
1. Application
- 1.1. Horticulture
- 1.2. Crop
- 1.3. Others
-
2. Type
- 2.1. NPK Water-Soluble
- 2.2. Humic Acid Water-Soluble
- 2.3. Amino Acid Water-Soluble
- 2.4. Others
Soluble Fertilizer Segmentation By Geography
-
1. North America
- 1.1. United States
- 1.2. Canada
- 1.3. Mexico
-
2. South America
- 2.1. Brazil
- 2.2. Argentina
- 2.3. Rest of South America
-
3. Europe
- 3.1. United Kingdom
- 3.2. Germany
- 3.3. France
- 3.4. Italy
- 3.5. Spain
- 3.6. Russia
- 3.7. Benelux
- 3.8. Nordics
- 3.9. Rest of Europe
-
4. Middle East & Africa
- 4.1. Turkey
- 4.2. Israel
- 4.3. GCC
- 4.4. North Africa
- 4.5. South Africa
- 4.6. Rest of Middle East & Africa
-
5. Asia Pacific
- 5.1. China
- 5.2. India
- 5.3. Japan
- 5.4. South Korea
- 5.5. ASEAN
- 5.6. Oceania
- 5.7. Rest of Asia Pacific
Soluble Fertilizer Regional Market Share
Geographic Coverage of Soluble Fertilizer
Soluble Fertilizer REPORT HIGHLIGHTS
| Aspects | Details |
|---|---|
| Study Period | 2020-2034 |
| Base Year | 2025 |
| Estimated Year | 2026 |
| Forecast Period | 2026-2034 |
| Historical Period | 2020-2025 |
| Growth Rate | CAGR of 3% from 2020-2034 |
| Segmentation |
|
Table of Contents
- 1. Introduction
- 1.1. Research Scope
- 1.2. Market Segmentation
- 1.3. Research Methodology
- 1.4. Definitions and Assumptions
- 2. Executive Summary
- 2.1. Introduction
- 3. Market Dynamics
- 3.1. Introduction
- 3.2. Market Drivers
- 3.3. Market Restrains
- 3.4. Market Trends
- 4. Market Factor Analysis
- 4.1. Porters Five Forces
- 4.2. Supply/Value Chain
- 4.3. PESTEL analysis
- 4.4. Market Entropy
- 4.5. Patent/Trademark Analysis
- 5. Global Soluble Fertilizer Analysis, Insights and Forecast, 2020-2032
- 5.1. Market Analysis, Insights and Forecast - by Application
- 5.1.1. Horticulture
- 5.1.2. Crop
- 5.1.3. Others
- 5.2. Market Analysis, Insights and Forecast - by Type
- 5.2.1. NPK Water-Soluble
- 5.2.2. Humic Acid Water-Soluble
- 5.2.3. Amino Acid Water-Soluble
- 5.2.4. Others
- 5.3. Market Analysis, Insights and Forecast - by Region
- 5.3.1. North America
- 5.3.2. South America
- 5.3.3. Europe
- 5.3.4. Middle East & Africa
- 5.3.5. Asia Pacific
- 5.1. Market Analysis, Insights and Forecast - by Application
- 6. North America Soluble Fertilizer Analysis, Insights and Forecast, 2020-2032
- 6.1. Market Analysis, Insights and Forecast - by Application
- 6.1.1. Horticulture
- 6.1.2. Crop
- 6.1.3. Others
- 6.2. Market Analysis, Insights and Forecast - by Type
- 6.2.1. NPK Water-Soluble
- 6.2.2. Humic Acid Water-Soluble
- 6.2.3. Amino Acid Water-Soluble
- 6.2.4. Others
- 6.1. Market Analysis, Insights and Forecast - by Application
- 7. South America Soluble Fertilizer Analysis, Insights and Forecast, 2020-2032
- 7.1. Market Analysis, Insights and Forecast - by Application
- 7.1.1. Horticulture
- 7.1.2. Crop
- 7.1.3. Others
- 7.2. Market Analysis, Insights and Forecast - by Type
- 7.2.1. NPK Water-Soluble
- 7.2.2. Humic Acid Water-Soluble
- 7.2.3. Amino Acid Water-Soluble
- 7.2.4. Others
- 7.1. Market Analysis, Insights and Forecast - by Application
- 8. Europe Soluble Fertilizer Analysis, Insights and Forecast, 2020-2032
- 8.1. Market Analysis, Insights and Forecast - by Application
- 8.1.1. Horticulture
- 8.1.2. Crop
- 8.1.3. Others
- 8.2. Market Analysis, Insights and Forecast - by Type
- 8.2.1. NPK Water-Soluble
- 8.2.2. Humic Acid Water-Soluble
- 8.2.3. Amino Acid Water-Soluble
- 8.2.4. Others
- 8.1. Market Analysis, Insights and Forecast - by Application
- 9. Middle East & Africa Soluble Fertilizer Analysis, Insights and Forecast, 2020-2032
- 9.1. Market Analysis, Insights and Forecast - by Application
- 9.1.1. Horticulture
- 9.1.2. Crop
- 9.1.3. Others
- 9.2. Market Analysis, Insights and Forecast - by Type
- 9.2.1. NPK Water-Soluble
- 9.2.2. Humic Acid Water-Soluble
- 9.2.3. Amino Acid Water-Soluble
- 9.2.4. Others
- 9.1. Market Analysis, Insights and Forecast - by Application
- 10. Asia Pacific Soluble Fertilizer Analysis, Insights and Forecast, 2020-2032
- 10.1. Market Analysis, Insights and Forecast - by Application
- 10.1.1. Horticulture
- 10.1.2. Crop
- 10.1.3. Others
- 10.2. Market Analysis, Insights and Forecast - by Type
- 10.2.1. NPK Water-Soluble
- 10.2.2. Humic Acid Water-Soluble
- 10.2.3. Amino Acid Water-Soluble
- 10.2.4. Others
- 10.1. Market Analysis, Insights and Forecast - by Application
- 11. Competitive Analysis
- 11.1. Global Market Share Analysis 2025
- 11.2. Company Profiles
- 11.2.1 Haifa Chemicals
- 11.2.1.1. Overview
- 11.2.1.2. Products
- 11.2.1.3. SWOT Analysis
- 11.2.1.4. Recent Developments
- 11.2.1.5. Financials (Based on Availability)
- 11.2.2 Yara
- 11.2.2.1. Overview
- 11.2.2.2. Products
- 11.2.2.3. SWOT Analysis
- 11.2.2.4. Recent Developments
- 11.2.2.5. Financials (Based on Availability)
- 11.2.3 Arab Potash Company
- 11.2.3.1. Overview
- 11.2.3.2. Products
- 11.2.3.3. SWOT Analysis
- 11.2.3.4. Recent Developments
- 11.2.3.5. Financials (Based on Availability)
- 11.2.4 Omex
- 11.2.4.1. Overview
- 11.2.4.2. Products
- 11.2.4.3. SWOT Analysis
- 11.2.4.4. Recent Developments
- 11.2.4.5. Financials (Based on Availability)
- 11.2.5 Everris
- 11.2.5.1. Overview
- 11.2.5.2. Products
- 11.2.5.3. SWOT Analysis
- 11.2.5.4. Recent Developments
- 11.2.5.5. Financials (Based on Availability)
- 11.2.6 Bunge
- 11.2.6.1. Overview
- 11.2.6.2. Products
- 11.2.6.3. SWOT Analysis
- 11.2.6.4. Recent Developments
- 11.2.6.5. Financials (Based on Availability)
- 11.2.7 SQM
- 11.2.7.1. Overview
- 11.2.7.2. Products
- 11.2.7.3. SWOT Analysis
- 11.2.7.4. Recent Developments
- 11.2.7.5. Financials (Based on Availability)
- 11.2.8 UralChem
- 11.2.8.1. Overview
- 11.2.8.2. Products
- 11.2.8.3. SWOT Analysis
- 11.2.8.4. Recent Developments
- 11.2.8.5. Financials (Based on Availability)
- 11.2.9 ICL Fertilizers
- 11.2.9.1. Overview
- 11.2.9.2. Products
- 11.2.9.3. SWOT Analysis
- 11.2.9.4. Recent Developments
- 11.2.9.5. Financials (Based on Availability)
- 11.2.10 Sinclair
- 11.2.10.1. Overview
- 11.2.10.2. Products
- 11.2.10.3. SWOT Analysis
- 11.2.10.4. Recent Developments
- 11.2.10.5. Financials (Based on Availability)
- 11.2.11 Grow More
- 11.2.11.1. Overview
- 11.2.11.2. Products
- 11.2.11.3. SWOT Analysis
- 11.2.11.4. Recent Developments
- 11.2.11.5. Financials (Based on Availability)
- 11.2.12 EuroChem Group
- 11.2.12.1. Overview
- 11.2.12.2. Products
- 11.2.12.3. SWOT Analysis
- 11.2.12.4. Recent Developments
- 11.2.12.5. Financials (Based on Availability)
- 11.2.13 Mosaicco
- 11.2.13.1. Overview
- 11.2.13.2. Products
- 11.2.13.3. SWOT Analysis
- 11.2.13.4. Recent Developments
- 11.2.13.5. Financials (Based on Availability)
- 11.2.14 Nutrite
- 11.2.14.1. Overview
- 11.2.14.2. Products
- 11.2.14.3. SWOT Analysis
- 11.2.14.4. Recent Developments
- 11.2.14.5. Financials (Based on Availability)
- 11.2.15 Aries Agro
- 11.2.15.1. Overview
- 11.2.15.2. Products
- 11.2.15.3. SWOT Analysis
- 11.2.15.4. Recent Developments
- 11.2.15.5. Financials (Based on Availability)
- 11.2.16 LemagroNV
- 11.2.16.1. Overview
- 11.2.16.2. Products
- 11.2.16.3. SWOT Analysis
- 11.2.16.4. Recent Developments
- 11.2.16.5. Financials (Based on Availability)
- 11.2.17 Dongbu Farm Hannong
- 11.2.17.1. Overview
- 11.2.17.2. Products
- 11.2.17.3. SWOT Analysis
- 11.2.17.4. Recent Developments
- 11.2.17.5. Financials (Based on Availability)
- 11.2.18 Stanley
- 11.2.18.1. Overview
- 11.2.18.2. Products
- 11.2.18.3. SWOT Analysis
- 11.2.18.4. Recent Developments
- 11.2.18.5. Financials (Based on Availability)
- 11.2.19 Hebei Monbang
- 11.2.19.1. Overview
- 11.2.19.2. Products
- 11.2.19.3. SWOT Analysis
- 11.2.19.4. Recent Developments
- 11.2.19.5. Financials (Based on Availability)
- 11.2.20 CNAMPGC Holding
- 11.2.20.1. Overview
- 11.2.20.2. Products
- 11.2.20.3. SWOT Analysis
- 11.2.20.4. Recent Developments
- 11.2.20.5. Financials (Based on Availability)
- 11.2.21 Hanfeng
- 11.2.21.1. Overview
- 11.2.21.2. Products
- 11.2.21.3. SWOT Analysis
- 11.2.21.4. Recent Developments
- 11.2.21.5. Financials (Based on Availability)
- 11.2.22 Batian
- 11.2.22.1. Overview
- 11.2.22.2. Products
- 11.2.22.3. SWOT Analysis
- 11.2.22.4. Recent Developments
- 11.2.22.5. Financials (Based on Availability)
- 11.2.23 Kingenta
- 11.2.23.1. Overview
- 11.2.23.2. Products
- 11.2.23.3. SWOT Analysis
- 11.2.23.4. Recent Developments
- 11.2.23.5. Financials (Based on Availability)
- 11.2.24 Sichuan Guoguang Agrochemical
- 11.2.24.1. Overview
- 11.2.24.2. Products
- 11.2.24.3. SWOT Analysis
- 11.2.24.4. Recent Developments
- 11.2.24.5. Financials (Based on Availability)
- 11.2.25 Beijing Jinggeng Tianxia Agricultural Science and Technology
- 11.2.25.1. Overview
- 11.2.25.2. Products
- 11.2.25.3. SWOT Analysis
- 11.2.25.4. Recent Developments
- 11.2.25.5. Financials (Based on Availability)
- 11.2.26 Strongwill group
- 11.2.26.1. Overview
- 11.2.26.2. Products
- 11.2.26.3. SWOT Analysis
- 11.2.26.4. Recent Developments
- 11.2.26.5. Financials (Based on Availability)
- 11.2.1 Haifa Chemicals
List of Figures
- Figure 1: Global Soluble Fertilizer Revenue Breakdown (million, %) by Region 2025 & 2033
- Figure 2: North America Soluble Fertilizer Revenue (million), by Application 2025 & 2033
- Figure 3: North America Soluble Fertilizer Revenue Share (%), by Application 2025 & 2033
- Figure 4: North America Soluble Fertilizer Revenue (million), by Type 2025 & 2033
- Figure 5: North America Soluble Fertilizer Revenue Share (%), by Type 2025 & 2033
- Figure 6: North America Soluble Fertilizer Revenue (million), by Country 2025 & 2033
- Figure 7: North America Soluble Fertilizer Revenue Share (%), by Country 2025 & 2033
- Figure 8: South America Soluble Fertilizer Revenue (million), by Application 2025 & 2033
- Figure 9: South America Soluble Fertilizer Revenue Share (%), by Application 2025 & 2033
- Figure 10: South America Soluble Fertilizer Revenue (million), by Type 2025 & 2033
- Figure 11: South America Soluble Fertilizer Revenue Share (%), by Type 2025 & 2033
- Figure 12: South America Soluble Fertilizer Revenue (million), by Country 2025 & 2033
- Figure 13: South America Soluble Fertilizer Revenue Share (%), by Country 2025 & 2033
- Figure 14: Europe Soluble Fertilizer Revenue (million), by Application 2025 & 2033
- Figure 15: Europe Soluble Fertilizer Revenue Share (%), by Application 2025 & 2033
- Figure 16: Europe Soluble Fertilizer Revenue (million), by Type 2025 & 2033
- Figure 17: Europe Soluble Fertilizer Revenue Share (%), by Type 2025 & 2033
- Figure 18: Europe Soluble Fertilizer Revenue (million), by Country 2025 & 2033
- Figure 19: Europe Soluble Fertilizer Revenue Share (%), by Country 2025 & 2033
- Figure 20: Middle East & Africa Soluble Fertilizer Revenue (million), by Application 2025 & 2033
- Figure 21: Middle East & Africa Soluble Fertilizer Revenue Share (%), by Application 2025 & 2033
- Figure 22: Middle East & Africa Soluble Fertilizer Revenue (million), by Type 2025 & 2033
- Figure 23: Middle East & Africa Soluble Fertilizer Revenue Share (%), by Type 2025 & 2033
- Figure 24: Middle East & Africa Soluble Fertilizer Revenue (million), by Country 2025 & 2033
- Figure 25: Middle East & Africa Soluble Fertilizer Revenue Share (%), by Country 2025 & 2033
- Figure 26: Asia Pacific Soluble Fertilizer Revenue (million), by Application 2025 & 2033
- Figure 27: Asia Pacific Soluble Fertilizer Revenue Share (%), by Application 2025 & 2033
- Figure 28: Asia Pacific Soluble Fertilizer Revenue (million), by Type 2025 & 2033
- Figure 29: Asia Pacific Soluble Fertilizer Revenue Share (%), by Type 2025 & 2033
- Figure 30: Asia Pacific Soluble Fertilizer Revenue (million), by Country 2025 & 2033
- Figure 31: Asia Pacific Soluble Fertilizer Revenue Share (%), by Country 2025 & 2033
List of Tables
- Table 1: Global Soluble Fertilizer Revenue million Forecast, by Application 2020 & 2033
- Table 2: Global Soluble Fertilizer Revenue million Forecast, by Type 2020 & 2033
- Table 3: Global Soluble Fertilizer Revenue million Forecast, by Region 2020 & 2033
- Table 4: Global Soluble Fertilizer Revenue million Forecast, by Application 2020 & 2033
- Table 5: Global Soluble Fertilizer Revenue million Forecast, by Type 2020 & 2033
- Table 6: Global Soluble Fertilizer Revenue million Forecast, by Country 2020 & 2033
- Table 7: United States Soluble Fertilizer Revenue (million) Forecast, by Application 2020 & 2033
- Table 8: Canada Soluble Fertilizer Revenue (million) Forecast, by Application 2020 & 2033
- Table 9: Mexico Soluble Fertilizer Revenue (million) Forecast, by Application 2020 & 2033
- Table 10: Global Soluble Fertilizer Revenue million Forecast, by Application 2020 & 2033
- Table 11: Global Soluble Fertilizer Revenue million Forecast, by Type 2020 & 2033
- Table 12: Global Soluble Fertilizer Revenue million Forecast, by Country 2020 & 2033
- Table 13: Brazil Soluble Fertilizer Revenue (million) Forecast, by Application 2020 & 2033
- Table 14: Argentina Soluble Fertilizer Revenue (million) Forecast, by Application 2020 & 2033
- Table 15: Rest of South America Soluble Fertilizer Revenue (million) Forecast, by Application 2020 & 2033
- Table 16: Global Soluble Fertilizer Revenue million Forecast, by Application 2020 & 2033
- Table 17: Global Soluble Fertilizer Revenue million Forecast, by Type 2020 & 2033
- Table 18: Global Soluble Fertilizer Revenue million Forecast, by Country 2020 & 2033
- Table 19: United Kingdom Soluble Fertilizer Revenue (million) Forecast, by Application 2020 & 2033
- Table 20: Germany Soluble Fertilizer Revenue (million) Forecast, by Application 2020 & 2033
- Table 21: France Soluble Fertilizer Revenue (million) Forecast, by Application 2020 & 2033
- Table 22: Italy Soluble Fertilizer Revenue (million) Forecast, by Application 2020 & 2033
- Table 23: Spain Soluble Fertilizer Revenue (million) Forecast, by Application 2020 & 2033
- Table 24: Russia Soluble Fertilizer Revenue (million) Forecast, by Application 2020 & 2033
- Table 25: Benelux Soluble Fertilizer Revenue (million) Forecast, by Application 2020 & 2033
- Table 26: Nordics Soluble Fertilizer Revenue (million) Forecast, by Application 2020 & 2033
- Table 27: Rest of Europe Soluble Fertilizer Revenue (million) Forecast, by Application 2020 & 2033
- Table 28: Global Soluble Fertilizer Revenue million Forecast, by Application 2020 & 2033
- Table 29: Global Soluble Fertilizer Revenue million Forecast, by Type 2020 & 2033
- Table 30: Global Soluble Fertilizer Revenue million Forecast, by Country 2020 & 2033
- Table 31: Turkey Soluble Fertilizer Revenue (million) Forecast, by Application 2020 & 2033
- Table 32: Israel Soluble Fertilizer Revenue (million) Forecast, by Application 2020 & 2033
- Table 33: GCC Soluble Fertilizer Revenue (million) Forecast, by Application 2020 & 2033
- Table 34: North Africa Soluble Fertilizer Revenue (million) Forecast, by Application 2020 & 2033
- Table 35: South Africa Soluble Fertilizer Revenue (million) Forecast, by Application 2020 & 2033
- Table 36: Rest of Middle East & Africa Soluble Fertilizer Revenue (million) Forecast, by Application 2020 & 2033
- Table 37: Global Soluble Fertilizer Revenue million Forecast, by Application 2020 & 2033
- Table 38: Global Soluble Fertilizer Revenue million Forecast, by Type 2020 & 2033
- Table 39: Global Soluble Fertilizer Revenue million Forecast, by Country 2020 & 2033
- Table 40: China Soluble Fertilizer Revenue (million) Forecast, by Application 2020 & 2033
- Table 41: India Soluble Fertilizer Revenue (million) Forecast, by Application 2020 & 2033
- Table 42: Japan Soluble Fertilizer Revenue (million) Forecast, by Application 2020 & 2033
- Table 43: South Korea Soluble Fertilizer Revenue (million) Forecast, by Application 2020 & 2033
- Table 44: ASEAN Soluble Fertilizer Revenue (million) Forecast, by Application 2020 & 2033
- Table 45: Oceania Soluble Fertilizer Revenue (million) Forecast, by Application 2020 & 2033
- Table 46: Rest of Asia Pacific Soluble Fertilizer Revenue (million) Forecast, by Application 2020 & 2033
Frequently Asked Questions
1. What is the projected Compound Annual Growth Rate (CAGR) of the Soluble Fertilizer?
The projected CAGR is approximately 3%.
2. Which companies are prominent players in the Soluble Fertilizer?
Key companies in the market include Haifa Chemicals, Yara, Arab Potash Company, Omex, Everris, Bunge, SQM, UralChem, ICL Fertilizers, Sinclair, Grow More, EuroChem Group, Mosaicco, Nutrite, Aries Agro, LemagroNV, Dongbu Farm Hannong, Stanley, Hebei Monbang, CNAMPGC Holding, Hanfeng, Batian, Kingenta, Sichuan Guoguang Agrochemical, Beijing Jinggeng Tianxia Agricultural Science and Technology, Strongwill group.
3. What are the main segments of the Soluble Fertilizer?
The market segments include Application, Type.
4. Can you provide details about the market size?
The market size is estimated to be USD 18190 million as of 2022.
5. What are some drivers contributing to market growth?
N/A
6. What are the notable trends driving market growth?
N/A
7. Are there any restraints impacting market growth?
N/A
8. Can you provide examples of recent developments in the market?
N/A
9. What pricing options are available for accessing the report?
Pricing options include single-user, multi-user, and enterprise licenses priced at USD 5900.00, USD 8850.00, and USD 11800.00 respectively.
10. Is the market size provided in terms of value or volume?
The market size is provided in terms of value, measured in million.
11. Are there any specific market keywords associated with the report?
Yes, the market keyword associated with the report is "Soluble Fertilizer," which aids in identifying and referencing the specific market segment covered.
12. How do I determine which pricing option suits my needs best?
The pricing options vary based on user requirements and access needs. Individual users may opt for single-user licenses, while businesses requiring broader access may choose multi-user or enterprise licenses for cost-effective access to the report.
13. Are there any additional resources or data provided in the Soluble Fertilizer report?
While the report offers comprehensive insights, it's advisable to review the specific contents or supplementary materials provided to ascertain if additional resources or data are available.
14. How can I stay updated on further developments or reports in the Soluble Fertilizer?
To stay informed about further developments, trends, and reports in the Soluble Fertilizer, consider subscribing to industry newsletters, following relevant companies and organizations, or regularly checking reputable industry news sources and publications.
Methodology
Step 1 - Identification of Relevant Samples Size from Population Database


Step 2 - Approaches for Defining Global Market Size (Value, Volume* & Price*)

Note*: In applicable scenarios
Step 3 - Data Sources
Primary Research
- Web Analytics
- Survey Reports
- Research Institute
- Latest Research Reports
- Opinion Leaders
Secondary Research
- Annual Reports
- White Paper
- Latest Press Release
- Industry Association
- Paid Database
- Investor Presentations

Step 4 - Data Triangulation
Involves using different sources of information in order to increase the validity of a study
These sources are likely to be stakeholders in a program - participants, other researchers, program staff, other community members, and so on.
Then we put all data in single framework & apply various statistical tools to find out the dynamic on the market.
During the analysis stage, feedback from the stakeholder groups would be compared to determine areas of agreement as well as areas of divergence