

Key Insights
The global tubular turbine market is poised for significant expansion, propelled by the escalating demand for renewable energy and the inherent advantages of tubular turbines in low-head hydropower scenarios. The market, valued at $33.2 billion in 2025, is forecast to achieve a Compound Annual Growth Rate (CAGR) of 11.73% between 2025 and 2033. This projected growth trajectory is underpinned by supportive government initiatives for renewable energy adoption, technological advancements enhancing turbine efficiency and cost-effectiveness, and a global imperative for sustainable energy solutions. Key applications span small-scale hydropower, off-grid power generation, and irrigation systems. The increasing requirement for decentralized energy in remote regions further fuels market expansion. While initial investment costs and specialized installation expertise present challenges, continuous technological innovation and declining component prices are mitigating these hurdles.
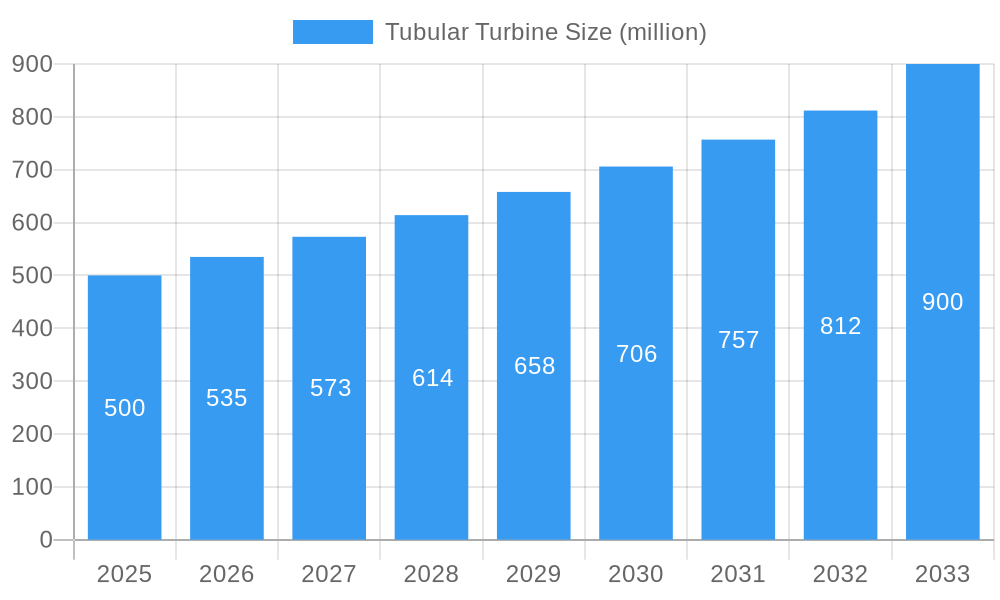
Tubular Turbine Market Size (In Billion)
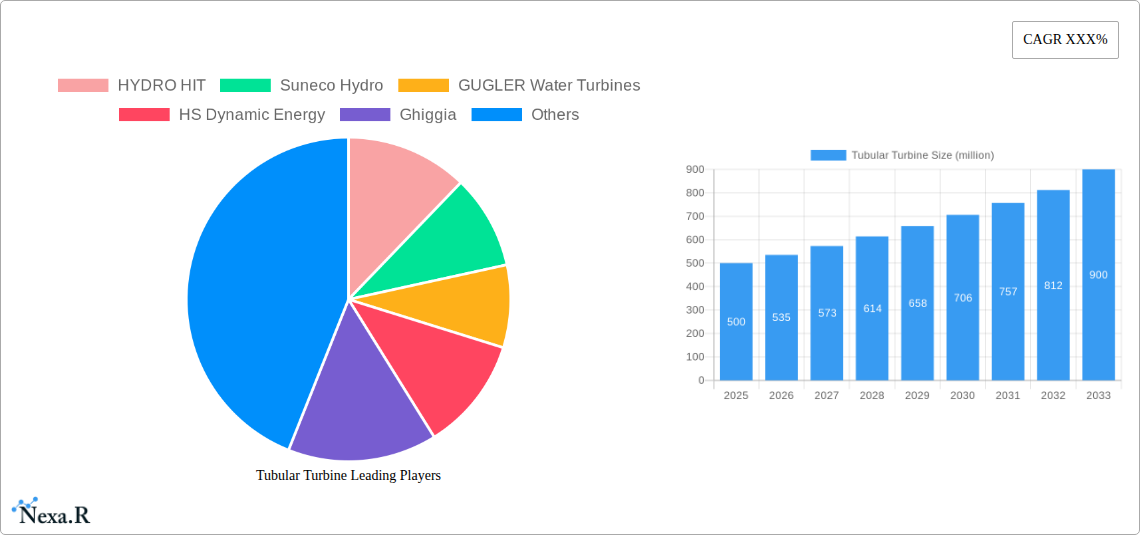
The competitive environment features established industry leaders alongside innovative startups, with prominent companies like HYDRO HIT, Suneco Hydro, and GUGLER Water Turbines holding substantial market positions. Emerging specialized firms are also increasing their participation, particularly in regions rich with low-head hydropower potential. Geographic expansion, especially in Asia-Pacific and South America, represents a crucial growth avenue, driven by favorable policies and untapped hydropower resources. Future market dynamics will be shaped by innovations in materials science and design optimization, leading to more efficient and competitive tubular turbines. Sustained research and development efforts are vital for broadening the application of this technology, thereby supporting the global transition to cleaner energy.
Tubular Turbine Company Market Share
Tubular Turbine Market Report: 2019-2033
This comprehensive report provides an in-depth analysis of the global tubular turbine market, encompassing market dynamics, growth trends, regional dominance, product landscape, key players, and future outlook. The study period covers 2019-2033, with a base year of 2025 and a forecast period of 2025-2033. This report is invaluable for industry professionals, investors, and strategic decision-makers seeking to understand and capitalize on opportunities within this dynamic sector. The report utilizes data from various sources to present a complete picture of the global tubular turbine market. Market size values are presented in millions of units.
Tubular Turbine Market Dynamics & Structure
The global tubular turbine market is characterized by moderate concentration, with key players like HYDRO HIT, Suneco Hydro, and GUGLER Water Turbines holding significant market share (xx%). Technological innovation, driven by advancements in material science and design optimization, is a key growth driver. Stringent environmental regulations, promoting renewable energy adoption, further fuel market expansion. Competitive substitutes, such as traditional turbines, pose a challenge, necessitating continuous innovation to maintain competitiveness. The end-user demographic primarily comprises hydropower plants and small-scale renewable energy projects. M&A activity within the sector has been moderate (xx deals in the last 5 years), indicating consolidation and strategic expansion amongst key players.
- Market Concentration: Moderately concentrated, with top 5 players holding xx% market share.
- Technological Innovation: Focus on efficiency improvements, material advancements, and digital integration.
- Regulatory Framework: Stringent environmental regulations drive market growth.
- Competitive Substitutes: Traditional turbines pose a significant competitive threat.
- End-User Demographics: Primarily hydropower plants and small-scale renewable energy projects.
- M&A Trends: Moderate M&A activity, indicating industry consolidation.
Tubular Turbine Growth Trends & Insights
The tubular turbine market experienced robust growth during the historical period (2019-2024), with a CAGR of xx%. This growth is attributed to increasing demand for renewable energy sources, coupled with technological advancements leading to higher efficiency and lower costs. Market penetration is currently at xx%, with significant untapped potential in developing economies. Technological disruptions, such as the integration of IoT and AI for predictive maintenance, are further driving market expansion. Consumer behavior is shifting towards environmentally friendly and sustainable energy solutions, favoring the adoption of tubular turbines. The forecast period (2025-2033) projects continued growth, driven by these factors, leading to an estimated market size of xx million units by 2033. The CAGR during the forecast period is predicted to be xx%.
Dominant Regions, Countries, or Segments in Tubular Turbine
The Asia-Pacific region currently dominates the tubular turbine market, driven by robust economic growth, expanding infrastructure projects, and supportive government policies promoting renewable energy sources. Countries like China and India are major contributors, owing to their substantial hydropower potential and ambitious renewable energy targets. Europe also holds a significant market share, fueled by stringent environmental regulations and the increasing adoption of sustainable energy practices. North America shows steady growth, driven by government incentives and technological advancements.
- Key Drivers in Asia-Pacific: Strong economic growth, expanding infrastructure, supportive government policies.
- Key Drivers in Europe: Stringent environmental regulations, focus on sustainable energy.
- Key Drivers in North America: Government incentives, technological advancements.
- Market Share: Asia-Pacific (xx%), Europe (xx%), North America (xx%).
- Growth Potential: High growth potential in developing economies.
Tubular Turbine Product Landscape
Tubular turbines are characterized by their compact design, high efficiency, and suitability for various flow conditions. Recent innovations focus on improving energy conversion efficiency through advanced materials and optimized blade designs. Applications span diverse sectors, including hydropower generation, irrigation systems, and industrial water management. Performance metrics, such as power output, rotational speed, and lifespan, are key differentiators. Unique selling propositions include low maintenance requirements, robust construction, and minimal environmental impact.
Key Drivers, Barriers & Challenges in Tubular Turbine
Key Drivers: The increasing demand for renewable energy, government incentives, and technological advancements in design and efficiency are driving market growth. Furthermore, the suitability of tubular turbines for various flow conditions and their compact size makes them attractive for diverse applications.
Key Challenges: High initial investment costs, complex installation procedures, and potential supply chain disruptions related to specific components can hinder market penetration. Additionally, competition from established turbine technologies and regulatory uncertainties in some regions pose challenges.
Emerging Opportunities in Tubular Turbine
Untapped markets in developing countries, particularly in Africa and South America, present significant growth opportunities. Innovative applications, such as micro-hydropower systems for rural electrification and off-grid energy solutions, are gaining traction. The integration of smart technologies, such as IoT sensors and predictive maintenance algorithms, further enhances the value proposition of tubular turbines, leading to increased efficiency and reduced operational costs.
Growth Accelerators in the Tubular Turbine Industry
Technological breakthroughs in materials science, leading to enhanced durability and efficiency, are key catalysts for long-term growth. Strategic partnerships between turbine manufacturers and energy developers facilitate market penetration and large-scale project implementation. Expanding into new geographical markets and diversifying applications will accelerate market expansion. Government initiatives promoting renewable energy adoption, providing financial incentives, and streamlining regulatory processes are vital growth drivers.
Key Players Shaping the Tubular Turbine Market
- HYDRO HIT
- Suneco Hydro
- GUGLER Water Turbines
- HS Dynamic Energy
- Ghiggia
- Flexienergy
- Hydrocraft
- Chengdu Forster Technology
- Shenyang Getai Hydropower Equipment
- Changsha Strong Electromechanical Technology
- BOCHI
- Chongqing Savvy Industries
- Zhejiang Jinlun Electromechanic
- Hunan Sunny Hydropower Equipment Corporation
Notable Milestones in Tubular Turbine Sector
- 2021: HYDRO HIT launched a new high-efficiency tubular turbine model.
- 2022: Suneco Hydro announced a strategic partnership with a major energy developer.
- 2023: GUGLER Water Turbines secured a significant contract for a large-scale hydropower project.
- 2024: Significant investment in R&D of tubular turbines by multiple companies. (Further milestones will be detailed in the full report.)
In-Depth Tubular Turbine Market Outlook
The tubular turbine market is poised for continued strong growth, driven by the global shift towards renewable energy, ongoing technological advancements, and increasing government support. Strategic opportunities lie in expanding into emerging markets, developing innovative applications, and fostering strategic partnerships to accelerate market penetration. The market's future potential is significant, presenting attractive investment opportunities for stakeholders across the value chain.
Tubular Turbine Segmentation
-
1. Application
- 1.1. undefined
-
2. Type
- 2.1. undefined
Tubular Turbine Segmentation By Geography
- 1. undefined
- 2. undefined
- 3. undefined
- 4. undefined
- 5. undefined
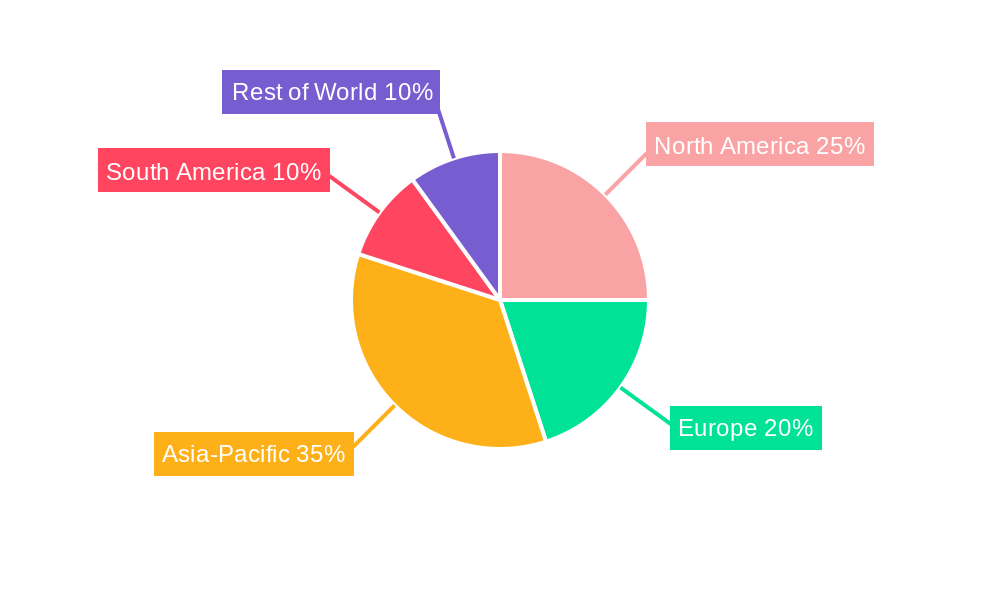
Tubular Turbine Regional Market Share
Geographic Coverage of Tubular Turbine
Tubular Turbine REPORT HIGHLIGHTS
| Aspects | Details |
|---|---|
| Study Period | 2020-2034 |
| Base Year | 2025 |
| Estimated Year | 2026 |
| Forecast Period | 2026-2034 |
| Historical Period | 2020-2025 |
| Growth Rate | CAGR of 11.73% from 2020-2034 |
| Segmentation |
|
Table of Contents
- 1. Introduction
- 1.1. Research Scope
- 1.2. Market Segmentation
- 1.3. Research Methodology
- 1.4. Definitions and Assumptions
- 2. Executive Summary
- 2.1. Introduction
- 3. Market Dynamics
- 3.1. Introduction
- 3.2. Market Drivers
- 3.3. Market Restrains
- 3.4. Market Trends
- 4. Market Factor Analysis
- 4.1. Porters Five Forces
- 4.2. Supply/Value Chain
- 4.3. PESTEL analysis
- 4.4. Market Entropy
- 4.5. Patent/Trademark Analysis
- 5. Global Tubular Turbine Analysis, Insights and Forecast, 2020-2032
- 5.1. Market Analysis, Insights and Forecast - by Application
- 5.1.1.
- 5.2. Market Analysis, Insights and Forecast - by Type
- 5.2.1.
- 5.3. Market Analysis, Insights and Forecast - by Region
- 5.3.1.
- 5.3.2.
- 5.3.3.
- 5.3.4.
- 5.3.5.
- 5.1. Market Analysis, Insights and Forecast - by Application
- 6. undefined Tubular Turbine Analysis, Insights and Forecast, 2020-2032
- 6.1. Market Analysis, Insights and Forecast - by Application
- 6.1.1.
- 6.2. Market Analysis, Insights and Forecast - by Type
- 6.2.1.
- 6.1. Market Analysis, Insights and Forecast - by Application
- 7. undefined Tubular Turbine Analysis, Insights and Forecast, 2020-2032
- 7.1. Market Analysis, Insights and Forecast - by Application
- 7.1.1.
- 7.2. Market Analysis, Insights and Forecast - by Type
- 7.2.1.
- 7.1. Market Analysis, Insights and Forecast - by Application
- 8. undefined Tubular Turbine Analysis, Insights and Forecast, 2020-2032
- 8.1. Market Analysis, Insights and Forecast - by Application
- 8.1.1.
- 8.2. Market Analysis, Insights and Forecast - by Type
- 8.2.1.
- 8.1. Market Analysis, Insights and Forecast - by Application
- 9. undefined Tubular Turbine Analysis, Insights and Forecast, 2020-2032
- 9.1. Market Analysis, Insights and Forecast - by Application
- 9.1.1.
- 9.2. Market Analysis, Insights and Forecast - by Type
- 9.2.1.
- 9.1. Market Analysis, Insights and Forecast - by Application
- 10. undefined Tubular Turbine Analysis, Insights and Forecast, 2020-2032
- 10.1. Market Analysis, Insights and Forecast - by Application
- 10.1.1.
- 10.2. Market Analysis, Insights and Forecast - by Type
- 10.2.1.
- 10.1. Market Analysis, Insights and Forecast - by Application
- 11. Competitive Analysis
- 11.1. Global Market Share Analysis 2025
- 11.2. Company Profiles
- 11.2.1 HYDRO HIT
- 11.2.1.1. Overview
- 11.2.1.2. Products
- 11.2.1.3. SWOT Analysis
- 11.2.1.4. Recent Developments
- 11.2.1.5. Financials (Based on Availability)
- 11.2.2 Suneco Hydro
- 11.2.2.1. Overview
- 11.2.2.2. Products
- 11.2.2.3. SWOT Analysis
- 11.2.2.4. Recent Developments
- 11.2.2.5. Financials (Based on Availability)
- 11.2.3 GUGLER Water Turbines
- 11.2.3.1. Overview
- 11.2.3.2. Products
- 11.2.3.3. SWOT Analysis
- 11.2.3.4. Recent Developments
- 11.2.3.5. Financials (Based on Availability)
- 11.2.4 HS Dynamic Energy
- 11.2.4.1. Overview
- 11.2.4.2. Products
- 11.2.4.3. SWOT Analysis
- 11.2.4.4. Recent Developments
- 11.2.4.5. Financials (Based on Availability)
- 11.2.5 Ghiggia
- 11.2.5.1. Overview
- 11.2.5.2. Products
- 11.2.5.3. SWOT Analysis
- 11.2.5.4. Recent Developments
- 11.2.5.5. Financials (Based on Availability)
- 11.2.6 Flexienergy
- 11.2.6.1. Overview
- 11.2.6.2. Products
- 11.2.6.3. SWOT Analysis
- 11.2.6.4. Recent Developments
- 11.2.6.5. Financials (Based on Availability)
- 11.2.7 Hydrocraft
- 11.2.7.1. Overview
- 11.2.7.2. Products
- 11.2.7.3. SWOT Analysis
- 11.2.7.4. Recent Developments
- 11.2.7.5. Financials (Based on Availability)
- 11.2.8 Chengdu Forster Technology
- 11.2.8.1. Overview
- 11.2.8.2. Products
- 11.2.8.3. SWOT Analysis
- 11.2.8.4. Recent Developments
- 11.2.8.5. Financials (Based on Availability)
- 11.2.9 Shenyang Getai Hydropower Equipment
- 11.2.9.1. Overview
- 11.2.9.2. Products
- 11.2.9.3. SWOT Analysis
- 11.2.9.4. Recent Developments
- 11.2.9.5. Financials (Based on Availability)
- 11.2.10 Changsha Strong Electromechanical Technology
- 11.2.10.1. Overview
- 11.2.10.2. Products
- 11.2.10.3. SWOT Analysis
- 11.2.10.4. Recent Developments
- 11.2.10.5. Financials (Based on Availability)
- 11.2.11 BOCHI
- 11.2.11.1. Overview
- 11.2.11.2. Products
- 11.2.11.3. SWOT Analysis
- 11.2.11.4. Recent Developments
- 11.2.11.5. Financials (Based on Availability)
- 11.2.12 Chongqing Savvy Industries
- 11.2.12.1. Overview
- 11.2.12.2. Products
- 11.2.12.3. SWOT Analysis
- 11.2.12.4. Recent Developments
- 11.2.12.5. Financials (Based on Availability)
- 11.2.13 Zhejiang Jinlun Electromechanic
- 11.2.13.1. Overview
- 11.2.13.2. Products
- 11.2.13.3. SWOT Analysis
- 11.2.13.4. Recent Developments
- 11.2.13.5. Financials (Based on Availability)
- 11.2.14 Hunan Sunny Hydropower Equipment Corporation
- 11.2.14.1. Overview
- 11.2.14.2. Products
- 11.2.14.3. SWOT Analysis
- 11.2.14.4. Recent Developments
- 11.2.14.5. Financials (Based on Availability)
- 11.2.1 HYDRO HIT
List of Figures
- Figure 1: Global Tubular Turbine Revenue Breakdown (billion, %) by Region 2025 & 2033
- Figure 2: Global Tubular Turbine Volume Breakdown (K, %) by Region 2025 & 2033
- Figure 3: undefined Tubular Turbine Revenue (billion), by Application 2025 & 2033
- Figure 4: undefined Tubular Turbine Volume (K), by Application 2025 & 2033
- Figure 5: undefined Tubular Turbine Revenue Share (%), by Application 2025 & 2033
- Figure 6: undefined Tubular Turbine Volume Share (%), by Application 2025 & 2033
- Figure 7: undefined Tubular Turbine Revenue (billion), by Type 2025 & 2033
- Figure 8: undefined Tubular Turbine Volume (K), by Type 2025 & 2033
- Figure 9: undefined Tubular Turbine Revenue Share (%), by Type 2025 & 2033
- Figure 10: undefined Tubular Turbine Volume Share (%), by Type 2025 & 2033
- Figure 11: undefined Tubular Turbine Revenue (billion), by Country 2025 & 2033
- Figure 12: undefined Tubular Turbine Volume (K), by Country 2025 & 2033
- Figure 13: undefined Tubular Turbine Revenue Share (%), by Country 2025 & 2033
- Figure 14: undefined Tubular Turbine Volume Share (%), by Country 2025 & 2033
- Figure 15: undefined Tubular Turbine Revenue (billion), by Application 2025 & 2033
- Figure 16: undefined Tubular Turbine Volume (K), by Application 2025 & 2033
- Figure 17: undefined Tubular Turbine Revenue Share (%), by Application 2025 & 2033
- Figure 18: undefined Tubular Turbine Volume Share (%), by Application 2025 & 2033
- Figure 19: undefined Tubular Turbine Revenue (billion), by Type 2025 & 2033
- Figure 20: undefined Tubular Turbine Volume (K), by Type 2025 & 2033
- Figure 21: undefined Tubular Turbine Revenue Share (%), by Type 2025 & 2033
- Figure 22: undefined Tubular Turbine Volume Share (%), by Type 2025 & 2033
- Figure 23: undefined Tubular Turbine Revenue (billion), by Country 2025 & 2033
- Figure 24: undefined Tubular Turbine Volume (K), by Country 2025 & 2033
- Figure 25: undefined Tubular Turbine Revenue Share (%), by Country 2025 & 2033
- Figure 26: undefined Tubular Turbine Volume Share (%), by Country 2025 & 2033
- Figure 27: undefined Tubular Turbine Revenue (billion), by Application 2025 & 2033
- Figure 28: undefined Tubular Turbine Volume (K), by Application 2025 & 2033
- Figure 29: undefined Tubular Turbine Revenue Share (%), by Application 2025 & 2033
- Figure 30: undefined Tubular Turbine Volume Share (%), by Application 2025 & 2033
- Figure 31: undefined Tubular Turbine Revenue (billion), by Type 2025 & 2033
- Figure 32: undefined Tubular Turbine Volume (K), by Type 2025 & 2033
- Figure 33: undefined Tubular Turbine Revenue Share (%), by Type 2025 & 2033
- Figure 34: undefined Tubular Turbine Volume Share (%), by Type 2025 & 2033
- Figure 35: undefined Tubular Turbine Revenue (billion), by Country 2025 & 2033
- Figure 36: undefined Tubular Turbine Volume (K), by Country 2025 & 2033
- Figure 37: undefined Tubular Turbine Revenue Share (%), by Country 2025 & 2033
- Figure 38: undefined Tubular Turbine Volume Share (%), by Country 2025 & 2033
- Figure 39: undefined Tubular Turbine Revenue (billion), by Application 2025 & 2033
- Figure 40: undefined Tubular Turbine Volume (K), by Application 2025 & 2033
- Figure 41: undefined Tubular Turbine Revenue Share (%), by Application 2025 & 2033
- Figure 42: undefined Tubular Turbine Volume Share (%), by Application 2025 & 2033
- Figure 43: undefined Tubular Turbine Revenue (billion), by Type 2025 & 2033
- Figure 44: undefined Tubular Turbine Volume (K), by Type 2025 & 2033
- Figure 45: undefined Tubular Turbine Revenue Share (%), by Type 2025 & 2033
- Figure 46: undefined Tubular Turbine Volume Share (%), by Type 2025 & 2033
- Figure 47: undefined Tubular Turbine Revenue (billion), by Country 2025 & 2033
- Figure 48: undefined Tubular Turbine Volume (K), by Country 2025 & 2033
- Figure 49: undefined Tubular Turbine Revenue Share (%), by Country 2025 & 2033
- Figure 50: undefined Tubular Turbine Volume Share (%), by Country 2025 & 2033
- Figure 51: undefined Tubular Turbine Revenue (billion), by Application 2025 & 2033
- Figure 52: undefined Tubular Turbine Volume (K), by Application 2025 & 2033
- Figure 53: undefined Tubular Turbine Revenue Share (%), by Application 2025 & 2033
- Figure 54: undefined Tubular Turbine Volume Share (%), by Application 2025 & 2033
- Figure 55: undefined Tubular Turbine Revenue (billion), by Type 2025 & 2033
- Figure 56: undefined Tubular Turbine Volume (K), by Type 2025 & 2033
- Figure 57: undefined Tubular Turbine Revenue Share (%), by Type 2025 & 2033
- Figure 58: undefined Tubular Turbine Volume Share (%), by Type 2025 & 2033
- Figure 59: undefined Tubular Turbine Revenue (billion), by Country 2025 & 2033
- Figure 60: undefined Tubular Turbine Volume (K), by Country 2025 & 2033
- Figure 61: undefined Tubular Turbine Revenue Share (%), by Country 2025 & 2033
- Figure 62: undefined Tubular Turbine Volume Share (%), by Country 2025 & 2033
List of Tables
- Table 1: Global Tubular Turbine Revenue billion Forecast, by Application 2020 & 2033
- Table 2: Global Tubular Turbine Volume K Forecast, by Application 2020 & 2033
- Table 3: Global Tubular Turbine Revenue billion Forecast, by Type 2020 & 2033
- Table 4: Global Tubular Turbine Volume K Forecast, by Type 2020 & 2033
- Table 5: Global Tubular Turbine Revenue billion Forecast, by Region 2020 & 2033
- Table 6: Global Tubular Turbine Volume K Forecast, by Region 2020 & 2033
- Table 7: Global Tubular Turbine Revenue billion Forecast, by Application 2020 & 2033
- Table 8: Global Tubular Turbine Volume K Forecast, by Application 2020 & 2033
- Table 9: Global Tubular Turbine Revenue billion Forecast, by Type 2020 & 2033
- Table 10: Global Tubular Turbine Volume K Forecast, by Type 2020 & 2033
- Table 11: Global Tubular Turbine Revenue billion Forecast, by Country 2020 & 2033
- Table 12: Global Tubular Turbine Volume K Forecast, by Country 2020 & 2033
- Table 13: Global Tubular Turbine Revenue billion Forecast, by Application 2020 & 2033
- Table 14: Global Tubular Turbine Volume K Forecast, by Application 2020 & 2033
- Table 15: Global Tubular Turbine Revenue billion Forecast, by Type 2020 & 2033
- Table 16: Global Tubular Turbine Volume K Forecast, by Type 2020 & 2033
- Table 17: Global Tubular Turbine Revenue billion Forecast, by Country 2020 & 2033
- Table 18: Global Tubular Turbine Volume K Forecast, by Country 2020 & 2033
- Table 19: Global Tubular Turbine Revenue billion Forecast, by Application 2020 & 2033
- Table 20: Global Tubular Turbine Volume K Forecast, by Application 2020 & 2033
- Table 21: Global Tubular Turbine Revenue billion Forecast, by Type 2020 & 2033
- Table 22: Global Tubular Turbine Volume K Forecast, by Type 2020 & 2033
- Table 23: Global Tubular Turbine Revenue billion Forecast, by Country 2020 & 2033
- Table 24: Global Tubular Turbine Volume K Forecast, by Country 2020 & 2033
- Table 25: Global Tubular Turbine Revenue billion Forecast, by Application 2020 & 2033
- Table 26: Global Tubular Turbine Volume K Forecast, by Application 2020 & 2033
- Table 27: Global Tubular Turbine Revenue billion Forecast, by Type 2020 & 2033
- Table 28: Global Tubular Turbine Volume K Forecast, by Type 2020 & 2033
- Table 29: Global Tubular Turbine Revenue billion Forecast, by Country 2020 & 2033
- Table 30: Global Tubular Turbine Volume K Forecast, by Country 2020 & 2033
- Table 31: Global Tubular Turbine Revenue billion Forecast, by Application 2020 & 2033
- Table 32: Global Tubular Turbine Volume K Forecast, by Application 2020 & 2033
- Table 33: Global Tubular Turbine Revenue billion Forecast, by Type 2020 & 2033
- Table 34: Global Tubular Turbine Volume K Forecast, by Type 2020 & 2033
- Table 35: Global Tubular Turbine Revenue billion Forecast, by Country 2020 & 2033
- Table 36: Global Tubular Turbine Volume K Forecast, by Country 2020 & 2033
Frequently Asked Questions
1. What is the projected Compound Annual Growth Rate (CAGR) of the Tubular Turbine?
The projected CAGR is approximately 11.73%.
2. Which companies are prominent players in the Tubular Turbine?
Key companies in the market include HYDRO HIT, Suneco Hydro, GUGLER Water Turbines, HS Dynamic Energy, Ghiggia, Flexienergy, Hydrocraft, Chengdu Forster Technology, Shenyang Getai Hydropower Equipment, Changsha Strong Electromechanical Technology, BOCHI, Chongqing Savvy Industries, Zhejiang Jinlun Electromechanic, Hunan Sunny Hydropower Equipment Corporation.
3. What are the main segments of the Tubular Turbine?
The market segments include Application, Type.
4. Can you provide details about the market size?
The market size is estimated to be USD 33.2 billion as of 2022.
5. What are some drivers contributing to market growth?
N/A
6. What are the notable trends driving market growth?
N/A
7. Are there any restraints impacting market growth?
N/A
8. Can you provide examples of recent developments in the market?
N/A
9. What pricing options are available for accessing the report?
Pricing options include single-user, multi-user, and enterprise licenses priced at USD 3950.00, USD 5925.00, and USD 7900.00 respectively.
10. Is the market size provided in terms of value or volume?
The market size is provided in terms of value, measured in billion and volume, measured in K.
11. Are there any specific market keywords associated with the report?
Yes, the market keyword associated with the report is "Tubular Turbine," which aids in identifying and referencing the specific market segment covered.
12. How do I determine which pricing option suits my needs best?
The pricing options vary based on user requirements and access needs. Individual users may opt for single-user licenses, while businesses requiring broader access may choose multi-user or enterprise licenses for cost-effective access to the report.
13. Are there any additional resources or data provided in the Tubular Turbine report?
While the report offers comprehensive insights, it's advisable to review the specific contents or supplementary materials provided to ascertain if additional resources or data are available.
14. How can I stay updated on further developments or reports in the Tubular Turbine?
To stay informed about further developments, trends, and reports in the Tubular Turbine, consider subscribing to industry newsletters, following relevant companies and organizations, or regularly checking reputable industry news sources and publications.
Methodology
Step 1 - Identification of Relevant Samples Size from Population Database


Step 2 - Approaches for Defining Global Market Size (Value, Volume* & Price*)

Note*: In applicable scenarios
Step 3 - Data Sources
Primary Research
- Web Analytics
- Survey Reports
- Research Institute
- Latest Research Reports
- Opinion Leaders
Secondary Research
- Annual Reports
- White Paper
- Latest Press Release
- Industry Association
- Paid Database
- Investor Presentations

Step 4 - Data Triangulation
Involves using different sources of information in order to increase the validity of a study
These sources are likely to be stakeholders in a program - participants, other researchers, program staff, other community members, and so on.
Then we put all data in single framework & apply various statistical tools to find out the dynamic on the market.
During the analysis stage, feedback from the stakeholder groups would be compared to determine areas of agreement as well as areas of divergence