

Key Insights
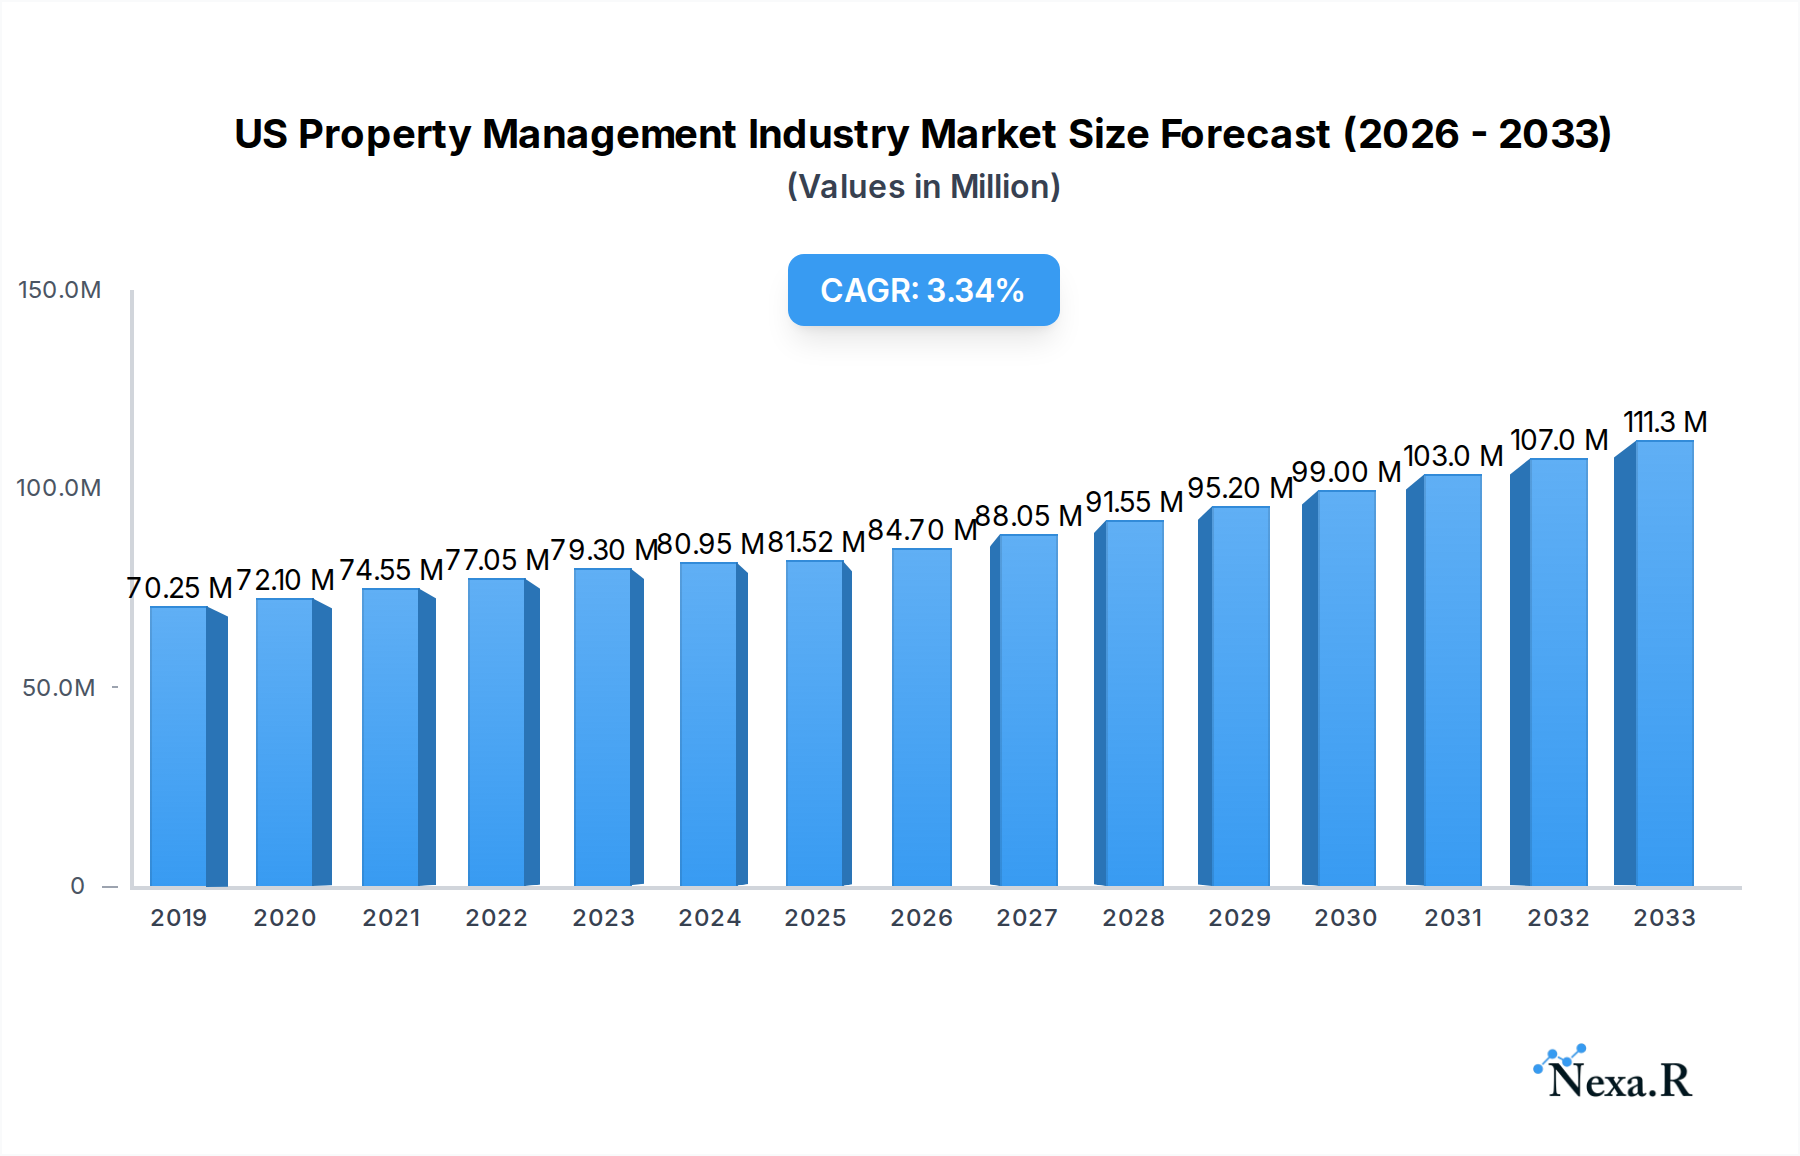
The US Property Management Industry is projected for substantial growth, currently valued at an estimated $81.52 million in 2025. This expansion is driven by a confluence of factors, including the increasing complexity of real estate portfolios, a growing demand for professional management services from both commercial and residential property owners, and the continuous need for efficient property maintenance and tenant services. The industry is experiencing a Compound Annual Growth Rate (CAGR) of 3.94%, indicating a steady and robust upward trajectory. Key segments like Commercial property management are expected to lead this growth due to the increasing outsourcing of management functions by large corporations and real estate investment trusts (REITs). Furthermore, advancements in property technology (PropTech) are revolutionizing how properties are managed, offering innovative solutions for marketing, tenant communication, and operational efficiency. This technological integration is not just a trend but a fundamental driver that will shape the future of property management, making it more data-driven and responsive to market demands.

US Property Management Industry Market Size (In Million)
The industry's evolution is also shaped by prevailing market dynamics, with property evaluation and tenant services emerging as crucial value propositions. As property owners seek to maximize returns and minimize vacancies, specialized services that enhance asset value and tenant satisfaction are in high demand. While the growth is encouraging, potential restraints such as evolving regulatory landscapes and the need for skilled labor to adapt to new technologies, will require strategic management from industry players. Despite these challenges, the overall outlook remains positive. The market is characterized by significant consolidation and competition among established players like CoStar Group, Jones Lang LaSalle, and CBRE, alongside a growing number of specialized firms. The North American region, particularly the United States, is anticipated to maintain its dominant position within the global property management market, fueled by a mature real estate sector and a proactive approach to adopting new management methodologies.
US Property Management Industry Company Market Share
US Property Management Industry: Market Analysis and Future Outlook (2019-2033)
This comprehensive report delivers an in-depth analysis of the US property management industry, encompassing market dynamics, growth trends, regional dominance, product landscape, key drivers, barriers, opportunities, and major players. Leveraging extensive data from 2019-2024 and a detailed forecast period of 2025-2033, with a base year of 2025, this study provides critical insights for industry professionals, investors, and stakeholders seeking to navigate this evolving sector. Explore the strategic maneuvers of key companies and the impact of recent industry developments on market trajectory.
US Property Management Industry Market Dynamics & Structure
The US property management market is characterized by a dynamic interplay of market concentration, technological innovation, and evolving regulatory frameworks. While dominated by a few large players, a significant portion of the market remains fragmented, presenting opportunities for specialized service providers and technology disruptors. Technological innovation, driven by the need for operational efficiency, enhanced tenant experiences, and data-driven decision-making, is a primary catalyst for market evolution. The adoption of AI-powered tools for predictive maintenance, automated leasing processes, and sophisticated tenant communication platforms is accelerating.
- Market Concentration: The parent market is moderately concentrated, with the top 5 companies holding approximately 35% of the total market share. The child market, particularly in specialized niches like student housing or short-term rentals, exhibits higher fragmentation.
- Technological Innovation Drivers: Increased demand for smart building technologies, property management software (PMS), IoT devices for monitoring, and data analytics platforms are key innovation drivers.
- Regulatory Frameworks: Stringent regulations regarding fair housing, data privacy (e.g., CCPA), and landlord-tenant laws influence operational strategies and compliance requirements.
- Competitive Product Substitutes: While direct substitutes are limited, advancements in DIY property management platforms and the rise of co-living spaces offer indirect competition.
- End-User Demographics: A significant shift towards urban living and a growing demand for flexible housing solutions are reshaping end-user preferences. The increasing aging population also presents a growing demand for specialized senior living property management services.
- M&A Trends: The industry has witnessed substantial M&A activity, driven by consolidation, vertical integration, and the acquisition of innovative technology firms. Deal volumes in the historical period (2019-2024) averaged 12 significant transactions per year, with an estimated market value of over $500 million annually.
US Property Management Industry Growth Trends & Insights
The US property management industry is poised for robust growth, driven by increasing property ownership, urbanization, and the growing complexity of property operations. The market size is projected to expand significantly, fueled by a consistent CAGR, indicating a healthy and sustained upward trajectory. Adoption rates of advanced property management software and automation tools are steadily rising as property owners and managers recognize the benefits of improved efficiency, cost reduction, and enhanced resident satisfaction. Technological disruptions, such as the integration of AI and machine learning into property management workflows, are transforming operational paradigms, from predictive maintenance to personalized tenant services.
Consumer behavior shifts, including a greater emphasis on digital interactions, seamless online experiences for rent payments and maintenance requests, and a demand for sustainable and technologically advanced living environments, are profoundly influencing service offerings. The growing trend of remote work also impacts property management, necessitating flexible solutions and digital communication channels. The market penetration of advanced property management solutions is expected to reach new heights as smaller operators increasingly adopt scalable technologies to remain competitive. The estimated market size for the base year 2025 is projected to be around USD 150,000 million, with a projected CAGR of approximately 7.5% through the forecast period.
Dominant Regions, Countries, or Segments in US Property Management Industry
The Residential segment, encompassing single-family homes, multi-family apartments, and student housing, is the dominant force driving growth within the US property management industry. This dominance is underpinned by several key factors, including consistent demand for housing, increasing urbanization, and a growing population. The sheer volume of residential units under management, coupled with the inherent complexities of tenant relations, maintenance, and leasing, creates a perpetual need for professional property management services.
- Residential Segment Dominance Factors:
- Market Share: The residential segment accounts for approximately 70% of the total US property management market share.
- Growth Potential: Driven by a persistent housing shortage in key metropolitan areas and the increasing preference for rental accommodations, particularly among younger demographics.
- Economic Policies: Favorable housing policies and investment incentives indirectly boost the demand for property management services.
- Infrastructure Development: Continuous development of new residential complexes in suburban and urban areas expands the operational scope for property managers.
- Commercial Segment: While significant, the commercial segment (office buildings, retail spaces, industrial properties) exhibits more cyclical growth patterns influenced by economic conditions and business expansion trends. Its market share stands at approximately 25%.
- Service Segment Breakdown: Within the broader property management services, Tenant Services and Maintenance represent the largest sub-segments, consistently demanding significant resource allocation and technological investment due to their direct impact on tenant satisfaction and property value. Marketing services are increasingly leveraging digital channels to attract and retain tenants, contributing to their growing importance. Property Evaluation services are crucial for investment decisions and portfolio management, while Other Services, including legal compliance and financial reporting, form a vital support structure. The collective market share for these services is integrated within the broader residential and commercial segments.
US Property Management Industry Product Landscape
The US property management industry's product landscape is characterized by a rapid evolution of software solutions and technological integrations designed to streamline operations and enhance stakeholder experiences. Property management software (PMS) platforms are at the forefront, offering comprehensive features for accounting, leasing, maintenance tracking, and tenant communication. Innovations include AI-powered chatbots for instant tenant support, advanced analytics for rent optimization and predictive maintenance, and seamless integration with smart home technologies. The performance metrics increasingly focus on operational efficiency gains, such as reduced vacancy rates and faster maintenance turnaround times, alongside improvements in tenant retention and satisfaction scores. Unique selling propositions often revolve around user-friendliness, robust feature sets, and specialized modules catering to diverse property types, from single-family rentals to large multi-family complexes.
Key Drivers, Barriers & Challenges in US Property Management Industry
Key Drivers:
- Increasing Demand for Rental Properties: A growing population and affordability challenges in homeownership fuel the demand for rental housing, directly increasing the need for property management.
- Technological Advancements: Adoption of property management software, AI, and IoT solutions enhances efficiency, reduces costs, and improves tenant experience.
- Urbanization and Population Growth: Concentrated populations in urban centers create a higher density of rental properties requiring professional management.
- Investor Interest in Real Estate: Real estate continues to be an attractive investment, leading to more properties requiring management services.
Barriers & Challenges:
- Regulatory Complexity: Navigating diverse and evolving landlord-tenant laws, fair housing regulations, and local ordinances presents significant compliance challenges.
- High Operational Costs: Maintenance, repairs, and staffing can lead to substantial operational expenses, impacting profitability.
- Talent Shortage: Finding and retaining skilled property managers and maintenance staff can be difficult, leading to operational disruptions.
- Economic Downturns: Recessions can lead to increased vacancies and reduced rental income, impacting the overall financial health of property management companies.
- Cybersecurity Threats: Protecting sensitive tenant data and financial information from cyberattacks is a constant and growing concern.
- Supply Chain Issues for Maintenance Materials: Disruptions in the supply chain can lead to delays and increased costs for essential maintenance and repair materials, with estimated impacts on project completion timelines ranging from 10% to 20% delays in critical periods.
Emerging Opportunities in US Property Management Industry
Emerging opportunities within the US property management industry lie in the increasing demand for specialized services and the integration of cutting-edge technologies. The growing senior living market presents a significant untapped area for property managers equipped to handle the unique needs of older adults, including accessibility modifications and specialized care coordination. The expansion of build-to-rent (BTR) communities offers a new avenue for large-scale, institutional property management. Furthermore, the application of AI and machine learning for hyper-personalized tenant experiences, predictive analytics for market trends, and advanced sustainability reporting provides avenues for differentiation and value creation. The demand for integrated smart home solutions and energy-efficient property management also presents substantial growth potential.
Growth Accelerators in the US Property Management Industry Industry
Several key catalysts are accelerating the long-term growth of the US property management industry. The continuous influx of institutional capital into the real estate sector, particularly into multi-family and build-to-rent segments, necessitates professional and scalable property management solutions. Strategic partnerships between technology providers and property management firms are fostering the development and adoption of innovative tools, enhancing operational efficiencies and tenant engagement. Market expansion strategies, including mergers and acquisitions, are consolidating market share and creating larger, more integrated service providers capable of handling complex portfolios. The increasing focus on environmental, social, and governance (ESG) factors is also driving the demand for property management services that prioritize sustainability and responsible operations.
Key Players Shaping the US Property Management Industry Market
- WinnCompanies
- CoStar Group Inc
- Jones Lang LaSalle Incorporated
- CBRE Group
- FPI Management
- Equity Residential
- Greystar Real Estate Partners
- Pinnacle Property Management
- AvalonBay Communities
- Lincoln Property Company
- 6 3 Other Companie
Notable Milestones in US Property Management Industry Sector
- February 2024: Wood Partners, the 4th-largest real estate developer in the United States, sold its property management business for its 38,000+ units in 17 states to Greystar (Charleston, South Carolina), the country's largest apartment management company, significantly consolidating the multi-family property management landscape.
- November 2023: RealPage Inc. acquired On-site Managers Inc. for approximately USD 250 million in cash. On-Site is an on-demand leasing platform for multifamily property management and renters that integrates leads from all sources and converts them to signed leases for the multifamily industry and the single-family housing industry. RealPage will continue to support the on-site platform and plans to integrate the best of its on-site platforms in the future. Clients on both platforms will continue to benefit from future improvements without disruption, indicating a trend towards platform consolidation and enhanced digital leasing capabilities.
In-Depth US Property Management Industry Market Outlook
The US property management industry is set for sustained growth, driven by fundamental market forces and accelerating technological adoption. Future market potential is strongly linked to the continued demand for rental housing, urbanization trends, and the increasing sophistication of property operations. Strategic opportunities abound in the development of specialized services catering to emerging markets such as build-to-rent and senior living, alongside the deeper integration of AI and IoT for predictive maintenance and personalized tenant engagement. The ongoing consolidation through M&A will likely lead to larger, more capable entities, while technology-driven efficiencies will become a key differentiator. The industry is poised for a future characterized by smart, sustainable, and tenant-centric property management.
US Property Management Industry Segmentation
-
1. End User
- 1.1. Commercial
- 1.2. Residential
-
2. Service
- 2.1. Marketing
- 2.2. Property Evaluation
- 2.3. Tenant Services
- 2.4. Maintenance
- 2.5. Other Services
US Property Management Industry Segmentation By Geography
-
1. North America
- 1.1. United States
- 1.2. Canada
- 1.3. Mexico
-
2. South America
- 2.1. Brazil
- 2.2. Argentina
- 2.3. Rest of South America
-
3. Europe
- 3.1. United Kingdom
- 3.2. Germany
- 3.3. France
- 3.4. Italy
- 3.5. Spain
- 3.6. Russia
- 3.7. Benelux
- 3.8. Nordics
- 3.9. Rest of Europe
-
4. Middle East & Africa
- 4.1. Turkey
- 4.2. Israel
- 4.3. GCC
- 4.4. North Africa
- 4.5. South Africa
- 4.6. Rest of Middle East & Africa
-
5. Asia Pacific
- 5.1. China
- 5.2. India
- 5.3. Japan
- 5.4. South Korea
- 5.5. ASEAN
- 5.6. Oceania
- 5.7. Rest of Asia Pacific
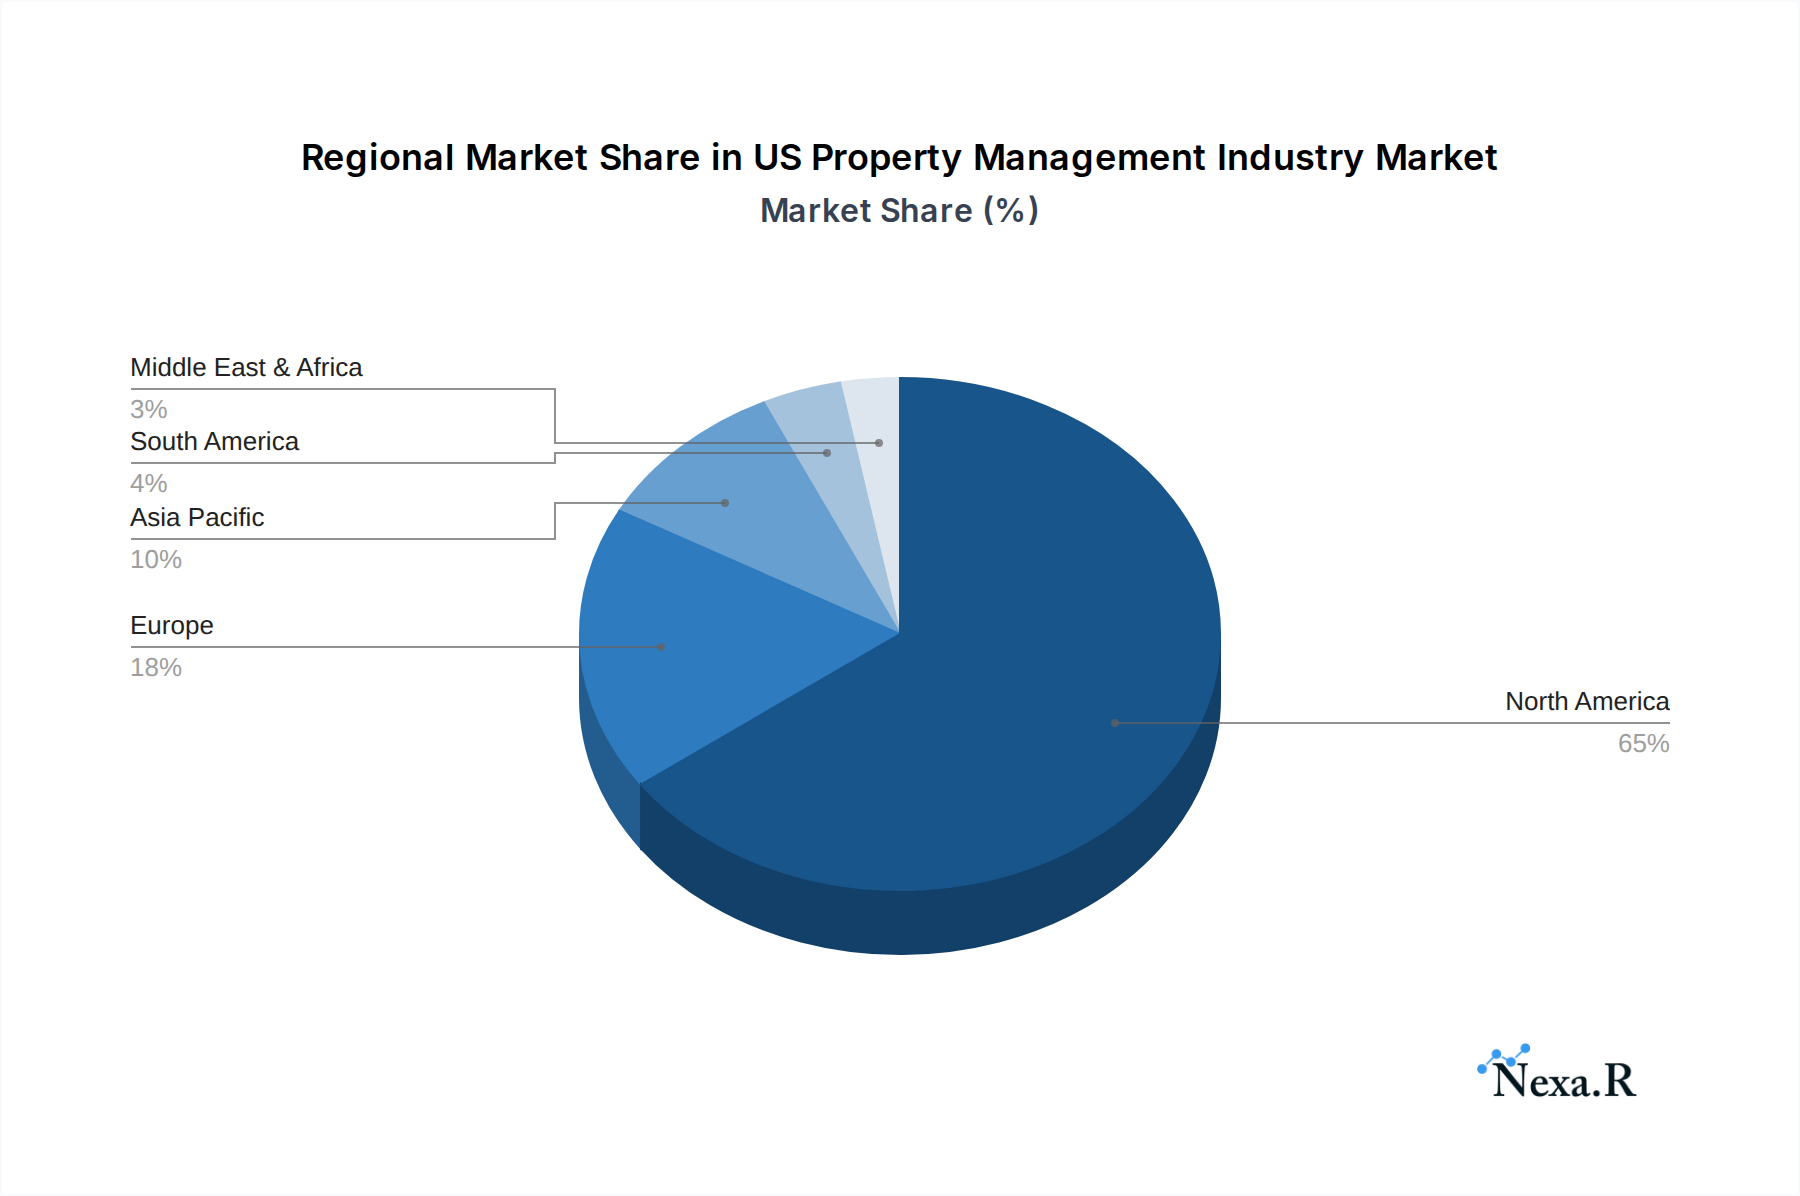
US Property Management Industry Regional Market Share
Geographic Coverage of US Property Management Industry
US Property Management Industry REPORT HIGHLIGHTS
| Aspects | Details |
|---|---|
| Study Period | 2020-2034 |
| Base Year | 2025 |
| Estimated Year | 2026 |
| Forecast Period | 2026-2034 |
| Historical Period | 2020-2025 |
| Growth Rate | CAGR of 3.94% from 2020-2034 |
| Segmentation |
|
Table of Contents
- 1. Introduction
- 1.1. Research Scope
- 1.2. Market Segmentation
- 1.3. Research Objective
- 1.4. Definitions and Assumptions
- 2. Executive Summary
- 2.1. Market Snapshot
- 3. Market Dynamics
- 3.1. Market Drivers
- 3.2. Market Restrains
- 3.3. Market Trends
- 3.4. Market Opportunities
- 4. Market Factor Analysis
- 4.1. Porters Five Forces
- 4.1.1. Bargaining Power of Suppliers
- 4.1.2. Bargaining Power of Buyers
- 4.1.3. Threat of New Entrants
- 4.1.4. Threat of Substitutes
- 4.1.5. Competitive Rivalry
- 4.2. PESTEL analysis
- 4.3. BCG Analysis
- 4.3.1. Stars (High Growth, High Market Share)
- 4.3.2. Cash Cows (Low Growth, High Market Share)
- 4.3.3. Question Mark (High Growth, Low Market Share)
- 4.3.4. Dogs (Low Growth, Low Market Share)
- 4.4. Ansoff Matrix Analysis
- 4.5. Supply Chain Analysis
- 4.6. Regulatory Landscape
- 4.7. Current Market Potential and Opportunity Assessment (TAM–SAM–SOM Framework)
- 4.8. NRP Analyst Note
- 4.1. Porters Five Forces
- 5. Market Analysis, Insights and Forecast 2021-2033
- 5.1. Market Analysis, Insights and Forecast - by End User
- 5.1.1. Commercial
- 5.1.2. Residential
- 5.2. Market Analysis, Insights and Forecast - by Service
- 5.2.1. Marketing
- 5.2.2. Property Evaluation
- 5.2.3. Tenant Services
- 5.2.4. Maintenance
- 5.2.5. Other Services
- 5.3. Market Analysis, Insights and Forecast - by Region
- 5.3.1. North America
- 5.3.2. South America
- 5.3.3. Europe
- 5.3.4. Middle East & Africa
- 5.3.5. Asia Pacific
- 5.1. Market Analysis, Insights and Forecast - by End User
- 6. Global US Property Management Industry Analysis, Insights and Forecast, 2021-2033
- 6.1. Market Analysis, Insights and Forecast - by End User
- 6.1.1. Commercial
- 6.1.2. Residential
- 6.2. Market Analysis, Insights and Forecast - by Service
- 6.2.1. Marketing
- 6.2.2. Property Evaluation
- 6.2.3. Tenant Services
- 6.2.4. Maintenance
- 6.2.5. Other Services
- 6.1. Market Analysis, Insights and Forecast - by End User
- 7. North America US Property Management Industry Analysis, Insights and Forecast, 2020-2032
- 7.1. Market Analysis, Insights and Forecast - by End User
- 7.1.1. Commercial
- 7.1.2. Residential
- 7.2. Market Analysis, Insights and Forecast - by Service
- 7.2.1. Marketing
- 7.2.2. Property Evaluation
- 7.2.3. Tenant Services
- 7.2.4. Maintenance
- 7.2.5. Other Services
- 7.1. Market Analysis, Insights and Forecast - by End User
- 8. South America US Property Management Industry Analysis, Insights and Forecast, 2020-2032
- 8.1. Market Analysis, Insights and Forecast - by End User
- 8.1.1. Commercial
- 8.1.2. Residential
- 8.2. Market Analysis, Insights and Forecast - by Service
- 8.2.1. Marketing
- 8.2.2. Property Evaluation
- 8.2.3. Tenant Services
- 8.2.4. Maintenance
- 8.2.5. Other Services
- 8.1. Market Analysis, Insights and Forecast - by End User
- 9. Europe US Property Management Industry Analysis, Insights and Forecast, 2020-2032
- 9.1. Market Analysis, Insights and Forecast - by End User
- 9.1.1. Commercial
- 9.1.2. Residential
- 9.2. Market Analysis, Insights and Forecast - by Service
- 9.2.1. Marketing
- 9.2.2. Property Evaluation
- 9.2.3. Tenant Services
- 9.2.4. Maintenance
- 9.2.5. Other Services
- 9.1. Market Analysis, Insights and Forecast - by End User
- 10. Middle East & Africa US Property Management Industry Analysis, Insights and Forecast, 2020-2032
- 10.1. Market Analysis, Insights and Forecast - by End User
- 10.1.1. Commercial
- 10.1.2. Residential
- 10.2. Market Analysis, Insights and Forecast - by Service
- 10.2.1. Marketing
- 10.2.2. Property Evaluation
- 10.2.3. Tenant Services
- 10.2.4. Maintenance
- 10.2.5. Other Services
- 10.1. Market Analysis, Insights and Forecast - by End User
- 11. Asia Pacific US Property Management Industry Analysis, Insights and Forecast, 2020-2032
- 11.1. Market Analysis, Insights and Forecast - by End User
- 11.1.1. Commercial
- 11.1.2. Residential
- 11.2. Market Analysis, Insights and Forecast - by Service
- 11.2.1. Marketing
- 11.2.2. Property Evaluation
- 11.2.3. Tenant Services
- 11.2.4. Maintenance
- 11.2.5. Other Services
- 11.1. Market Analysis, Insights and Forecast - by End User
- 12. Competitive Analysis
- 12.1. Company Profiles
- 12.1.1 WinnCompanies**List Not Exhaustive 6 3 Other Companie
- 12.1.1.1. Company Overview
- 12.1.1.2. Products
- 12.1.1.3. Company Financials
- 12.1.1.4. SWOT Analysis
- 12.1.2 CoStar Group Inc
- 12.1.2.1. Company Overview
- 12.1.2.2. Products
- 12.1.2.3. Company Financials
- 12.1.2.4. SWOT Analysis
- 12.1.3 Jones Lang LaSalle Incorporated
- 12.1.3.1. Company Overview
- 12.1.3.2. Products
- 12.1.3.3. Company Financials
- 12.1.3.4. SWOT Analysis
- 12.1.4 CBRE Group
- 12.1.4.1. Company Overview
- 12.1.4.2. Products
- 12.1.4.3. Company Financials
- 12.1.4.4. SWOT Analysis
- 12.1.5 FPI Management
- 12.1.5.1. Company Overview
- 12.1.5.2. Products
- 12.1.5.3. Company Financials
- 12.1.5.4. SWOT Analysis
- 12.1.6 Equity Residential
- 12.1.6.1. Company Overview
- 12.1.6.2. Products
- 12.1.6.3. Company Financials
- 12.1.6.4. SWOT Analysis
- 12.1.7 Greystar Real Estate Partners
- 12.1.7.1. Company Overview
- 12.1.7.2. Products
- 12.1.7.3. Company Financials
- 12.1.7.4. SWOT Analysis
- 12.1.8 Pinnacle Property Management
- 12.1.8.1. Company Overview
- 12.1.8.2. Products
- 12.1.8.3. Company Financials
- 12.1.8.4. SWOT Analysis
- 12.1.9 AvalonBay Communities
- 12.1.9.1. Company Overview
- 12.1.9.2. Products
- 12.1.9.3. Company Financials
- 12.1.9.4. SWOT Analysis
- 12.1.10 Lincoln Property Company
- 12.1.10.1. Company Overview
- 12.1.10.2. Products
- 12.1.10.3. Company Financials
- 12.1.10.4. SWOT Analysis
- 12.1.1 WinnCompanies**List Not Exhaustive 6 3 Other Companie
- 12.2. Market Entropy
- 12.2.1 Company's Key Areas Served
- 12.2.2 Recent Developments
- 12.3. Company Market Share Analysis 2025
- 12.3.1 Top 5 Companies Market Share Analysis
- 12.3.2 Top 3 Companies Market Share Analysis
- 12.4. List of Potential Customers
- 13. Research Methodology
List of Figures
- Figure 1: Global US Property Management Industry Revenue Breakdown (Million, %) by Region 2025 & 2033
- Figure 2: North America US Property Management Industry Revenue (Million), by End User 2025 & 2033
- Figure 3: North America US Property Management Industry Revenue Share (%), by End User 2025 & 2033
- Figure 4: North America US Property Management Industry Revenue (Million), by Service 2025 & 2033
- Figure 5: North America US Property Management Industry Revenue Share (%), by Service 2025 & 2033
- Figure 6: North America US Property Management Industry Revenue (Million), by Country 2025 & 2033
- Figure 7: North America US Property Management Industry Revenue Share (%), by Country 2025 & 2033
- Figure 8: South America US Property Management Industry Revenue (Million), by End User 2025 & 2033
- Figure 9: South America US Property Management Industry Revenue Share (%), by End User 2025 & 2033
- Figure 10: South America US Property Management Industry Revenue (Million), by Service 2025 & 2033
- Figure 11: South America US Property Management Industry Revenue Share (%), by Service 2025 & 2033
- Figure 12: South America US Property Management Industry Revenue (Million), by Country 2025 & 2033
- Figure 13: South America US Property Management Industry Revenue Share (%), by Country 2025 & 2033
- Figure 14: Europe US Property Management Industry Revenue (Million), by End User 2025 & 2033
- Figure 15: Europe US Property Management Industry Revenue Share (%), by End User 2025 & 2033
- Figure 16: Europe US Property Management Industry Revenue (Million), by Service 2025 & 2033
- Figure 17: Europe US Property Management Industry Revenue Share (%), by Service 2025 & 2033
- Figure 18: Europe US Property Management Industry Revenue (Million), by Country 2025 & 2033
- Figure 19: Europe US Property Management Industry Revenue Share (%), by Country 2025 & 2033
- Figure 20: Middle East & Africa US Property Management Industry Revenue (Million), by End User 2025 & 2033
- Figure 21: Middle East & Africa US Property Management Industry Revenue Share (%), by End User 2025 & 2033
- Figure 22: Middle East & Africa US Property Management Industry Revenue (Million), by Service 2025 & 2033
- Figure 23: Middle East & Africa US Property Management Industry Revenue Share (%), by Service 2025 & 2033
- Figure 24: Middle East & Africa US Property Management Industry Revenue (Million), by Country 2025 & 2033
- Figure 25: Middle East & Africa US Property Management Industry Revenue Share (%), by Country 2025 & 2033
- Figure 26: Asia Pacific US Property Management Industry Revenue (Million), by End User 2025 & 2033
- Figure 27: Asia Pacific US Property Management Industry Revenue Share (%), by End User 2025 & 2033
- Figure 28: Asia Pacific US Property Management Industry Revenue (Million), by Service 2025 & 2033
- Figure 29: Asia Pacific US Property Management Industry Revenue Share (%), by Service 2025 & 2033
- Figure 30: Asia Pacific US Property Management Industry Revenue (Million), by Country 2025 & 2033
- Figure 31: Asia Pacific US Property Management Industry Revenue Share (%), by Country 2025 & 2033
List of Tables
- Table 1: Global US Property Management Industry Revenue Million Forecast, by End User 2020 & 2033
- Table 2: Global US Property Management Industry Revenue Million Forecast, by Service 2020 & 2033
- Table 3: Global US Property Management Industry Revenue Million Forecast, by Region 2020 & 2033
- Table 4: Global US Property Management Industry Revenue Million Forecast, by End User 2020 & 2033
- Table 5: Global US Property Management Industry Revenue Million Forecast, by Service 2020 & 2033
- Table 6: Global US Property Management Industry Revenue Million Forecast, by Country 2020 & 2033
- Table 7: United States US Property Management Industry Revenue (Million) Forecast, by Application 2020 & 2033
- Table 8: Canada US Property Management Industry Revenue (Million) Forecast, by Application 2020 & 2033
- Table 9: Mexico US Property Management Industry Revenue (Million) Forecast, by Application 2020 & 2033
- Table 10: Global US Property Management Industry Revenue Million Forecast, by End User 2020 & 2033
- Table 11: Global US Property Management Industry Revenue Million Forecast, by Service 2020 & 2033
- Table 12: Global US Property Management Industry Revenue Million Forecast, by Country 2020 & 2033
- Table 13: Brazil US Property Management Industry Revenue (Million) Forecast, by Application 2020 & 2033
- Table 14: Argentina US Property Management Industry Revenue (Million) Forecast, by Application 2020 & 2033
- Table 15: Rest of South America US Property Management Industry Revenue (Million) Forecast, by Application 2020 & 2033
- Table 16: Global US Property Management Industry Revenue Million Forecast, by End User 2020 & 2033
- Table 17: Global US Property Management Industry Revenue Million Forecast, by Service 2020 & 2033
- Table 18: Global US Property Management Industry Revenue Million Forecast, by Country 2020 & 2033
- Table 19: United Kingdom US Property Management Industry Revenue (Million) Forecast, by Application 2020 & 2033
- Table 20: Germany US Property Management Industry Revenue (Million) Forecast, by Application 2020 & 2033
- Table 21: France US Property Management Industry Revenue (Million) Forecast, by Application 2020 & 2033
- Table 22: Italy US Property Management Industry Revenue (Million) Forecast, by Application 2020 & 2033
- Table 23: Spain US Property Management Industry Revenue (Million) Forecast, by Application 2020 & 2033
- Table 24: Russia US Property Management Industry Revenue (Million) Forecast, by Application 2020 & 2033
- Table 25: Benelux US Property Management Industry Revenue (Million) Forecast, by Application 2020 & 2033
- Table 26: Nordics US Property Management Industry Revenue (Million) Forecast, by Application 2020 & 2033
- Table 27: Rest of Europe US Property Management Industry Revenue (Million) Forecast, by Application 2020 & 2033
- Table 28: Global US Property Management Industry Revenue Million Forecast, by End User 2020 & 2033
- Table 29: Global US Property Management Industry Revenue Million Forecast, by Service 2020 & 2033
- Table 30: Global US Property Management Industry Revenue Million Forecast, by Country 2020 & 2033
- Table 31: Turkey US Property Management Industry Revenue (Million) Forecast, by Application 2020 & 2033
- Table 32: Israel US Property Management Industry Revenue (Million) Forecast, by Application 2020 & 2033
- Table 33: GCC US Property Management Industry Revenue (Million) Forecast, by Application 2020 & 2033
- Table 34: North Africa US Property Management Industry Revenue (Million) Forecast, by Application 2020 & 2033
- Table 35: South Africa US Property Management Industry Revenue (Million) Forecast, by Application 2020 & 2033
- Table 36: Rest of Middle East & Africa US Property Management Industry Revenue (Million) Forecast, by Application 2020 & 2033
- Table 37: Global US Property Management Industry Revenue Million Forecast, by End User 2020 & 2033
- Table 38: Global US Property Management Industry Revenue Million Forecast, by Service 2020 & 2033
- Table 39: Global US Property Management Industry Revenue Million Forecast, by Country 2020 & 2033
- Table 40: China US Property Management Industry Revenue (Million) Forecast, by Application 2020 & 2033
- Table 41: India US Property Management Industry Revenue (Million) Forecast, by Application 2020 & 2033
- Table 42: Japan US Property Management Industry Revenue (Million) Forecast, by Application 2020 & 2033
- Table 43: South Korea US Property Management Industry Revenue (Million) Forecast, by Application 2020 & 2033
- Table 44: ASEAN US Property Management Industry Revenue (Million) Forecast, by Application 2020 & 2033
- Table 45: Oceania US Property Management Industry Revenue (Million) Forecast, by Application 2020 & 2033
- Table 46: Rest of Asia Pacific US Property Management Industry Revenue (Million) Forecast, by Application 2020 & 2033
Frequently Asked Questions
1. What is the projected Compound Annual Growth Rate (CAGR) of the US Property Management Industry?
The projected CAGR is approximately 3.94%.
2. Which companies are prominent players in the US Property Management Industry?
Key companies in the market include WinnCompanies**List Not Exhaustive 6 3 Other Companie, CoStar Group Inc, Jones Lang LaSalle Incorporated, CBRE Group, FPI Management, Equity Residential, Greystar Real Estate Partners, Pinnacle Property Management, AvalonBay Communities, Lincoln Property Company.
3. What are the main segments of the US Property Management Industry?
The market segments include End User, Service.
4. Can you provide details about the market size?
The market size is estimated to be USD 81.52 Million as of 2022.
5. What are some drivers contributing to market growth?
Increasing Demand from the Commercial Segment is Driving the Market; Increasing Disposable Income of Consumers is Driving the market.
6. What are the notable trends driving market growth?
Demand from the Residential Sector is Supporting the Market.
7. Are there any restraints impacting market growth?
Economic Uncertainties are Restraining the Market.
8. Can you provide examples of recent developments in the market?
February 2024: Wood Partners, the 4th-largest real estate developer in the United States, sold its property management business for its 38,000+ units in 17 states to Greystar (Charleston, South Carolina), the country's largest apartment management company.
9. What pricing options are available for accessing the report?
Pricing options include single-user, multi-user, and enterprise licenses priced at USD 3800, USD 4500, and USD 5800 respectively.
10. Is the market size provided in terms of value or volume?
The market size is provided in terms of value, measured in Million.
11. Are there any specific market keywords associated with the report?
Yes, the market keyword associated with the report is "US Property Management Industry," which aids in identifying and referencing the specific market segment covered.
12. How do I determine which pricing option suits my needs best?
The pricing options vary based on user requirements and access needs. Individual users may opt for single-user licenses, while businesses requiring broader access may choose multi-user or enterprise licenses for cost-effective access to the report.
13. Are there any additional resources or data provided in the US Property Management Industry report?
While the report offers comprehensive insights, it's advisable to review the specific contents or supplementary materials provided to ascertain if additional resources or data are available.
14. How can I stay updated on further developments or reports in the US Property Management Industry?
To stay informed about further developments, trends, and reports in the US Property Management Industry, consider subscribing to industry newsletters, following relevant companies and organizations, or regularly checking reputable industry news sources and publications.
Methodology
Step 1 - Identification of Relevant Samples Size from Population Database


Step 2 - Approaches for Defining Global Market Size (Value, Volume* & Price*)

Note*: In applicable scenarios
Step 3 - Data Sources
Primary Research
- Web Analytics
- Survey Reports
- Research Institute
- Latest Research Reports
- Opinion Leaders
Secondary Research
- Annual Reports
- White Paper
- Latest Press Release
- Industry Association
- Paid Database
- Investor Presentations

Step 4 - Data Triangulation
Involves using different sources of information in order to increase the validity of a study
These sources are likely to be stakeholders in a program - participants, other researchers, program staff, other community members, and so on.
Then we put all data in single framework & apply various statistical tools to find out the dynamic on the market.
During the analysis stage, feedback from the stakeholder groups would be compared to determine areas of agreement as well as areas of divergence