

Key Insights
The global Caprolactam market is poised for steady expansion, projected to reach a significant market size within the forecast period. Driven by a robust CAGR exceeding 3.00%, this growth is underpinned by escalating demand across its diverse applications, primarily in the production of Nylon 6 resins, fibers, and subsequent industrial and consumer goods. Key growth catalysts include the burgeoning automotive sector, where Nylon 6 is increasingly favored for its lightweight and durable properties in components, and the ever-present demand from the textile and carpet industries. Furthermore, the expanding use of caprolactam in engineering resins and films for packaging and specialized industrial applications contributes to its market vitality. Emerging economies, particularly in the Asia Pacific region, are expected to spearhead this expansion due to rapid industrialization and increasing consumer disposable income, translating into higher consumption of Nylon 6-based products.
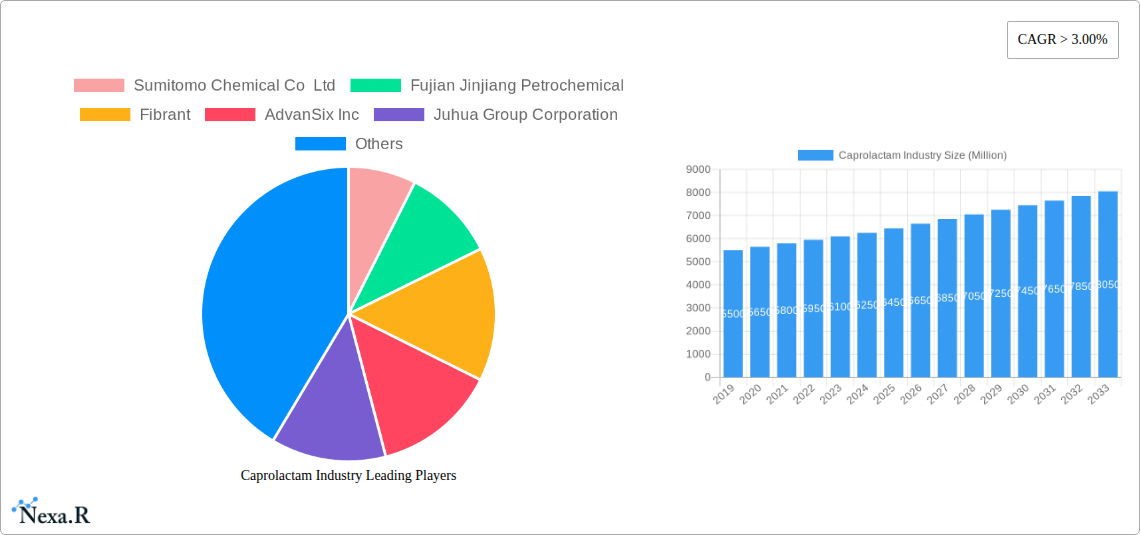
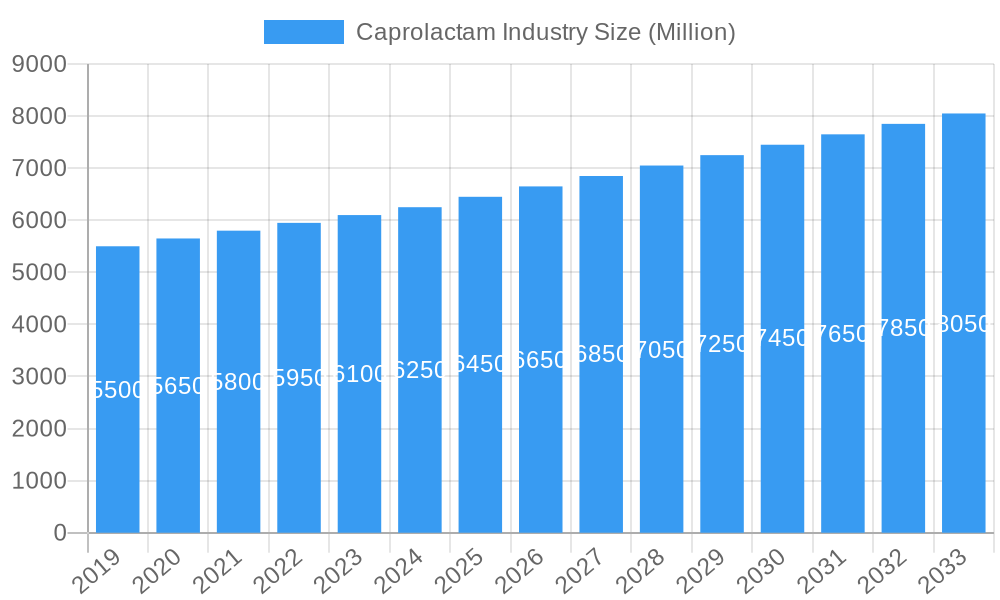
Caprolactam Industry Market Size (In Billion)
The market landscape is characterized by a competitive environment with a mix of established global players and regional manufacturers. Strategic initiatives such as capacity expansions, mergers, and acquisitions are likely to shape the competitive dynamics as companies aim to secure market share and optimize supply chains. While the industry benefits from strong demand drivers, it also faces certain restraints. Fluctuations in raw material prices, primarily phenol and cyclohexane, can impact profitability and influence pricing strategies. Additionally, evolving environmental regulations and the pursuit of sustainable alternatives might pose challenges, prompting manufacturers to invest in greener production processes and explore bio-based caprolactam. The market is segmenting effectively, with Nylon 6 Resins and Nylon 6 Fibers holding substantial shares, while "Other End Products" and "Other Applications" represent areas of potential future growth and innovation. The automotive and textile industries are dominant end-user segments, but growth in other industrial sectors is also anticipated.
Caprolactam Industry Company Market Share
Comprehensive Caprolactam Industry Report: Market Dynamics, Growth Trends, and Future Outlook (2019-2033)
This in-depth report provides a strategic analysis of the global caprolactam market, covering its intricate dynamics, growth trajectories, and future potential. With a study period from 2019 to 2033, including a base year of 2025, this report delves into the parent and child market segments, offering granular insights for industry professionals. We meticulously examine market size, segmentation by raw material, end product, application, and end-user industry, alongside key players and notable developments, all presented in millions of units.
Caprolactam Industry Market Dynamics & Structure
The global caprolactam market exhibits a moderately concentrated structure, with a few major players dominating production capacity. Technological innovation, particularly in process efficiency and sustainability, serves as a significant driver, pushing companies to invest in advanced manufacturing techniques. Regulatory frameworks, primarily concerning environmental impact and chemical safety, influence production standards and market entry barriers. While direct substitutes for Nylon 6 are limited, advancements in alternative polymers for specific applications pose a competitive threat. End-user demographics are shifting towards sectors with higher demand for engineered plastics and high-performance fibers, such as automotive and technical textiles. Mergers and acquisitions (M&A) are a notable trend, with companies consolidating to enhance market presence and achieve economies of scale. For instance, the historical period has seen strategic acquisitions aimed at expanding geographic reach and product portfolios. Barriers to innovation include high capital investment for new plant construction and the complex chemical processes involved.
- Market Concentration: Dominated by key global manufacturers.
- Technological Drivers: Process optimization, efficiency improvements, and sustainable production.
- Regulatory Impact: Environmental compliance, safety standards, and chemical management.
- Competitive Landscape: Limited direct substitutes, but emerging polymer alternatives for specific niches.
- End-User Evolution: Growing demand from automotive and technical textile sectors.
- M&A Activity: Strategic consolidations for market share and operational synergy.
- Innovation Barriers: High capital expenditure and complex manufacturing processes.
Caprolactam Industry Growth Trends & Insights
The caprolactam market is poised for robust growth, projected to witness a substantial Compound Annual Growth Rate (CAGR) over the forecast period. This expansion is underpinned by an increasing adoption rate of Nylon 6 in various applications, driven by its superior properties such as durability, flexibility, and chemical resistance. Technological disruptions, including the development of bio-based caprolactam and more energy-efficient production methods, are set to revolutionize the industry, further accelerating market penetration. Consumer behavior shifts towards sustainable and high-performance materials in end-user industries like textiles and automotive also contribute significantly to market expansion. The base year of 2025 marks a pivotal point, with projected market size expected to reflect the ongoing recovery and growth momentum. The historical period (2019-2024) has laid the groundwork for this accelerated growth, with steady increases in production and consumption. Future market size projections indicate a sustained upward trend, driven by both established applications and emerging use cases for Nylon 6.
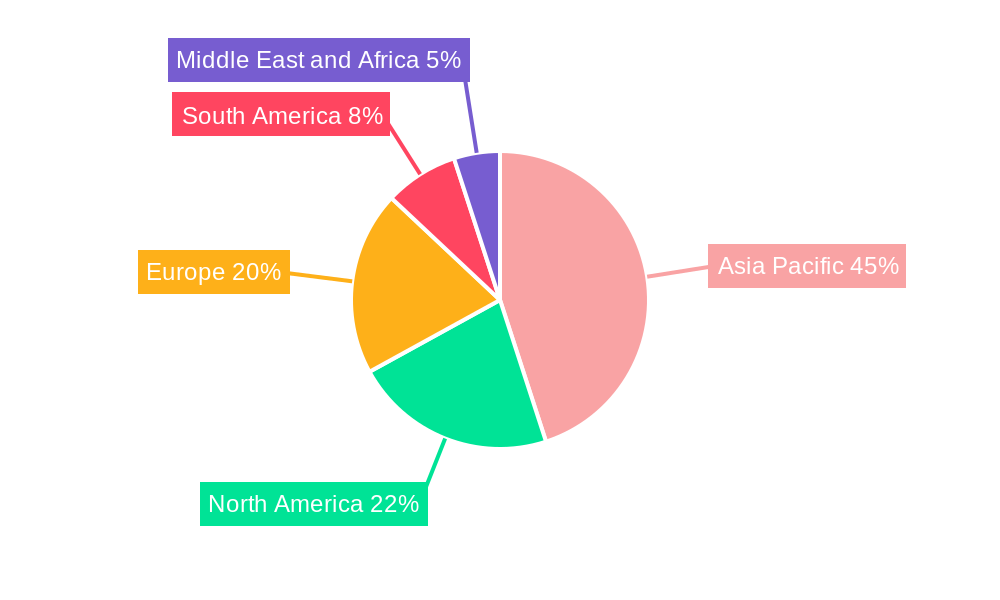
Dominant Regions, Countries, or Segments in Caprolactam Industry
Asia Pacific is anticipated to be the dominant region in the global caprolactam market, driven by strong manufacturing capabilities and substantial domestic demand from key end-user industries. China, in particular, is a powerhouse, boasting significant production capacity and consumption of caprolactam for its burgeoning textile, automotive, and engineering plastics sectors. The End Product: Nylon 6 Resins segment is expected to be a primary growth engine, fueled by increasing use in automotive components for lightweighting and in electronics for durable casings. The Application: Engineering Resins and Films also presents substantial growth potential due to their versatility and performance in demanding applications. Economic policies promoting industrial development and infrastructure expansion in emerging Asian economies further bolster this dominance.
- Dominant Region: Asia Pacific, led by China.
- Key End Product: Nylon 6 Resins, driven by automotive and electronics demand.
- Key Application: Engineering Resins and Films, leveraging versatility and performance.
- End-User Industry Drivers: Automotive sector for lightweighting and performance, and textile industry for durable fibers.
- Growth Potential: Strong growth anticipated due to rising industrialization and consumer demand in emerging economies.
- Market Share: Asia Pacific is projected to hold a significant market share in terms of both production and consumption.
- Economic Policies: Supportive government initiatives for manufacturing and industrial growth.
Caprolactam Industry Product Landscape
The caprolactam product landscape is characterized by continuous innovation focused on enhancing purity, reducing by-products, and developing sustainable production routes. Key product innovations include advancements in catalytic processes leading to higher yields and lower energy consumption. Nylon 6 resins derived from caprolactam are gaining traction for their exceptional strength, abrasion resistance, and thermal stability, making them indispensable in automotive interiors, electrical components, and industrial films. Performance metrics such as tensile strength, elongation at break, and chemical resistance are continuously being improved to meet stringent application requirements. The development of specialized Nylon 6 grades tailored for 3D printing and advanced composite materials further expands the product's utility, underscoring its technological advancements and unique selling propositions.
Key Drivers, Barriers & Challenges in Caprolactam Industry
The caprolactam industry is propelled by several key drivers, including the escalating demand for lightweight and durable materials in the automotive sector, the robust growth of the global textile industry, and the increasing adoption of Nylon 6 in engineering plastics and packaging films. Technological advancements in production processes, leading to improved efficiency and cost-effectiveness, also serve as significant growth catalysts. Policy support for manufacturing and infrastructure development in emerging economies further fuels market expansion.
However, the industry faces considerable challenges and barriers. Volatility in raw material prices, particularly for benzene and cyclohexane, poses a significant risk to profit margins. Stringent environmental regulations related to emissions and waste management can increase operational costs and necessitate substantial investments in compliance. Supply chain disruptions, geopolitical uncertainties, and intense competition among key players can also impede market growth. Furthermore, the high capital intensity of setting up new production facilities acts as a barrier to entry for new market participants.
Emerging Opportunities in Caprolactam Industry
Emerging opportunities in the caprolactam industry lie in the development and market penetration of bio-based caprolactam, addressing the growing consumer and regulatory demand for sustainable materials. The expansion of Nylon 6 applications in advanced composites for aerospace and renewable energy sectors, such as wind turbine blades, presents significant untapped potential. Furthermore, the increasing use of Nylon 6 in high-performance textiles for activewear and technical applications, driven by evolving consumer preferences for comfort and durability, offers another avenue for growth. Innovations in recycling technologies for Nylon 6 products will also unlock circular economy opportunities, further enhancing market sustainability.
Growth Accelerators in the Caprolactam Industry Industry
Long-term growth in the caprolactam industry will be significantly accelerated by ongoing technological breakthroughs in catalysis and process engineering, leading to more efficient and environmentally friendly production methods. Strategic partnerships and collaborations between raw material suppliers, caprolactam producers, and downstream users will foster innovation and market development. Market expansion strategies, particularly targeting developing economies with rising industrialization and increasing disposable incomes, will create new demand centers. Furthermore, advancements in the recycling of Nylon 6 products will not only support sustainability initiatives but also create a more stable and circular supply chain, acting as a significant growth accelerator.
Key Players Shaping the Caprolactam Industry Market
- Sumitomo Chemical Co Ltd
- Fujian Jinjiang Petrochemical
- Fibrant
- AdvanSix Inc
- Juhua Group Corporation
- UBE Corporation
- Fertilisers And Chemicals Travancore Limited (FACT)
- Alpek S A B de CV
- Toray Industries Inc
- Domo Chemicals
- Capro Co
- China Petrochemical Development Corporation
- BASF SE
- Shandong Haili Chemical Industry Co Ltd
- Lanxess
- PJSC Kuibyshevazot
- Xuyang Group
- China Petroleum & Chemical Corporation (Sinopec)
Notable Milestones in Caprolactam Industry Sector
- September 2022: Xuyang Group initiated production of caprolactam at its Cangzhou Park site, boosting its total capacity to 750,000 tons per year following the completion of its second phase expansion project.
- April 2022: Sumitomo Chemical announced the closure of its caprolactam production facilities at its Ehime Works, marking its exit from the caprolactam business.
- March 2022: Domo Chemicals significantly expanded its caprolactam production capacity to 500,000 tons/year from 176,000 tons/year at its German production site.
In-Depth Caprolactam Industry Market Outlook
The future outlook for the caprolactam market is highly promising, driven by persistent demand from established sectors and the emergence of novel applications. Growth accelerators, such as the increasing integration of Nylon 6 in advanced automotive materials for weight reduction and enhanced safety, alongside its expanding use in high-performance textiles and industrial films, will fuel market expansion. Strategic investments in R&D for sustainable production methods, including bio-based caprolactam and efficient recycling technologies, will further solidify the market's long-term viability. Opportunities in emerging economies, coupled with a global push towards circular economy principles, position the caprolactam industry for sustained and impactful growth in the coming years.
Caprolactam Industry Segmentation
-
1. Raw Material
- 1.1. Phenol
- 1.2. Cyclohexane
-
2. End Product
- 2.1. Nylon 6 Resins
- 2.2. Nylon 6 Fibers
- 2.3. Other End Products
-
3. Application
- 3.1. Engineering Resins and Films
- 3.2. Industrial Yarns
- 3.3. Textiles and Carpets
- 3.4. Other Applications
-
4. End-user Industry
- 4.1. Automotive
- 4.2. Carpet
- 4.3. Textile
- 4.4. Other End-user Industries
Caprolactam Industry Segmentation By Geography
-
1. Asia Pacific
- 1.1. China
- 1.2. Japan
- 1.3. South Korea
- 1.4. Rest of Asia Pacific
-
2. North America
- 2.1. United States
- 2.2. Canada
- 2.3. Mexico
-
3. Europe
- 3.1. Germany
- 3.2. United Kingdom
- 3.3. France
- 3.4. Italy
- 3.5. Rest of Europe
-
4. South America
- 4.1. Brazil
- 4.2. Argentina
- 4.3. Rest of South America
-
5. Middle East and Africa
- 5.1. Saudi Arabia
- 5.2. South Africa
- 5.3. Rest of Middle East and Africa
Caprolactam Industry Regional Market Share
Geographic Coverage of Caprolactam Industry
Caprolactam Industry REPORT HIGHLIGHTS
| Aspects | Details |
|---|---|
| Study Period | 2020-2034 |
| Base Year | 2025 |
| Estimated Year | 2026 |
| Forecast Period | 2026-2034 |
| Historical Period | 2020-2025 |
| Growth Rate | CAGR of > 3.00% from 2020-2034 |
| Segmentation |
|
Table of Contents
- 1. Introduction
- 1.1. Research Scope
- 1.2. Market Segmentation
- 1.3. Research Objective
- 1.4. Definitions and Assumptions
- 2. Executive Summary
- 2.1. Market Snapshot
- 3. Market Dynamics
- 3.1. Market Drivers
- 3.2. Market Restrains
- 3.3. Market Trends
- 3.4. Market Opportunities
- 4. Market Factor Analysis
- 4.1. Porters Five Forces
- 4.1.1. Bargaining Power of Suppliers
- 4.1.2. Bargaining Power of Buyers
- 4.1.3. Threat of New Entrants
- 4.1.4. Threat of Substitutes
- 4.1.5. Competitive Rivalry
- 4.2. PESTEL analysis
- 4.3. BCG Analysis
- 4.3.1. Stars (High Growth, High Market Share)
- 4.3.2. Cash Cows (Low Growth, High Market Share)
- 4.3.3. Question Mark (High Growth, Low Market Share)
- 4.3.4. Dogs (Low Growth, Low Market Share)
- 4.4. Ansoff Matrix Analysis
- 4.5. Supply Chain Analysis
- 4.6. Regulatory Landscape
- 4.7. Current Market Potential and Opportunity Assessment (TAM–SAM–SOM Framework)
- 4.8. NRP Analyst Note
- 4.1. Porters Five Forces
- 5. Market Analysis, Insights and Forecast 2021-2033
- 5.1. Market Analysis, Insights and Forecast - by Raw Material
- 5.1.1. Phenol
- 5.1.2. Cyclohexane
- 5.2. Market Analysis, Insights and Forecast - by End Product
- 5.2.1. Nylon 6 Resins
- 5.2.2. Nylon 6 Fibers
- 5.2.3. Other End Products
- 5.3. Market Analysis, Insights and Forecast - by Application
- 5.3.1. Engineering Resins and Films
- 5.3.2. Industrial Yarns
- 5.3.3. Textiles and Carpets
- 5.3.4. Other Applications
- 5.4. Market Analysis, Insights and Forecast - by End-user Industry
- 5.4.1. Automotive
- 5.4.2. Carpet
- 5.4.3. Textile
- 5.4.4. Other End-user Industries
- 5.5. Market Analysis, Insights and Forecast - by Region
- 5.5.1. Asia Pacific
- 5.5.2. North America
- 5.5.3. Europe
- 5.5.4. South America
- 5.5.5. Middle East and Africa
- 5.1. Market Analysis, Insights and Forecast - by Raw Material
- 6. Global Caprolactam Industry Analysis, Insights and Forecast, 2021-2033
- 6.1. Market Analysis, Insights and Forecast - by Raw Material
- 6.1.1. Phenol
- 6.1.2. Cyclohexane
- 6.2. Market Analysis, Insights and Forecast - by End Product
- 6.2.1. Nylon 6 Resins
- 6.2.2. Nylon 6 Fibers
- 6.2.3. Other End Products
- 6.3. Market Analysis, Insights and Forecast - by Application
- 6.3.1. Engineering Resins and Films
- 6.3.2. Industrial Yarns
- 6.3.3. Textiles and Carpets
- 6.3.4. Other Applications
- 6.4. Market Analysis, Insights and Forecast - by End-user Industry
- 6.4.1. Automotive
- 6.4.2. Carpet
- 6.4.3. Textile
- 6.4.4. Other End-user Industries
- 6.1. Market Analysis, Insights and Forecast - by Raw Material
- 7. Asia Pacific Caprolactam Industry Analysis, Insights and Forecast, 2020-2032
- 7.1. Market Analysis, Insights and Forecast - by Raw Material
- 7.1.1. Phenol
- 7.1.2. Cyclohexane
- 7.2. Market Analysis, Insights and Forecast - by End Product
- 7.2.1. Nylon 6 Resins
- 7.2.2. Nylon 6 Fibers
- 7.2.3. Other End Products
- 7.3. Market Analysis, Insights and Forecast - by Application
- 7.3.1. Engineering Resins and Films
- 7.3.2. Industrial Yarns
- 7.3.3. Textiles and Carpets
- 7.3.4. Other Applications
- 7.4. Market Analysis, Insights and Forecast - by End-user Industry
- 7.4.1. Automotive
- 7.4.2. Carpet
- 7.4.3. Textile
- 7.4.4. Other End-user Industries
- 7.1. Market Analysis, Insights and Forecast - by Raw Material
- 8. North America Caprolactam Industry Analysis, Insights and Forecast, 2020-2032
- 8.1. Market Analysis, Insights and Forecast - by Raw Material
- 8.1.1. Phenol
- 8.1.2. Cyclohexane
- 8.2. Market Analysis, Insights and Forecast - by End Product
- 8.2.1. Nylon 6 Resins
- 8.2.2. Nylon 6 Fibers
- 8.2.3. Other End Products
- 8.3. Market Analysis, Insights and Forecast - by Application
- 8.3.1. Engineering Resins and Films
- 8.3.2. Industrial Yarns
- 8.3.3. Textiles and Carpets
- 8.3.4. Other Applications
- 8.4. Market Analysis, Insights and Forecast - by End-user Industry
- 8.4.1. Automotive
- 8.4.2. Carpet
- 8.4.3. Textile
- 8.4.4. Other End-user Industries
- 8.1. Market Analysis, Insights and Forecast - by Raw Material
- 9. Europe Caprolactam Industry Analysis, Insights and Forecast, 2020-2032
- 9.1. Market Analysis, Insights and Forecast - by Raw Material
- 9.1.1. Phenol
- 9.1.2. Cyclohexane
- 9.2. Market Analysis, Insights and Forecast - by End Product
- 9.2.1. Nylon 6 Resins
- 9.2.2. Nylon 6 Fibers
- 9.2.3. Other End Products
- 9.3. Market Analysis, Insights and Forecast - by Application
- 9.3.1. Engineering Resins and Films
- 9.3.2. Industrial Yarns
- 9.3.3. Textiles and Carpets
- 9.3.4. Other Applications
- 9.4. Market Analysis, Insights and Forecast - by End-user Industry
- 9.4.1. Automotive
- 9.4.2. Carpet
- 9.4.3. Textile
- 9.4.4. Other End-user Industries
- 9.1. Market Analysis, Insights and Forecast - by Raw Material
- 10. South America Caprolactam Industry Analysis, Insights and Forecast, 2020-2032
- 10.1. Market Analysis, Insights and Forecast - by Raw Material
- 10.1.1. Phenol
- 10.1.2. Cyclohexane
- 10.2. Market Analysis, Insights and Forecast - by End Product
- 10.2.1. Nylon 6 Resins
- 10.2.2. Nylon 6 Fibers
- 10.2.3. Other End Products
- 10.3. Market Analysis, Insights and Forecast - by Application
- 10.3.1. Engineering Resins and Films
- 10.3.2. Industrial Yarns
- 10.3.3. Textiles and Carpets
- 10.3.4. Other Applications
- 10.4. Market Analysis, Insights and Forecast - by End-user Industry
- 10.4.1. Automotive
- 10.4.2. Carpet
- 10.4.3. Textile
- 10.4.4. Other End-user Industries
- 10.1. Market Analysis, Insights and Forecast - by Raw Material
- 11. Middle East and Africa Caprolactam Industry Analysis, Insights and Forecast, 2020-2032
- 11.1. Market Analysis, Insights and Forecast - by Raw Material
- 11.1.1. Phenol
- 11.1.2. Cyclohexane
- 11.2. Market Analysis, Insights and Forecast - by End Product
- 11.2.1. Nylon 6 Resins
- 11.2.2. Nylon 6 Fibers
- 11.2.3. Other End Products
- 11.3. Market Analysis, Insights and Forecast - by Application
- 11.3.1. Engineering Resins and Films
- 11.3.2. Industrial Yarns
- 11.3.3. Textiles and Carpets
- 11.3.4. Other Applications
- 11.4. Market Analysis, Insights and Forecast - by End-user Industry
- 11.4.1. Automotive
- 11.4.2. Carpet
- 11.4.3. Textile
- 11.4.4. Other End-user Industries
- 11.1. Market Analysis, Insights and Forecast - by Raw Material
- 12. Competitive Analysis
- 12.1. Company Profiles
- 12.1.1 Sumitomo Chemical Co Ltd
- 12.1.1.1. Company Overview
- 12.1.1.2. Products
- 12.1.1.3. Company Financials
- 12.1.1.4. SWOT Analysis
- 12.1.2 Fujian Jinjiang Petrochemical
- 12.1.2.1. Company Overview
- 12.1.2.2. Products
- 12.1.2.3. Company Financials
- 12.1.2.4. SWOT Analysis
- 12.1.3 Fibrant
- 12.1.3.1. Company Overview
- 12.1.3.2. Products
- 12.1.3.3. Company Financials
- 12.1.3.4. SWOT Analysis
- 12.1.4 AdvanSix Inc
- 12.1.4.1. Company Overview
- 12.1.4.2. Products
- 12.1.4.3. Company Financials
- 12.1.4.4. SWOT Analysis
- 12.1.5 Juhua Group Corporation
- 12.1.5.1. Company Overview
- 12.1.5.2. Products
- 12.1.5.3. Company Financials
- 12.1.5.4. SWOT Analysis
- 12.1.6 UBE Corporation
- 12.1.6.1. Company Overview
- 12.1.6.2. Products
- 12.1.6.3. Company Financials
- 12.1.6.4. SWOT Analysis
- 12.1.7 Fertilisers And Chemicals Travancore Limited (FACT)
- 12.1.7.1. Company Overview
- 12.1.7.2. Products
- 12.1.7.3. Company Financials
- 12.1.7.4. SWOT Analysis
- 12.1.8 Alpek S A B de CV
- 12.1.8.1. Company Overview
- 12.1.8.2. Products
- 12.1.8.3. Company Financials
- 12.1.8.4. SWOT Analysis
- 12.1.9 Toray Industries Inc
- 12.1.9.1. Company Overview
- 12.1.9.2. Products
- 12.1.9.3. Company Financials
- 12.1.9.4. SWOT Analysis
- 12.1.10 Domo Chemicals
- 12.1.10.1. Company Overview
- 12.1.10.2. Products
- 12.1.10.3. Company Financials
- 12.1.10.4. SWOT Analysis
- 12.1.11 Capro Co
- 12.1.11.1. Company Overview
- 12.1.11.2. Products
- 12.1.11.3. Company Financials
- 12.1.11.4. SWOT Analysis
- 12.1.12 China Petrochemical Development Corporation
- 12.1.12.1. Company Overview
- 12.1.12.2. Products
- 12.1.12.3. Company Financials
- 12.1.12.4. SWOT Analysis
- 12.1.13 BASF SE
- 12.1.13.1. Company Overview
- 12.1.13.2. Products
- 12.1.13.3. Company Financials
- 12.1.13.4. SWOT Analysis
- 12.1.14 Shandong Haili Chemical Industry Co Ltd
- 12.1.14.1. Company Overview
- 12.1.14.2. Products
- 12.1.14.3. Company Financials
- 12.1.14.4. SWOT Analysis
- 12.1.15 Lanxess
- 12.1.15.1. Company Overview
- 12.1.15.2. Products
- 12.1.15.3. Company Financials
- 12.1.15.4. SWOT Analysis
- 12.1.16 PJSC Kuibyshevazot
- 12.1.16.1. Company Overview
- 12.1.16.2. Products
- 12.1.16.3. Company Financials
- 12.1.16.4. SWOT Analysis
- 12.1.17 Xuyang Group*List Not Exhaustive
- 12.1.17.1. Company Overview
- 12.1.17.2. Products
- 12.1.17.3. Company Financials
- 12.1.17.4. SWOT Analysis
- 12.1.18 China Petroleum & Chemical Corporation (Sinopec)
- 12.1.18.1. Company Overview
- 12.1.18.2. Products
- 12.1.18.3. Company Financials
- 12.1.18.4. SWOT Analysis
- 12.1.1 Sumitomo Chemical Co Ltd
- 12.2. Market Entropy
- 12.2.1 Company's Key Areas Served
- 12.2.2 Recent Developments
- 12.3. Company Market Share Analysis 2025
- 12.3.1 Top 5 Companies Market Share Analysis
- 12.3.2 Top 3 Companies Market Share Analysis
- 12.4. List of Potential Customers
- 13. Research Methodology
List of Figures
- Figure 1: Global Caprolactam Industry Revenue Breakdown (Million, %) by Region 2025 & 2033
- Figure 2: Asia Pacific Caprolactam Industry Revenue (Million), by Raw Material 2025 & 2033
- Figure 3: Asia Pacific Caprolactam Industry Revenue Share (%), by Raw Material 2025 & 2033
- Figure 4: Asia Pacific Caprolactam Industry Revenue (Million), by End Product 2025 & 2033
- Figure 5: Asia Pacific Caprolactam Industry Revenue Share (%), by End Product 2025 & 2033
- Figure 6: Asia Pacific Caprolactam Industry Revenue (Million), by Application 2025 & 2033
- Figure 7: Asia Pacific Caprolactam Industry Revenue Share (%), by Application 2025 & 2033
- Figure 8: Asia Pacific Caprolactam Industry Revenue (Million), by End-user Industry 2025 & 2033
- Figure 9: Asia Pacific Caprolactam Industry Revenue Share (%), by End-user Industry 2025 & 2033
- Figure 10: Asia Pacific Caprolactam Industry Revenue (Million), by Country 2025 & 2033
- Figure 11: Asia Pacific Caprolactam Industry Revenue Share (%), by Country 2025 & 2033
- Figure 12: North America Caprolactam Industry Revenue (Million), by Raw Material 2025 & 2033
- Figure 13: North America Caprolactam Industry Revenue Share (%), by Raw Material 2025 & 2033
- Figure 14: North America Caprolactam Industry Revenue (Million), by End Product 2025 & 2033
- Figure 15: North America Caprolactam Industry Revenue Share (%), by End Product 2025 & 2033
- Figure 16: North America Caprolactam Industry Revenue (Million), by Application 2025 & 2033
- Figure 17: North America Caprolactam Industry Revenue Share (%), by Application 2025 & 2033
- Figure 18: North America Caprolactam Industry Revenue (Million), by End-user Industry 2025 & 2033
- Figure 19: North America Caprolactam Industry Revenue Share (%), by End-user Industry 2025 & 2033
- Figure 20: North America Caprolactam Industry Revenue (Million), by Country 2025 & 2033
- Figure 21: North America Caprolactam Industry Revenue Share (%), by Country 2025 & 2033
- Figure 22: Europe Caprolactam Industry Revenue (Million), by Raw Material 2025 & 2033
- Figure 23: Europe Caprolactam Industry Revenue Share (%), by Raw Material 2025 & 2033
- Figure 24: Europe Caprolactam Industry Revenue (Million), by End Product 2025 & 2033
- Figure 25: Europe Caprolactam Industry Revenue Share (%), by End Product 2025 & 2033
- Figure 26: Europe Caprolactam Industry Revenue (Million), by Application 2025 & 2033
- Figure 27: Europe Caprolactam Industry Revenue Share (%), by Application 2025 & 2033
- Figure 28: Europe Caprolactam Industry Revenue (Million), by End-user Industry 2025 & 2033
- Figure 29: Europe Caprolactam Industry Revenue Share (%), by End-user Industry 2025 & 2033
- Figure 30: Europe Caprolactam Industry Revenue (Million), by Country 2025 & 2033
- Figure 31: Europe Caprolactam Industry Revenue Share (%), by Country 2025 & 2033
- Figure 32: South America Caprolactam Industry Revenue (Million), by Raw Material 2025 & 2033
- Figure 33: South America Caprolactam Industry Revenue Share (%), by Raw Material 2025 & 2033
- Figure 34: South America Caprolactam Industry Revenue (Million), by End Product 2025 & 2033
- Figure 35: South America Caprolactam Industry Revenue Share (%), by End Product 2025 & 2033
- Figure 36: South America Caprolactam Industry Revenue (Million), by Application 2025 & 2033
- Figure 37: South America Caprolactam Industry Revenue Share (%), by Application 2025 & 2033
- Figure 38: South America Caprolactam Industry Revenue (Million), by End-user Industry 2025 & 2033
- Figure 39: South America Caprolactam Industry Revenue Share (%), by End-user Industry 2025 & 2033
- Figure 40: South America Caprolactam Industry Revenue (Million), by Country 2025 & 2033
- Figure 41: South America Caprolactam Industry Revenue Share (%), by Country 2025 & 2033
- Figure 42: Middle East and Africa Caprolactam Industry Revenue (Million), by Raw Material 2025 & 2033
- Figure 43: Middle East and Africa Caprolactam Industry Revenue Share (%), by Raw Material 2025 & 2033
- Figure 44: Middle East and Africa Caprolactam Industry Revenue (Million), by End Product 2025 & 2033
- Figure 45: Middle East and Africa Caprolactam Industry Revenue Share (%), by End Product 2025 & 2033
- Figure 46: Middle East and Africa Caprolactam Industry Revenue (Million), by Application 2025 & 2033
- Figure 47: Middle East and Africa Caprolactam Industry Revenue Share (%), by Application 2025 & 2033
- Figure 48: Middle East and Africa Caprolactam Industry Revenue (Million), by End-user Industry 2025 & 2033
- Figure 49: Middle East and Africa Caprolactam Industry Revenue Share (%), by End-user Industry 2025 & 2033
- Figure 50: Middle East and Africa Caprolactam Industry Revenue (Million), by Country 2025 & 2033
- Figure 51: Middle East and Africa Caprolactam Industry Revenue Share (%), by Country 2025 & 2033
List of Tables
- Table 1: Global Caprolactam Industry Revenue Million Forecast, by Raw Material 2020 & 2033
- Table 2: Global Caprolactam Industry Revenue Million Forecast, by End Product 2020 & 2033
- Table 3: Global Caprolactam Industry Revenue Million Forecast, by Application 2020 & 2033
- Table 4: Global Caprolactam Industry Revenue Million Forecast, by End-user Industry 2020 & 2033
- Table 5: Global Caprolactam Industry Revenue Million Forecast, by Region 2020 & 2033
- Table 6: Global Caprolactam Industry Revenue Million Forecast, by Raw Material 2020 & 2033
- Table 7: Global Caprolactam Industry Revenue Million Forecast, by End Product 2020 & 2033
- Table 8: Global Caprolactam Industry Revenue Million Forecast, by Application 2020 & 2033
- Table 9: Global Caprolactam Industry Revenue Million Forecast, by End-user Industry 2020 & 2033
- Table 10: Global Caprolactam Industry Revenue Million Forecast, by Country 2020 & 2033
- Table 11: China Caprolactam Industry Revenue (Million) Forecast, by Application 2020 & 2033
- Table 12: Japan Caprolactam Industry Revenue (Million) Forecast, by Application 2020 & 2033
- Table 13: South Korea Caprolactam Industry Revenue (Million) Forecast, by Application 2020 & 2033
- Table 14: Rest of Asia Pacific Caprolactam Industry Revenue (Million) Forecast, by Application 2020 & 2033
- Table 15: Global Caprolactam Industry Revenue Million Forecast, by Raw Material 2020 & 2033
- Table 16: Global Caprolactam Industry Revenue Million Forecast, by End Product 2020 & 2033
- Table 17: Global Caprolactam Industry Revenue Million Forecast, by Application 2020 & 2033
- Table 18: Global Caprolactam Industry Revenue Million Forecast, by End-user Industry 2020 & 2033
- Table 19: Global Caprolactam Industry Revenue Million Forecast, by Country 2020 & 2033
- Table 20: United States Caprolactam Industry Revenue (Million) Forecast, by Application 2020 & 2033
- Table 21: Canada Caprolactam Industry Revenue (Million) Forecast, by Application 2020 & 2033
- Table 22: Mexico Caprolactam Industry Revenue (Million) Forecast, by Application 2020 & 2033
- Table 23: Global Caprolactam Industry Revenue Million Forecast, by Raw Material 2020 & 2033
- Table 24: Global Caprolactam Industry Revenue Million Forecast, by End Product 2020 & 2033
- Table 25: Global Caprolactam Industry Revenue Million Forecast, by Application 2020 & 2033
- Table 26: Global Caprolactam Industry Revenue Million Forecast, by End-user Industry 2020 & 2033
- Table 27: Global Caprolactam Industry Revenue Million Forecast, by Country 2020 & 2033
- Table 28: Germany Caprolactam Industry Revenue (Million) Forecast, by Application 2020 & 2033
- Table 29: United Kingdom Caprolactam Industry Revenue (Million) Forecast, by Application 2020 & 2033
- Table 30: France Caprolactam Industry Revenue (Million) Forecast, by Application 2020 & 2033
- Table 31: Italy Caprolactam Industry Revenue (Million) Forecast, by Application 2020 & 2033
- Table 32: Rest of Europe Caprolactam Industry Revenue (Million) Forecast, by Application 2020 & 2033
- Table 33: Global Caprolactam Industry Revenue Million Forecast, by Raw Material 2020 & 2033
- Table 34: Global Caprolactam Industry Revenue Million Forecast, by End Product 2020 & 2033
- Table 35: Global Caprolactam Industry Revenue Million Forecast, by Application 2020 & 2033
- Table 36: Global Caprolactam Industry Revenue Million Forecast, by End-user Industry 2020 & 2033
- Table 37: Global Caprolactam Industry Revenue Million Forecast, by Country 2020 & 2033
- Table 38: Brazil Caprolactam Industry Revenue (Million) Forecast, by Application 2020 & 2033
- Table 39: Argentina Caprolactam Industry Revenue (Million) Forecast, by Application 2020 & 2033
- Table 40: Rest of South America Caprolactam Industry Revenue (Million) Forecast, by Application 2020 & 2033
- Table 41: Global Caprolactam Industry Revenue Million Forecast, by Raw Material 2020 & 2033
- Table 42: Global Caprolactam Industry Revenue Million Forecast, by End Product 2020 & 2033
- Table 43: Global Caprolactam Industry Revenue Million Forecast, by Application 2020 & 2033
- Table 44: Global Caprolactam Industry Revenue Million Forecast, by End-user Industry 2020 & 2033
- Table 45: Global Caprolactam Industry Revenue Million Forecast, by Country 2020 & 2033
- Table 46: Saudi Arabia Caprolactam Industry Revenue (Million) Forecast, by Application 2020 & 2033
- Table 47: South Africa Caprolactam Industry Revenue (Million) Forecast, by Application 2020 & 2033
- Table 48: Rest of Middle East and Africa Caprolactam Industry Revenue (Million) Forecast, by Application 2020 & 2033
Frequently Asked Questions
1. What is the projected Compound Annual Growth Rate (CAGR) of the Caprolactam Industry?
The projected CAGR is approximately > 3.00%.
2. Which companies are prominent players in the Caprolactam Industry?
Key companies in the market include Sumitomo Chemical Co Ltd, Fujian Jinjiang Petrochemical, Fibrant, AdvanSix Inc, Juhua Group Corporation, UBE Corporation, Fertilisers And Chemicals Travancore Limited (FACT), Alpek S A B de CV, Toray Industries Inc, Domo Chemicals, Capro Co, China Petrochemical Development Corporation, BASF SE, Shandong Haili Chemical Industry Co Ltd, Lanxess, PJSC Kuibyshevazot, Xuyang Group*List Not Exhaustive, China Petroleum & Chemical Corporation (Sinopec).
3. What are the main segments of the Caprolactam Industry?
The market segments include Raw Material, End Product, Application, End-user Industry.
4. Can you provide details about the market size?
The market size is estimated to be USD XX Million as of 2022.
5. What are some drivers contributing to market growth?
Growing Production Capacity of Nylon 6.
6. What are the notable trends driving market growth?
Increasing Demand for Textile and Carpets.
7. Are there any restraints impacting market growth?
Toxicity of caprolactam; Presence of substitute products for Nylon-6.
8. Can you provide examples of recent developments in the market?
In September 2022, Xuyang Group at its Cangzhou Park site started the production of caprolactam post-completion of its second phase of the 300,000 tons per year caprolactam expansion project. With this expansion project, the company's total production capacity increased to 750,000 tons per year.
9. What pricing options are available for accessing the report?
Pricing options include single-user, multi-user, and enterprise licenses priced at USD 4750, USD 5250, and USD 8750 respectively.
10. Is the market size provided in terms of value or volume?
The market size is provided in terms of value, measured in Million.
11. Are there any specific market keywords associated with the report?
Yes, the market keyword associated with the report is "Caprolactam Industry," which aids in identifying and referencing the specific market segment covered.
12. How do I determine which pricing option suits my needs best?
The pricing options vary based on user requirements and access needs. Individual users may opt for single-user licenses, while businesses requiring broader access may choose multi-user or enterprise licenses for cost-effective access to the report.
13. Are there any additional resources or data provided in the Caprolactam Industry report?
While the report offers comprehensive insights, it's advisable to review the specific contents or supplementary materials provided to ascertain if additional resources or data are available.
14. How can I stay updated on further developments or reports in the Caprolactam Industry?
To stay informed about further developments, trends, and reports in the Caprolactam Industry, consider subscribing to industry newsletters, following relevant companies and organizations, or regularly checking reputable industry news sources and publications.
Methodology
Step 1 - Identification of Relevant Samples Size from Population Database


Step 2 - Approaches for Defining Global Market Size (Value, Volume* & Price*)

Note*: In applicable scenarios
Step 3 - Data Sources
Primary Research
- Web Analytics
- Survey Reports
- Research Institute
- Latest Research Reports
- Opinion Leaders
Secondary Research
- Annual Reports
- White Paper
- Latest Press Release
- Industry Association
- Paid Database
- Investor Presentations

Step 4 - Data Triangulation
Involves using different sources of information in order to increase the validity of a study
These sources are likely to be stakeholders in a program - participants, other researchers, program staff, other community members, and so on.
Then we put all data in single framework & apply various statistical tools to find out the dynamic on the market.
During the analysis stage, feedback from the stakeholder groups would be compared to determine areas of agreement as well as areas of divergence