

Key Insights
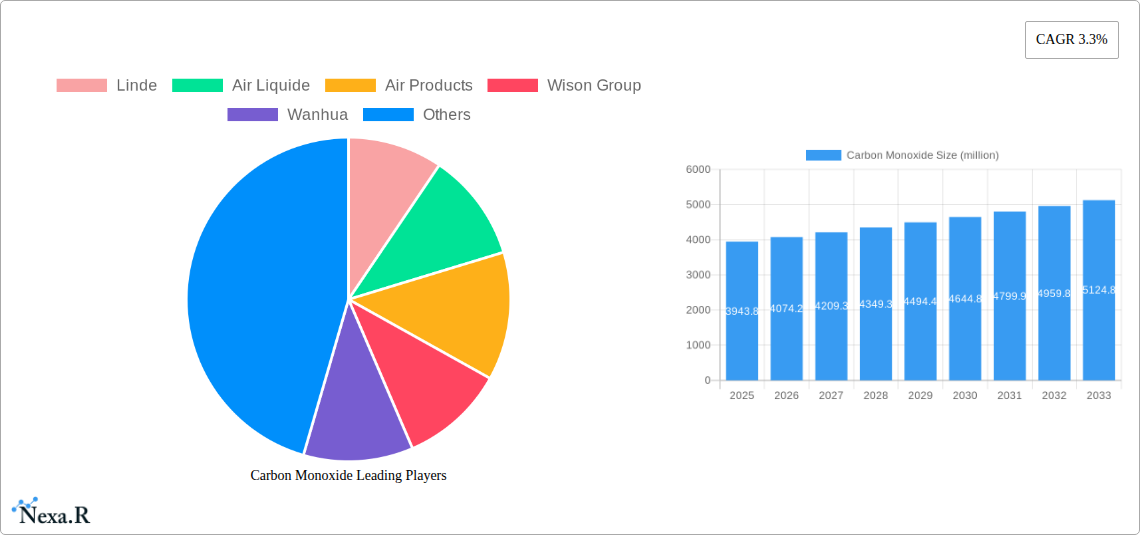
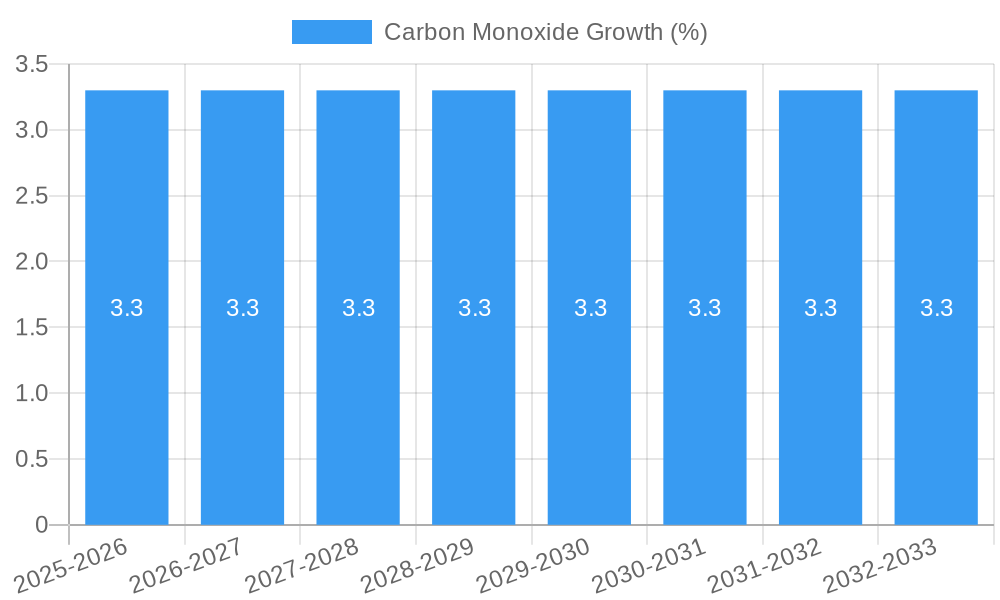
The global Carbon Monoxide market is poised for steady growth, with a projected market size of USD 3,943.8 million and an anticipated Compound Annual Growth Rate (CAGR) of 3.3% from 2025 to 2033. This expansion is primarily driven by the escalating demand from core industrial applications, particularly within the chemical and metal industries. The chemical sector relies heavily on carbon monoxide as a crucial feedstock for the production of various chemicals, including methanol, acetic acid, and phosgene, all of which are integral to a wide array of consumer and industrial goods. Similarly, the metal industry utilizes carbon monoxide in processes like steelmaking and metal refining, where its reducing properties are indispensable. Emerging applications in sectors like electronics, though currently smaller in scale, are expected to contribute to the market's overall buoyancy.
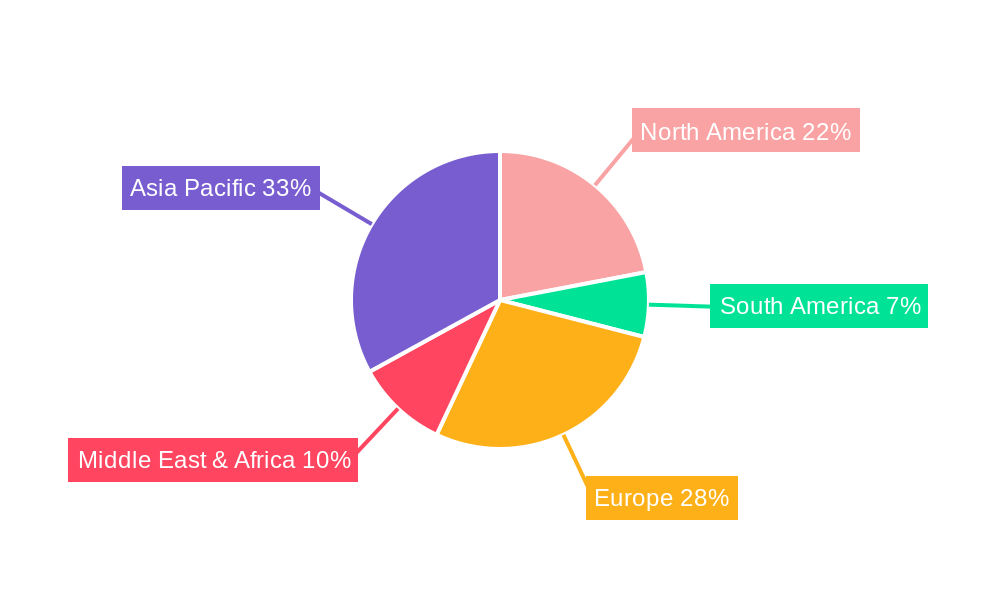
Key trends shaping the Carbon Monoxide market include advancements in production technologies that enhance efficiency and reduce environmental impact, alongside a growing emphasis on stringent safety regulations governing its handling and transportation. The market is also witnessing a nuanced shift in its application segmentation, with commercial grade carbon monoxide continuing to dominate due to its widespread use in traditional industries, while the electronic grade segment, although niche, shows promise for high-value applications. Geographically, Asia Pacific, led by China and India, is anticipated to remain the largest and fastest-growing regional market, fueled by robust industrialization and a burgeoning manufacturing base. North America and Europe are also significant contributors, driven by established industrial infrastructure and ongoing technological innovations. Restraints, such as the inherent toxicity and handling challenges associated with carbon monoxide, alongside fluctuating raw material costs for its production, are factors that market players will need to strategically navigate to capitalize on the existing growth opportunities.
Comprehensive Carbon Monoxide Market Report: Dynamics, Growth, and Future Outlook (2019–2033)
This in-depth report provides a thorough analysis of the global Carbon Monoxide (CO) market, meticulously examining its dynamics, growth trajectories, and future potential. Covering the historical period from 2019 to 2024, the base year of 2025, and projecting growth through the forecast period of 2025–2033, this study offers actionable insights for industry stakeholders. We delve into key market segments, dominant regions, technological advancements, and the competitive landscape, providing quantitative data and qualitative analysis crucial for strategic decision-making. The report incorporates high-traffic keywords, targeting industry professionals seeking to understand market concentration, technological innovation drivers, regulatory frameworks, competitive product substitutes, end-user demographics, M&A trends, market size evolution, adoption rates, technological disruptions, consumer behavior shifts, and dominant regional and country-specific growth drivers. The parent market encompasses industrial gases, with the child market specifically focusing on carbon monoxide. All values are presented in million units, ensuring clarity and comparability.
Carbon Monoxide Market Dynamics & Structure
The global Carbon Monoxide market exhibits a moderate to high concentration, with key players like Linde, Air Liquide, and Air Products holding substantial market shares. Technological innovation remains a pivotal driver, particularly in enhancing production efficiency and purity for electronic-grade CO. Stringent environmental regulations, while posing compliance challenges, also spur innovation towards cleaner production methods. Competitive product substitutes, though limited for certain high-purity applications, exist in the form of alternative synthesis gases or specific chemical intermediaries. End-user demographics are increasingly diverse, spanning the chemical industry, metal manufacturing, electronics, and other specialized sectors. Mergers and acquisitions (M&A) trends, while not as aggressive as in some broader industrial gas markets, are observed, signaling strategic consolidation to leverage economies of scale and expand geographical reach.
- Market Concentration: Moderate to High, with major global industrial gas producers dominating production.
- Technological Innovation Drivers: Increased demand for higher purity CO, cost optimization in production, and development of advanced CO delivery systems.
- Regulatory Frameworks: Increasingly stringent environmental regulations related to emissions and industrial safety standards influence production and handling.
- Competitive Product Substitutes: Limited for critical high-purity applications, but alternative synthesis routes or direct chemical feedstocks can substitute CO in certain processes.
- End-User Demographics: Diversified across Chemical Industry (XX million units), Metal Industry (XX million units), Electronic Industry (XX million units), and Others (XX million units).
- M&A Trends: Strategic acquisitions aimed at market consolidation and expansion of service offerings.
Carbon Monoxide Growth Trends & Insights
The Carbon Monoxide market is poised for steady growth, driven by escalating demand from its core applications. Historical data from 2019–2024 shows a consistent upward trajectory, fueled by advancements in chemical synthesis and the burgeoning electronics sector. The base year 2025 is expected to witness a market size of approximately XX million units, with a projected Compound Annual Growth Rate (CAGR) of around X.X% during the forecast period of 2025–2033. Adoption rates for electronic-grade CO are particularly high, as the semiconductor industry continues its expansion and demand for high-purity materials intensifies. Technological disruptions, such as the development of more energy-efficient CO production methods and improved containment and transportation technologies, are further accelerating market penetration. Consumer behavior shifts, though less direct in this industrial context, are influenced by the increasing demand for sophisticated electronic devices and the growing emphasis on sustainability in manufacturing processes, both of which indirectly boost CO demand. The market penetration of specialized CO applications is expected to rise as research and development unlock new industrial uses and optimize existing ones. The total market size is projected to reach approximately XX million units by 2033.
- Market Size Evolution: From XX million units in 2019 to an estimated XX million units by 2033.
- Adoption Rates: Steadily increasing, with electronic-grade CO adoption outpacing others due to the semiconductor industry's growth.
- Technological Disruptions: Innovations in production efficiency, purity enhancement, and safer handling are key disruptors.
- Consumer Behavior Shifts: Indirect influence through demand for advanced electronics and sustainable manufacturing practices.
- Market Penetration: Growing, especially in specialized chemical synthesis and advanced material production.
- CAGR (2025–2033): Projected at X.X%.
Dominant Regions, Countries, or Segments in Carbon Monoxide
The Chemical Industry, as an application segment, currently dominates the global Carbon Monoxide market, accounting for a significant XX% of the total market share in the base year of 2025. This dominance is attributed to CO's extensive use as a fundamental feedstock in the production of various chemicals, including methanol, phosgene, and oxo alcohols. Regions with strong chemical manufacturing bases, such as Asia-Pacific (particularly China) and North America, are leading the demand. The Metal Industry represents the second-largest segment, utilizing CO in processes like metal refining and the production of syngas for iron and steel manufacturing. Economic policies supporting industrial growth and infrastructure development in these regions are key drivers. The Electronic Industry, while a smaller segment presently, is exhibiting the highest growth potential, with an estimated CAGR of X.X% during the forecast period. This is driven by the demand for high-purity electronic-grade CO in semiconductor fabrication, display manufacturing, and other advanced electronics applications. Countries like South Korea, Taiwan, and the United States are at the forefront of this segment's growth. Commercial Grade CO remains the dominant type due to its widespread application across various industries, however, Electronic Grade CO is witnessing a surge in demand and market share expansion.
- Dominant Application Segment: Chemical Industry (XX% market share in 2025).
- Key Drivers: Extensive use in methanol, phosgene, and oxo alcohol production.
- Dominant Regions: Asia-Pacific (China), North America.
- Second Largest Segment: Metal Industry.
- Key Drivers: Metal refining, syngas production for iron and steel.
- Economic Policies: Support for industrial growth and infrastructure.
- High Growth Potential Segment: Electronic Industry.
- Estimated CAGR (2025–2033): X.X%.
- Key Drivers: Semiconductor fabrication, display manufacturing.
- Leading Countries: South Korea, Taiwan, United States.
- Dominant Type: Commercial Grade CO.
- Rising Type: Electronic Grade CO, with significant market share expansion.
Carbon Monoxide Product Landscape
The Carbon Monoxide product landscape is characterized by continuous innovation aimed at enhancing purity, efficiency, and safety. Manufacturers are focusing on developing CO with higher ppm levels of impurities to meet the stringent demands of the electronic industry, particularly for critical semiconductor manufacturing processes. Advancements in cryogenic distillation and membrane separation technologies are enabling the production of ultra-high purity CO. Performance metrics are increasingly scrutinized, with a focus on reducing trace contaminants like moisture, oxygen, and hydrocarbons to levels measured in parts per billion (ppb). Unique selling propositions revolve around reliable supply chains, customized purity grades, and specialized delivery systems designed for on-site generation or safe, efficient transportation of liquefied CO. Technological advancements are also being made in CO capture and utilization, presenting potential for a more sustainable product lifecycle.
Key Drivers, Barriers & Challenges in Carbon Monoxide
Key Drivers:
- Technological Advancements: Innovations in CO production and purification technologies are driving efficiency and expanding applications.
- Growing Chemical Industry: Robust demand for CO as a key feedstock in the synthesis of various chemicals.
- Expanding Electronics Sector: Increasing need for high-purity CO in semiconductor manufacturing and other advanced electronics.
- Economic Growth: Industrial expansion in emerging economies fuels demand for CO across sectors.
Barriers & Challenges:
- Safety and Handling Concerns: CO is a toxic gas, requiring stringent safety protocols and specialized infrastructure for production, transportation, and storage, leading to higher operational costs.
- Regulatory Hurdles: Environmental and safety regulations can increase compliance costs and limit production expansion in certain regions.
- Supply Chain Volatility: Fluctuations in raw material prices and logistical challenges can impact the cost-effectiveness and availability of CO.
- Competitive Pressures: While direct substitutes are limited, alternative chemical synthesis routes can pose competitive challenges in specific applications.
- Energy Intensity of Production: Traditional CO production methods can be energy-intensive, leading to concerns about environmental impact and operational costs.
Emerging Opportunities in Carbon Monoxide
Emerging opportunities in the Carbon Monoxide market lie in the development of more sustainable and cost-effective production methods, such as advanced catalytic processes and CO capture technologies. The growing demand for high-purity CO in emerging applications like advanced battery manufacturing and specialized materials science presents a significant untapped market. Furthermore, the increasing global focus on decarbonization and the circular economy could unlock opportunities for CO utilization in producing synthetic fuels and chemicals, transforming it from a byproduct to a valuable resource. Evolving consumer preferences for more energy-efficient and environmentally friendly products indirectly fuel the need for advanced manufacturing processes that rely on high-quality industrial gases like CO.
Growth Accelerators in the Carbon Monoxide Industry
Growth in the Carbon Monoxide industry is being significantly accelerated by several key catalysts. Technological breakthroughs in direct synthesis of CO from renewable sources or waste streams offer a path towards more sustainable and potentially lower-cost production. Strategic partnerships between industrial gas suppliers and end-users in the electronics and chemical sectors are crucial for tailoring product specifications and ensuring reliable supply, thereby fostering market expansion. Furthermore, the continuous R&D investment in developing novel applications for CO in areas like advanced materials and pharmaceuticals is paving the way for new market segments and increased demand. Geographic expansion into developing regions with rapidly industrializing economies also serves as a major growth accelerator.
Key Players Shaping the Carbon Monoxide Market
- Linde
- Air Liquide
- Air Products
- Wison Group
- Wanhua
- Sipchem
- Messer
- Tosoh
- Yingde Gases
Notable Milestones in Carbon Monoxide Sector
- 2020 (Q3): Major industrial gas producers announce significant investments in enhancing CO production capacity to meet rising demand from the electronics sector.
- 2021 (Q1): Development of a new, more energy-efficient catalytic process for CO production is reported, promising reduced operational costs.
- 2022 (Q4): Linde acquires a significant stake in a specialized chemical producer, bolstering its CO supply chain for the chemical industry.
- 2023 (Q2): Air Liquide announces a strategic collaboration with a semiconductor manufacturer to ensure a secure supply of ultra-high purity electronic-grade CO.
- 2024 (Q1): Wanhua Chemical Group expands its CO production capabilities, targeting both domestic and international markets.
In-Depth Carbon Monoxide Market Outlook
The future outlook for the Carbon Monoxide market is exceptionally promising, driven by a confluence of accelerating factors. Continued technological innovation in production and purification will unlock new, high-value applications, particularly in the fast-growing electronics and advanced materials sectors. Strategic alliances and mergers will solidify market positions and enhance global reach. The increasing emphasis on sustainability and the circular economy presents an opportunity for CO to be repurposed and utilized in novel ways, further diversifying its market. The projected growth trajectory suggests a robust expansion, making the CO market an attractive landscape for investment and strategic development in the coming years.
Carbon Monoxide Segmentation
-
1. Application
- 1.1. Chemical Industry
- 1.2. Metal Industry
- 1.3. Electronic Industry
- 1.4. Others
-
2. Types
- 2.1. Commercial Grade
- 2.2. Electronic Grade
Carbon Monoxide Segmentation By Geography
-
1. North America
- 1.1. United States
- 1.2. Canada
- 1.3. Mexico
-
2. South America
- 2.1. Brazil
- 2.2. Argentina
- 2.3. Rest of South America
-
3. Europe
- 3.1. United Kingdom
- 3.2. Germany
- 3.3. France
- 3.4. Italy
- 3.5. Spain
- 3.6. Russia
- 3.7. Benelux
- 3.8. Nordics
- 3.9. Rest of Europe
-
4. Middle East & Africa
- 4.1. Turkey
- 4.2. Israel
- 4.3. GCC
- 4.4. North Africa
- 4.5. South Africa
- 4.6. Rest of Middle East & Africa
-
5. Asia Pacific
- 5.1. China
- 5.2. India
- 5.3. Japan
- 5.4. South Korea
- 5.5. ASEAN
- 5.6. Oceania
- 5.7. Rest of Asia Pacific
Carbon Monoxide REPORT HIGHLIGHTS
| Aspects | Details |
|---|---|
| Study Period | 2019-2033 |
| Base Year | 2024 |
| Estimated Year | 2025 |
| Forecast Period | 2025-2033 |
| Historical Period | 2019-2024 |
| Growth Rate | CAGR of 3.3% from 2019-2033 |
| Segmentation |
|
Table of Contents
- 1. Introduction
- 1.1. Research Scope
- 1.2. Market Segmentation
- 1.3. Research Methodology
- 1.4. Definitions and Assumptions
- 2. Executive Summary
- 2.1. Introduction
- 3. Market Dynamics
- 3.1. Introduction
- 3.2. Market Drivers
- 3.3. Market Restrains
- 3.4. Market Trends
- 4. Market Factor Analysis
- 4.1. Porters Five Forces
- 4.2. Supply/Value Chain
- 4.3. PESTEL analysis
- 4.4. Market Entropy
- 4.5. Patent/Trademark Analysis
- 5. Global Carbon Monoxide Analysis, Insights and Forecast, 2019-2031
- 5.1. Market Analysis, Insights and Forecast - by Application
- 5.1.1. Chemical Industry
- 5.1.2. Metal Industry
- 5.1.3. Electronic Industry
- 5.1.4. Others
- 5.2. Market Analysis, Insights and Forecast - by Types
- 5.2.1. Commercial Grade
- 5.2.2. Electronic Grade
- 5.3. Market Analysis, Insights and Forecast - by Region
- 5.3.1. North America
- 5.3.2. South America
- 5.3.3. Europe
- 5.3.4. Middle East & Africa
- 5.3.5. Asia Pacific
- 5.1. Market Analysis, Insights and Forecast - by Application
- 6. North America Carbon Monoxide Analysis, Insights and Forecast, 2019-2031
- 6.1. Market Analysis, Insights and Forecast - by Application
- 6.1.1. Chemical Industry
- 6.1.2. Metal Industry
- 6.1.3. Electronic Industry
- 6.1.4. Others
- 6.2. Market Analysis, Insights and Forecast - by Types
- 6.2.1. Commercial Grade
- 6.2.2. Electronic Grade
- 6.1. Market Analysis, Insights and Forecast - by Application
- 7. South America Carbon Monoxide Analysis, Insights and Forecast, 2019-2031
- 7.1. Market Analysis, Insights and Forecast - by Application
- 7.1.1. Chemical Industry
- 7.1.2. Metal Industry
- 7.1.3. Electronic Industry
- 7.1.4. Others
- 7.2. Market Analysis, Insights and Forecast - by Types
- 7.2.1. Commercial Grade
- 7.2.2. Electronic Grade
- 7.1. Market Analysis, Insights and Forecast - by Application
- 8. Europe Carbon Monoxide Analysis, Insights and Forecast, 2019-2031
- 8.1. Market Analysis, Insights and Forecast - by Application
- 8.1.1. Chemical Industry
- 8.1.2. Metal Industry
- 8.1.3. Electronic Industry
- 8.1.4. Others
- 8.2. Market Analysis, Insights and Forecast - by Types
- 8.2.1. Commercial Grade
- 8.2.2. Electronic Grade
- 8.1. Market Analysis, Insights and Forecast - by Application
- 9. Middle East & Africa Carbon Monoxide Analysis, Insights and Forecast, 2019-2031
- 9.1. Market Analysis, Insights and Forecast - by Application
- 9.1.1. Chemical Industry
- 9.1.2. Metal Industry
- 9.1.3. Electronic Industry
- 9.1.4. Others
- 9.2. Market Analysis, Insights and Forecast - by Types
- 9.2.1. Commercial Grade
- 9.2.2. Electronic Grade
- 9.1. Market Analysis, Insights and Forecast - by Application
- 10. Asia Pacific Carbon Monoxide Analysis, Insights and Forecast, 2019-2031
- 10.1. Market Analysis, Insights and Forecast - by Application
- 10.1.1. Chemical Industry
- 10.1.2. Metal Industry
- 10.1.3. Electronic Industry
- 10.1.4. Others
- 10.2. Market Analysis, Insights and Forecast - by Types
- 10.2.1. Commercial Grade
- 10.2.2. Electronic Grade
- 10.1. Market Analysis, Insights and Forecast - by Application
- 11. Competitive Analysis
- 11.1. Global Market Share Analysis 2024
- 11.2. Company Profiles
- 11.2.1 Linde
- 11.2.1.1. Overview
- 11.2.1.2. Products
- 11.2.1.3. SWOT Analysis
- 11.2.1.4. Recent Developments
- 11.2.1.5. Financials (Based on Availability)
- 11.2.2 Air Liquide
- 11.2.2.1. Overview
- 11.2.2.2. Products
- 11.2.2.3. SWOT Analysis
- 11.2.2.4. Recent Developments
- 11.2.2.5. Financials (Based on Availability)
- 11.2.3 Air Products
- 11.2.3.1. Overview
- 11.2.3.2. Products
- 11.2.3.3. SWOT Analysis
- 11.2.3.4. Recent Developments
- 11.2.3.5. Financials (Based on Availability)
- 11.2.4 Wison Group
- 11.2.4.1. Overview
- 11.2.4.2. Products
- 11.2.4.3. SWOT Analysis
- 11.2.4.4. Recent Developments
- 11.2.4.5. Financials (Based on Availability)
- 11.2.5 Wanhua
- 11.2.5.1. Overview
- 11.2.5.2. Products
- 11.2.5.3. SWOT Analysis
- 11.2.5.4. Recent Developments
- 11.2.5.5. Financials (Based on Availability)
- 11.2.6 Sipchem
- 11.2.6.1. Overview
- 11.2.6.2. Products
- 11.2.6.3. SWOT Analysis
- 11.2.6.4. Recent Developments
- 11.2.6.5. Financials (Based on Availability)
- 11.2.7 Messer
- 11.2.7.1. Overview
- 11.2.7.2. Products
- 11.2.7.3. SWOT Analysis
- 11.2.7.4. Recent Developments
- 11.2.7.5. Financials (Based on Availability)
- 11.2.8 Tosoh
- 11.2.8.1. Overview
- 11.2.8.2. Products
- 11.2.8.3. SWOT Analysis
- 11.2.8.4. Recent Developments
- 11.2.8.5. Financials (Based on Availability)
- 11.2.9 Yingde Gases
- 11.2.9.1. Overview
- 11.2.9.2. Products
- 11.2.9.3. SWOT Analysis
- 11.2.9.4. Recent Developments
- 11.2.9.5. Financials (Based on Availability)
- 11.2.1 Linde
List of Figures
- Figure 1: Global Carbon Monoxide Revenue Breakdown (million, %) by Region 2024 & 2032
- Figure 2: North America Carbon Monoxide Revenue (million), by Application 2024 & 2032
- Figure 3: North America Carbon Monoxide Revenue Share (%), by Application 2024 & 2032
- Figure 4: North America Carbon Monoxide Revenue (million), by Types 2024 & 2032
- Figure 5: North America Carbon Monoxide Revenue Share (%), by Types 2024 & 2032
- Figure 6: North America Carbon Monoxide Revenue (million), by Country 2024 & 2032
- Figure 7: North America Carbon Monoxide Revenue Share (%), by Country 2024 & 2032
- Figure 8: South America Carbon Monoxide Revenue (million), by Application 2024 & 2032
- Figure 9: South America Carbon Monoxide Revenue Share (%), by Application 2024 & 2032
- Figure 10: South America Carbon Monoxide Revenue (million), by Types 2024 & 2032
- Figure 11: South America Carbon Monoxide Revenue Share (%), by Types 2024 & 2032
- Figure 12: South America Carbon Monoxide Revenue (million), by Country 2024 & 2032
- Figure 13: South America Carbon Monoxide Revenue Share (%), by Country 2024 & 2032
- Figure 14: Europe Carbon Monoxide Revenue (million), by Application 2024 & 2032
- Figure 15: Europe Carbon Monoxide Revenue Share (%), by Application 2024 & 2032
- Figure 16: Europe Carbon Monoxide Revenue (million), by Types 2024 & 2032
- Figure 17: Europe Carbon Monoxide Revenue Share (%), by Types 2024 & 2032
- Figure 18: Europe Carbon Monoxide Revenue (million), by Country 2024 & 2032
- Figure 19: Europe Carbon Monoxide Revenue Share (%), by Country 2024 & 2032
- Figure 20: Middle East & Africa Carbon Monoxide Revenue (million), by Application 2024 & 2032
- Figure 21: Middle East & Africa Carbon Monoxide Revenue Share (%), by Application 2024 & 2032
- Figure 22: Middle East & Africa Carbon Monoxide Revenue (million), by Types 2024 & 2032
- Figure 23: Middle East & Africa Carbon Monoxide Revenue Share (%), by Types 2024 & 2032
- Figure 24: Middle East & Africa Carbon Monoxide Revenue (million), by Country 2024 & 2032
- Figure 25: Middle East & Africa Carbon Monoxide Revenue Share (%), by Country 2024 & 2032
- Figure 26: Asia Pacific Carbon Monoxide Revenue (million), by Application 2024 & 2032
- Figure 27: Asia Pacific Carbon Monoxide Revenue Share (%), by Application 2024 & 2032
- Figure 28: Asia Pacific Carbon Monoxide Revenue (million), by Types 2024 & 2032
- Figure 29: Asia Pacific Carbon Monoxide Revenue Share (%), by Types 2024 & 2032
- Figure 30: Asia Pacific Carbon Monoxide Revenue (million), by Country 2024 & 2032
- Figure 31: Asia Pacific Carbon Monoxide Revenue Share (%), by Country 2024 & 2032
List of Tables
- Table 1: Global Carbon Monoxide Revenue million Forecast, by Region 2019 & 2032
- Table 2: Global Carbon Monoxide Revenue million Forecast, by Application 2019 & 2032
- Table 3: Global Carbon Monoxide Revenue million Forecast, by Types 2019 & 2032
- Table 4: Global Carbon Monoxide Revenue million Forecast, by Region 2019 & 2032
- Table 5: Global Carbon Monoxide Revenue million Forecast, by Application 2019 & 2032
- Table 6: Global Carbon Monoxide Revenue million Forecast, by Types 2019 & 2032
- Table 7: Global Carbon Monoxide Revenue million Forecast, by Country 2019 & 2032
- Table 8: United States Carbon Monoxide Revenue (million) Forecast, by Application 2019 & 2032
- Table 9: Canada Carbon Monoxide Revenue (million) Forecast, by Application 2019 & 2032
- Table 10: Mexico Carbon Monoxide Revenue (million) Forecast, by Application 2019 & 2032
- Table 11: Global Carbon Monoxide Revenue million Forecast, by Application 2019 & 2032
- Table 12: Global Carbon Monoxide Revenue million Forecast, by Types 2019 & 2032
- Table 13: Global Carbon Monoxide Revenue million Forecast, by Country 2019 & 2032
- Table 14: Brazil Carbon Monoxide Revenue (million) Forecast, by Application 2019 & 2032
- Table 15: Argentina Carbon Monoxide Revenue (million) Forecast, by Application 2019 & 2032
- Table 16: Rest of South America Carbon Monoxide Revenue (million) Forecast, by Application 2019 & 2032
- Table 17: Global Carbon Monoxide Revenue million Forecast, by Application 2019 & 2032
- Table 18: Global Carbon Monoxide Revenue million Forecast, by Types 2019 & 2032
- Table 19: Global Carbon Monoxide Revenue million Forecast, by Country 2019 & 2032
- Table 20: United Kingdom Carbon Monoxide Revenue (million) Forecast, by Application 2019 & 2032
- Table 21: Germany Carbon Monoxide Revenue (million) Forecast, by Application 2019 & 2032
- Table 22: France Carbon Monoxide Revenue (million) Forecast, by Application 2019 & 2032
- Table 23: Italy Carbon Monoxide Revenue (million) Forecast, by Application 2019 & 2032
- Table 24: Spain Carbon Monoxide Revenue (million) Forecast, by Application 2019 & 2032
- Table 25: Russia Carbon Monoxide Revenue (million) Forecast, by Application 2019 & 2032
- Table 26: Benelux Carbon Monoxide Revenue (million) Forecast, by Application 2019 & 2032
- Table 27: Nordics Carbon Monoxide Revenue (million) Forecast, by Application 2019 & 2032
- Table 28: Rest of Europe Carbon Monoxide Revenue (million) Forecast, by Application 2019 & 2032
- Table 29: Global Carbon Monoxide Revenue million Forecast, by Application 2019 & 2032
- Table 30: Global Carbon Monoxide Revenue million Forecast, by Types 2019 & 2032
- Table 31: Global Carbon Monoxide Revenue million Forecast, by Country 2019 & 2032
- Table 32: Turkey Carbon Monoxide Revenue (million) Forecast, by Application 2019 & 2032
- Table 33: Israel Carbon Monoxide Revenue (million) Forecast, by Application 2019 & 2032
- Table 34: GCC Carbon Monoxide Revenue (million) Forecast, by Application 2019 & 2032
- Table 35: North Africa Carbon Monoxide Revenue (million) Forecast, by Application 2019 & 2032
- Table 36: South Africa Carbon Monoxide Revenue (million) Forecast, by Application 2019 & 2032
- Table 37: Rest of Middle East & Africa Carbon Monoxide Revenue (million) Forecast, by Application 2019 & 2032
- Table 38: Global Carbon Monoxide Revenue million Forecast, by Application 2019 & 2032
- Table 39: Global Carbon Monoxide Revenue million Forecast, by Types 2019 & 2032
- Table 40: Global Carbon Monoxide Revenue million Forecast, by Country 2019 & 2032
- Table 41: China Carbon Monoxide Revenue (million) Forecast, by Application 2019 & 2032
- Table 42: India Carbon Monoxide Revenue (million) Forecast, by Application 2019 & 2032
- Table 43: Japan Carbon Monoxide Revenue (million) Forecast, by Application 2019 & 2032
- Table 44: South Korea Carbon Monoxide Revenue (million) Forecast, by Application 2019 & 2032
- Table 45: ASEAN Carbon Monoxide Revenue (million) Forecast, by Application 2019 & 2032
- Table 46: Oceania Carbon Monoxide Revenue (million) Forecast, by Application 2019 & 2032
- Table 47: Rest of Asia Pacific Carbon Monoxide Revenue (million) Forecast, by Application 2019 & 2032
Frequently Asked Questions
1. What is the projected Compound Annual Growth Rate (CAGR) of the Carbon Monoxide?
The projected CAGR is approximately 3.3%.
2. Which companies are prominent players in the Carbon Monoxide?
Key companies in the market include Linde, Air Liquide, Air Products, Wison Group, Wanhua, Sipchem, Messer, Tosoh, Yingde Gases.
3. What are the main segments of the Carbon Monoxide?
The market segments include Application, Types.
4. Can you provide details about the market size?
The market size is estimated to be USD 3943.8 million as of 2022.
5. What are some drivers contributing to market growth?
N/A
6. What are the notable trends driving market growth?
N/A
7. Are there any restraints impacting market growth?
N/A
8. Can you provide examples of recent developments in the market?
N/A
9. What pricing options are available for accessing the report?
Pricing options include single-user, multi-user, and enterprise licenses priced at USD 5900.00, USD 8850.00, and USD 11800.00 respectively.
10. Is the market size provided in terms of value or volume?
The market size is provided in terms of value, measured in million.
11. Are there any specific market keywords associated with the report?
Yes, the market keyword associated with the report is "Carbon Monoxide," which aids in identifying and referencing the specific market segment covered.
12. How do I determine which pricing option suits my needs best?
The pricing options vary based on user requirements and access needs. Individual users may opt for single-user licenses, while businesses requiring broader access may choose multi-user or enterprise licenses for cost-effective access to the report.
13. Are there any additional resources or data provided in the Carbon Monoxide report?
While the report offers comprehensive insights, it's advisable to review the specific contents or supplementary materials provided to ascertain if additional resources or data are available.
14. How can I stay updated on further developments or reports in the Carbon Monoxide?
To stay informed about further developments, trends, and reports in the Carbon Monoxide, consider subscribing to industry newsletters, following relevant companies and organizations, or regularly checking reputable industry news sources and publications.
Methodology
Step 1 - Identification of Relevant Samples Size from Population Database


Step 2 - Approaches for Defining Global Market Size (Value, Volume* & Price*)

Note*: In applicable scenarios
Step 3 - Data Sources
Primary Research
- Web Analytics
- Survey Reports
- Research Institute
- Latest Research Reports
- Opinion Leaders
Secondary Research
- Annual Reports
- White Paper
- Latest Press Release
- Industry Association
- Paid Database
- Investor Presentations

Step 4 - Data Triangulation
Involves using different sources of information in order to increase the validity of a study
These sources are likely to be stakeholders in a program - participants, other researchers, program staff, other community members, and so on.
Then we put all data in single framework & apply various statistical tools to find out the dynamic on the market.
During the analysis stage, feedback from the stakeholder groups would be compared to determine areas of agreement as well as areas of divergence
