

Key Insights
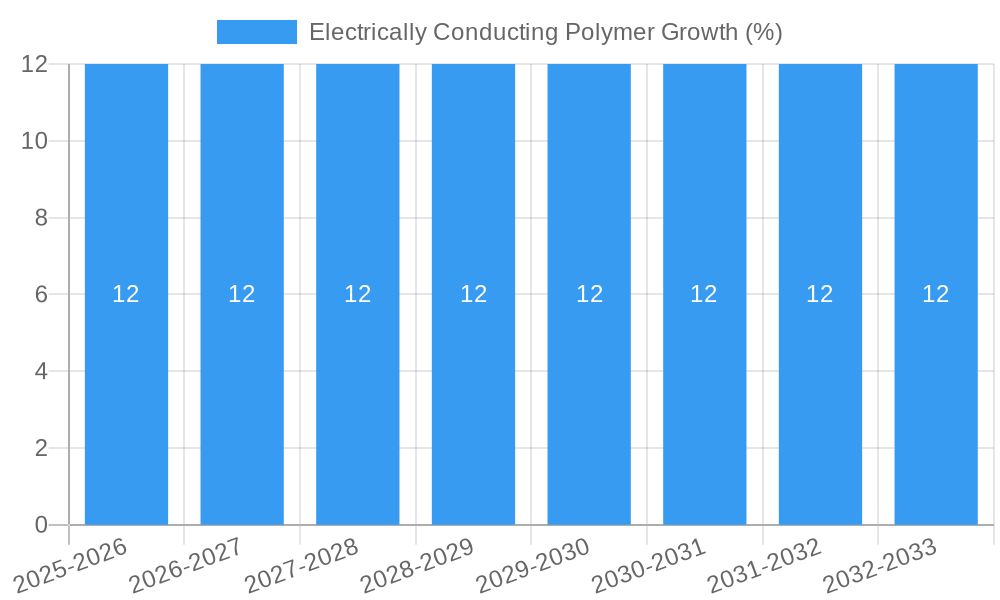
The global market for Electrically Conducting Polymers is poised for significant expansion, driven by the increasing demand across diverse high-growth sectors. With an estimated market size of approximately $5.5 billion in 2025, the sector is projected to experience a Compound Annual Growth Rate (CAGR) of around 12%, reaching an estimated value of over $10 billion by 2033. This robust growth is primarily fueled by the escalating adoption of these advanced materials in the automotive industry for components like sensors, antennas, and EMI shielding, alongside their critical role in the rapidly evolving consumer electronics landscape for flexible displays, wearable devices, and advanced battery technologies. The aerospace sector's pursuit of lightweight yet highly functional materials for structural components and advanced avionics also contributes to market momentum. Furthermore, the biosciences sector is increasingly leveraging electrically conducting polymers for novel drug delivery systems, biosensors, and implantable devices, opening up substantial new avenues for market penetration.
The market's expansion is underpinned by key trends such as the miniaturization of electronic devices, the growing need for advanced materials in electric vehicles (EVs) and renewable energy systems, and the continuous innovation in polymer synthesis and processing techniques. Advancements in Composite Polymers and Structural Polymers are enabling enhanced conductivity, flexibility, and durability, making them more attractive alternatives to traditional conductive materials. However, the market faces certain restraints, including the relatively high cost of some specialized conducting polymers compared to conventional materials, and the complexity associated with large-scale manufacturing and integration in certain applications. Despite these challenges, the relentless drive for innovation, coupled with the strategic initiatives of major industry players like Henkel, H.B. Fuller, 3M, and DOW Corning, are expected to propel the Electrically Conducting Polymer market towards sustained and impressive growth in the coming years.
This comprehensive report delves into the dynamic Electrically Conducting Polymer (ECP) market, forecasting significant expansion driven by innovations in semiconductor, consumer electronics, and automotive applications. We analyze parent and child markets, providing deep insights into the global landscape from 2019 to 2033, with a base year of 2025.
Electrically Conducting Polymer Market Dynamics & Structure
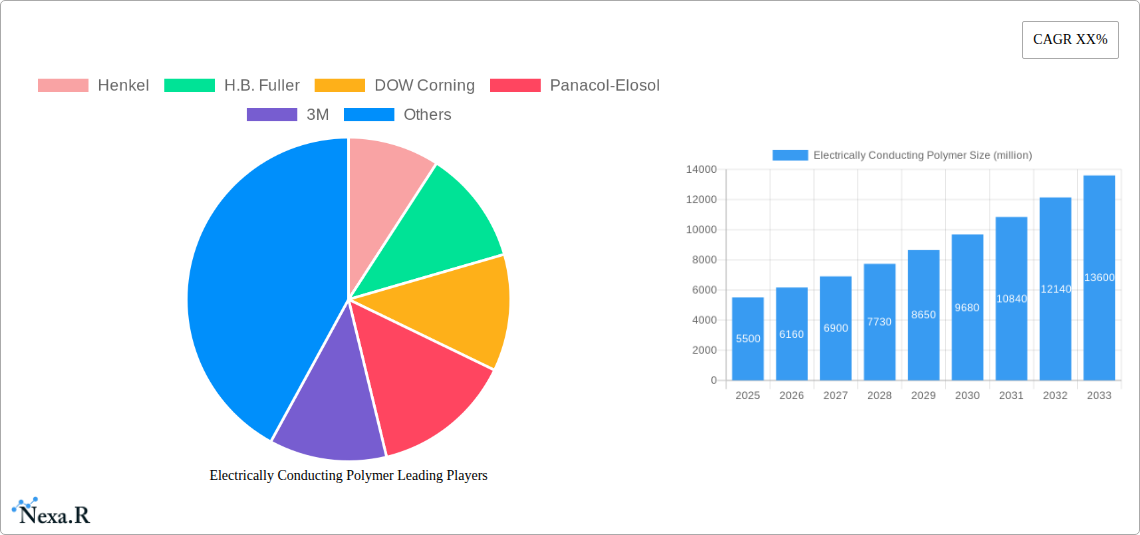
The Electrically Conducting Polymer market exhibits a moderately concentrated structure, with key players like Henkel, H.B. Fuller, DOW Corning, 3M, and The Lubrizol Corporation holding substantial market share. Technological innovation is a primary driver, fueled by ongoing research into novel polymer synthesis, enhanced conductivity, and improved processing techniques. Regulatory frameworks, particularly those concerning environmental impact and material safety in electronics and automotive sectors, are influencing product development and adoption. Competitive product substitutes, such as traditional conductive materials (metals, carbon black) and emerging nanotechnologies, present a constant challenge, pushing ECP manufacturers to focus on superior performance and cost-effectiveness. End-user demographics are shifting towards industries demanding lightweight, flexible, and highly integrated electronic components. Mergers and acquisitions (M&A) are a significant trend, with several deals in the past five years aiming to consolidate market presence, acquire complementary technologies, and expand geographical reach. For instance, the acquisition of a specialized ECP manufacturer by a larger chemical conglomerate in 2022, valued at approximately $85 million, highlights this trend. Innovation barriers include the high cost of raw materials for certain advanced ECPs and the need for specialized manufacturing infrastructure.
Electrically Conducting Polymer Growth Trends & Insights
The global Electrically Conducting Polymer market is poised for robust growth, projected to expand from an estimated $5,200 million in 2025 to reach $12,500 million by 2033, exhibiting a Compound Annual Growth Rate (CAGR) of 11.5% during the forecast period. This significant expansion is underpinned by escalating demand across various high-growth sectors. The consumer electronics segment, in particular, is a major adoption driver, with the increasing integration of flexible displays, wearable devices, and advanced sensor technologies demanding ECPs for their unique conductive and lightweight properties. Market penetration is deepening as ECPs replace heavier and less versatile traditional materials in applications like EMI shielding, antistatic coatings, and flexible printed circuits. Technological disruptions, such as the development of self-healing conductive polymers and advanced organic photovoltaic materials, are opening up new avenues for market expansion. Consumer behavior shifts towards sustainability and miniaturization are also favoring ECPs, which often offer a more environmentally friendly profile and enable the creation of more compact devices. For example, the trend towards foldable smartphones has directly boosted the demand for flexible conductive inks and films, a key sub-segment within the ECP market. The historical performance of the market from 2019 to 2024, characterized by steady growth of 9.8% CAGR, demonstrates a consistent upward trajectory, setting a strong foundation for future advancements.
Dominant Regions, Countries, or Segments in Electrically Conducting Polymer
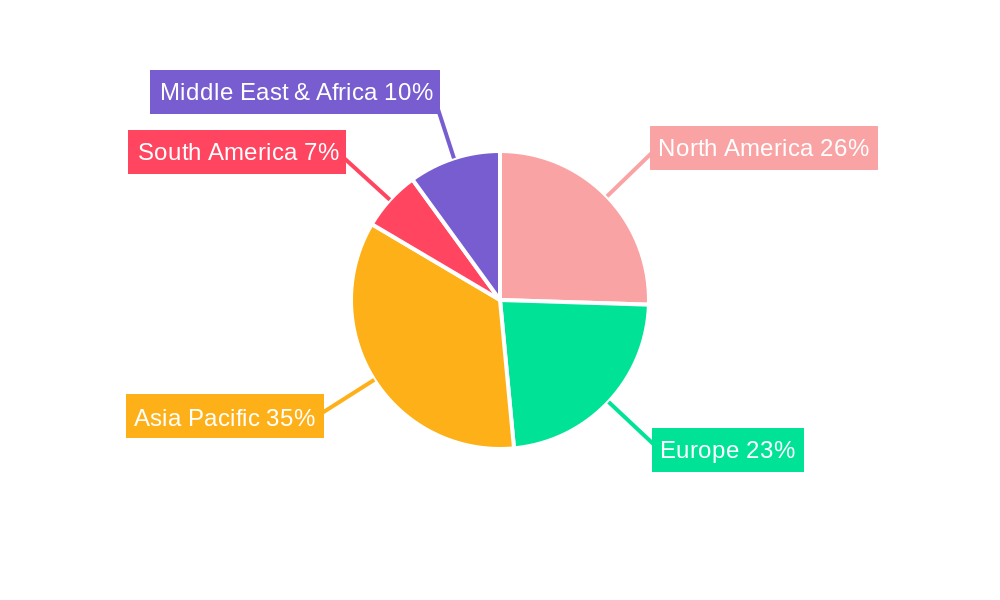
The Asia-Pacific region is emerging as the dominant force in the global Electrically Conducting Polymer market, driven by its robust manufacturing ecosystem, significant investments in R&D, and a burgeoning demand from its vast consumer electronics and automotive industries. Within this region, China stands out as a leading country, accounting for an estimated 35% of the global market share in 2025. This dominance is attributed to its comprehensive industrial policies supporting advanced materials, massive domestic consumption, and its pivotal role in global electronics manufacturing.
The consumer electronics application segment is the primary growth engine, representing approximately 40% of the market share in 2025. This is due to the insatiable demand for smartphones, tablets, wearable devices, and emerging smart home technologies that increasingly rely on the unique properties of ECPs for conductivity, flexibility, and electromagnetic interference (EMI) shielding. The semiconductor segment also plays a crucial role, with ECPs finding application in advanced packaging, conductive adhesives, and antistatic components, contributing an estimated 20% to the market.
Among the types, Composite Polymers are currently leading the market, holding an estimated 65% share in 2025. This is because composite ECPs offer a versatile blend of mechanical strength and electrical conductivity, making them suitable for a wide range of applications. The automotive sector, while a significant end-user, is projected to see accelerated growth in the coming years, particularly with the rise of electric vehicles (EVs) and autonomous driving technologies, contributing an estimated 25% of the market share. Economic policies promoting high-tech manufacturing, substantial government funding for research and development in advanced materials, and the presence of leading global technology companies in the region are key drivers of this regional dominance. Furthermore, the well-established supply chains and competitive pricing strategies adopted by regional manufacturers further solidify Asia-Pacific's leading position.
Electrically Conducting Polymer Product Landscape
The Electrically Conducting Polymer product landscape is characterized by continuous innovation in material science, leading to enhanced performance and novel applications. Key product developments include the advent of ultra-high conductivity polymers with improved charge transport capabilities, offering superior performance in sensors and electronic components. Advances in flexible and stretchable ECPs are enabling the creation of conformal electronics for wearables and medical devices. Researchers are also focusing on developing ECPs with tunable electrical properties, allowing for precise control over conductivity for specific applications. The unique selling propositions of these advanced ECPs lie in their lightweight nature, formability, and potential for cost-effective mass production compared to traditional conductive materials.
Key Drivers, Barriers & Challenges in Electrically Conducting Polymer
The Electrically Conducting Polymer market is propelled by several key drivers. Technological advancements in polymer synthesis and processing are continuously improving conductivity, flexibility, and durability. The growing demand for miniaturization and lightweight components in consumer electronics and aerospace fuels adoption. Furthermore, the expanding electric vehicle (EV) market and the need for efficient battery components and electromagnetic shielding are significant growth catalysts. Government initiatives and investments in advanced materials research and development also play a crucial role.
However, the market faces several challenges. High raw material costs for certain advanced ECPs can limit widespread adoption. Scalability of production for specialized ECPs remains a hurdle for some manufacturers. Regulatory hurdles related to material safety and environmental impact, particularly in sensitive applications like biosciences, require careful navigation. Supply chain disruptions, as seen in recent global events, can impact the availability and cost of essential precursor materials. Competitive pressures from established conductive materials and the need for extensive R&D investment to stay ahead of the curve also pose significant restraints, impacting the overall market growth by approximately 15-20% in affected periods.
Emerging Opportunities in Electrically Conducting Polymer
Emerging opportunities in the Electrically Conducting Polymer industry are vast and diverse. The biosciences sector presents a significant untapped market, with ECPs poised for application in advanced biosensors, implantable medical devices, and drug delivery systems. The development of smart textiles that integrate conductive pathways for wearable electronics, health monitoring, and haptic feedback offers another promising avenue. Furthermore, the growing interest in sustainable electronics is driving demand for bio-based and recyclable ECPs. The potential for ECPs in energy storage solutions, beyond batteries, such as supercapacitors and thermoelectric generators, is also an area ripe for exploration and innovation.
Growth Accelerators in the Electrically Conducting Polymer Industry
Several factors are acting as significant growth accelerators for the Electrically Conducting Polymer industry. Breakthroughs in material science, leading to polymers with unprecedented conductivity levels and enhanced mechanical properties, are pivotal. Strategic partnerships between ECP manufacturers and leading electronics and automotive companies are fostering faster product development cycles and market penetration. The increasing focus on miniaturization and flexible electronics in consumer devices directly translates to higher demand for ECP solutions. Furthermore, the global push towards electrification of transportation and the subsequent demand for lightweight, high-performance materials in EVs are substantial growth drivers.
Key Players Shaping the Electrically Conducting Polymer Market
- Henkel
- H.B. Fuller
- DOW Corning
- Panacol-Elosol
- 3M
- Aremco Products
- Mereco Technologies
- Holland Shielding
- M.G. Chemicals
- Masterbond
- Kemtron
- Heraeus Group
- Tayca
- Parker Hannifin
- Premix OY
- The Lubrizol Corporation
- Agfa
- Rieke Metals
- Avient
- Boron Molecular
- Kenner Material & System
- Toyobo
- Nitto Denko
- SEKISUI
- GUNZE
- TDK
Notable Milestones in Electrically Conducting Polymer Sector
- 2019: Launch of advanced conductive ink formulations for flexible printed circuits by 3M, enhancing durability.
- 2020: DOW Corning introduces a new series of conductive silicone elastomers for automotive applications, increasing EMI shielding effectiveness.
- 2021: Henkel acquires a specialized developer of conductive adhesives, expanding its portfolio for electronics assembly.
- 2022: The Lubrizol Corporation announces significant investment in R&D for biodegradable electrically conducting polymers.
- 2023 (Q1): Agfa unveils a novel conductive ink with improved printability for high-volume consumer electronics manufacturing.
- 2023 (Q3): Nitto Denko develops a highly flexible conductive tape for wearable sensor applications.
In-Depth Electrically Conducting Polymer Market Outlook
The Electrically Conducting Polymer market is set for a period of sustained and dynamic growth, driven by a confluence of technological innovation, evolving industry demands, and strategic market expansion. The outlook is highly positive, with significant potential for penetration into new and existing applications. Key growth accelerators include ongoing advancements in material science leading to enhanced performance characteristics, strategic collaborations that bridge the gap between research and commercialization, and the burgeoning demand from sectors like electric vehicles and advanced medical devices. The market is expected to witness a continued surge in demand for flexible, lightweight, and highly conductive materials, positioning ECPs as indispensable components in the future of electronics, transportation, and healthcare.
Electrically Conducting Polymer Segmentation
-
1. Application
- 1.1. Automotive
- 1.2. Consumer Electronics
- 1.3. Aerospace
- 1.4. Biosciences
- 1.5. Semiconductor
- 1.6. Others
-
2. Types
- 2.1. Composite Polymer
- 2.2. Structural Polymer
Electrically Conducting Polymer Segmentation By Geography
-
1. North America
- 1.1. United States
- 1.2. Canada
- 1.3. Mexico
-
2. South America
- 2.1. Brazil
- 2.2. Argentina
- 2.3. Rest of South America
-
3. Europe
- 3.1. United Kingdom
- 3.2. Germany
- 3.3. France
- 3.4. Italy
- 3.5. Spain
- 3.6. Russia
- 3.7. Benelux
- 3.8. Nordics
- 3.9. Rest of Europe
-
4. Middle East & Africa
- 4.1. Turkey
- 4.2. Israel
- 4.3. GCC
- 4.4. North Africa
- 4.5. South Africa
- 4.6. Rest of Middle East & Africa
-
5. Asia Pacific
- 5.1. China
- 5.2. India
- 5.3. Japan
- 5.4. South Korea
- 5.5. ASEAN
- 5.6. Oceania
- 5.7. Rest of Asia Pacific
Electrically Conducting Polymer REPORT HIGHLIGHTS
| Aspects | Details |
|---|---|
| Study Period | 2019-2033 |
| Base Year | 2024 |
| Estimated Year | 2025 |
| Forecast Period | 2025-2033 |
| Historical Period | 2019-2024 |
| Growth Rate | CAGR of XX% from 2019-2033 |
| Segmentation |
|
Table of Contents
- 1. Introduction
- 1.1. Research Scope
- 1.2. Market Segmentation
- 1.3. Research Methodology
- 1.4. Definitions and Assumptions
- 2. Executive Summary
- 2.1. Introduction
- 3. Market Dynamics
- 3.1. Introduction
- 3.2. Market Drivers
- 3.3. Market Restrains
- 3.4. Market Trends
- 4. Market Factor Analysis
- 4.1. Porters Five Forces
- 4.2. Supply/Value Chain
- 4.3. PESTEL analysis
- 4.4. Market Entropy
- 4.5. Patent/Trademark Analysis
- 5. Global Electrically Conducting Polymer Analysis, Insights and Forecast, 2019-2031
- 5.1. Market Analysis, Insights and Forecast - by Application
- 5.1.1. Automotive
- 5.1.2. Consumer Electronics
- 5.1.3. Aerospace
- 5.1.4. Biosciences
- 5.1.5. Semiconductor
- 5.1.6. Others
- 5.2. Market Analysis, Insights and Forecast - by Types
- 5.2.1. Composite Polymer
- 5.2.2. Structural Polymer
- 5.3. Market Analysis, Insights and Forecast - by Region
- 5.3.1. North America
- 5.3.2. South America
- 5.3.3. Europe
- 5.3.4. Middle East & Africa
- 5.3.5. Asia Pacific
- 5.1. Market Analysis, Insights and Forecast - by Application
- 6. North America Electrically Conducting Polymer Analysis, Insights and Forecast, 2019-2031
- 6.1. Market Analysis, Insights and Forecast - by Application
- 6.1.1. Automotive
- 6.1.2. Consumer Electronics
- 6.1.3. Aerospace
- 6.1.4. Biosciences
- 6.1.5. Semiconductor
- 6.1.6. Others
- 6.2. Market Analysis, Insights and Forecast - by Types
- 6.2.1. Composite Polymer
- 6.2.2. Structural Polymer
- 6.1. Market Analysis, Insights and Forecast - by Application
- 7. South America Electrically Conducting Polymer Analysis, Insights and Forecast, 2019-2031
- 7.1. Market Analysis, Insights and Forecast - by Application
- 7.1.1. Automotive
- 7.1.2. Consumer Electronics
- 7.1.3. Aerospace
- 7.1.4. Biosciences
- 7.1.5. Semiconductor
- 7.1.6. Others
- 7.2. Market Analysis, Insights and Forecast - by Types
- 7.2.1. Composite Polymer
- 7.2.2. Structural Polymer
- 7.1. Market Analysis, Insights and Forecast - by Application
- 8. Europe Electrically Conducting Polymer Analysis, Insights and Forecast, 2019-2031
- 8.1. Market Analysis, Insights and Forecast - by Application
- 8.1.1. Automotive
- 8.1.2. Consumer Electronics
- 8.1.3. Aerospace
- 8.1.4. Biosciences
- 8.1.5. Semiconductor
- 8.1.6. Others
- 8.2. Market Analysis, Insights and Forecast - by Types
- 8.2.1. Composite Polymer
- 8.2.2. Structural Polymer
- 8.1. Market Analysis, Insights and Forecast - by Application
- 9. Middle East & Africa Electrically Conducting Polymer Analysis, Insights and Forecast, 2019-2031
- 9.1. Market Analysis, Insights and Forecast - by Application
- 9.1.1. Automotive
- 9.1.2. Consumer Electronics
- 9.1.3. Aerospace
- 9.1.4. Biosciences
- 9.1.5. Semiconductor
- 9.1.6. Others
- 9.2. Market Analysis, Insights and Forecast - by Types
- 9.2.1. Composite Polymer
- 9.2.2. Structural Polymer
- 9.1. Market Analysis, Insights and Forecast - by Application
- 10. Asia Pacific Electrically Conducting Polymer Analysis, Insights and Forecast, 2019-2031
- 10.1. Market Analysis, Insights and Forecast - by Application
- 10.1.1. Automotive
- 10.1.2. Consumer Electronics
- 10.1.3. Aerospace
- 10.1.4. Biosciences
- 10.1.5. Semiconductor
- 10.1.6. Others
- 10.2. Market Analysis, Insights and Forecast - by Types
- 10.2.1. Composite Polymer
- 10.2.2. Structural Polymer
- 10.1. Market Analysis, Insights and Forecast - by Application
- 11. Competitive Analysis
- 11.1. Global Market Share Analysis 2024
- 11.2. Company Profiles
- 11.2.1 Henkel
- 11.2.1.1. Overview
- 11.2.1.2. Products
- 11.2.1.3. SWOT Analysis
- 11.2.1.4. Recent Developments
- 11.2.1.5. Financials (Based on Availability)
- 11.2.2 H.B. Fuller
- 11.2.2.1. Overview
- 11.2.2.2. Products
- 11.2.2.3. SWOT Analysis
- 11.2.2.4. Recent Developments
- 11.2.2.5. Financials (Based on Availability)
- 11.2.3 DOW Corning
- 11.2.3.1. Overview
- 11.2.3.2. Products
- 11.2.3.3. SWOT Analysis
- 11.2.3.4. Recent Developments
- 11.2.3.5. Financials (Based on Availability)
- 11.2.4 Panacol-Elosol
- 11.2.4.1. Overview
- 11.2.4.2. Products
- 11.2.4.3. SWOT Analysis
- 11.2.4.4. Recent Developments
- 11.2.4.5. Financials (Based on Availability)
- 11.2.5 3M
- 11.2.5.1. Overview
- 11.2.5.2. Products
- 11.2.5.3. SWOT Analysis
- 11.2.5.4. Recent Developments
- 11.2.5.5. Financials (Based on Availability)
- 11.2.6 Aremco Products
- 11.2.6.1. Overview
- 11.2.6.2. Products
- 11.2.6.3. SWOT Analysis
- 11.2.6.4. Recent Developments
- 11.2.6.5. Financials (Based on Availability)
- 11.2.7 Mereco Technologies
- 11.2.7.1. Overview
- 11.2.7.2. Products
- 11.2.7.3. SWOT Analysis
- 11.2.7.4. Recent Developments
- 11.2.7.5. Financials (Based on Availability)
- 11.2.8 Holland Shielding
- 11.2.8.1. Overview
- 11.2.8.2. Products
- 11.2.8.3. SWOT Analysis
- 11.2.8.4. Recent Developments
- 11.2.8.5. Financials (Based on Availability)
- 11.2.9 M.G. Chemicals
- 11.2.9.1. Overview
- 11.2.9.2. Products
- 11.2.9.3. SWOT Analysis
- 11.2.9.4. Recent Developments
- 11.2.9.5. Financials (Based on Availability)
- 11.2.10 Masterbond
- 11.2.10.1. Overview
- 11.2.10.2. Products
- 11.2.10.3. SWOT Analysis
- 11.2.10.4. Recent Developments
- 11.2.10.5. Financials (Based on Availability)
- 11.2.11 Kemtron
- 11.2.11.1. Overview
- 11.2.11.2. Products
- 11.2.11.3. SWOT Analysis
- 11.2.11.4. Recent Developments
- 11.2.11.5. Financials (Based on Availability)
- 11.2.12 Heraeus Group
- 11.2.12.1. Overview
- 11.2.12.2. Products
- 11.2.12.3. SWOT Analysis
- 11.2.12.4. Recent Developments
- 11.2.12.5. Financials (Based on Availability)
- 11.2.13 Tayca
- 11.2.13.1. Overview
- 11.2.13.2. Products
- 11.2.13.3. SWOT Analysis
- 11.2.13.4. Recent Developments
- 11.2.13.5. Financials (Based on Availability)
- 11.2.14 Parker Hannifin
- 11.2.14.1. Overview
- 11.2.14.2. Products
- 11.2.14.3. SWOT Analysis
- 11.2.14.4. Recent Developments
- 11.2.14.5. Financials (Based on Availability)
- 11.2.15 Premix OY
- 11.2.15.1. Overview
- 11.2.15.2. Products
- 11.2.15.3. SWOT Analysis
- 11.2.15.4. Recent Developments
- 11.2.15.5. Financials (Based on Availability)
- 11.2.16 The Lubrizol Corporation
- 11.2.16.1. Overview
- 11.2.16.2. Products
- 11.2.16.3. SWOT Analysis
- 11.2.16.4. Recent Developments
- 11.2.16.5. Financials (Based on Availability)
- 11.2.17 Agfa
- 11.2.17.1. Overview
- 11.2.17.2. Products
- 11.2.17.3. SWOT Analysis
- 11.2.17.4. Recent Developments
- 11.2.17.5. Financials (Based on Availability)
- 11.2.18 Rieke Metals
- 11.2.18.1. Overview
- 11.2.18.2. Products
- 11.2.18.3. SWOT Analysis
- 11.2.18.4. Recent Developments
- 11.2.18.5. Financials (Based on Availability)
- 11.2.19 Avient
- 11.2.19.1. Overview
- 11.2.19.2. Products
- 11.2.19.3. SWOT Analysis
- 11.2.19.4. Recent Developments
- 11.2.19.5. Financials (Based on Availability)
- 11.2.20 Boron Molecular
- 11.2.20.1. Overview
- 11.2.20.2. Products
- 11.2.20.3. SWOT Analysis
- 11.2.20.4. Recent Developments
- 11.2.20.5. Financials (Based on Availability)
- 11.2.21 Kenner Material & System
- 11.2.21.1. Overview
- 11.2.21.2. Products
- 11.2.21.3. SWOT Analysis
- 11.2.21.4. Recent Developments
- 11.2.21.5. Financials (Based on Availability)
- 11.2.22 Toyobo
- 11.2.22.1. Overview
- 11.2.22.2. Products
- 11.2.22.3. SWOT Analysis
- 11.2.22.4. Recent Developments
- 11.2.22.5. Financials (Based on Availability)
- 11.2.23 Nitto Denko
- 11.2.23.1. Overview
- 11.2.23.2. Products
- 11.2.23.3. SWOT Analysis
- 11.2.23.4. Recent Developments
- 11.2.23.5. Financials (Based on Availability)
- 11.2.24 SEKISUI
- 11.2.24.1. Overview
- 11.2.24.2. Products
- 11.2.24.3. SWOT Analysis
- 11.2.24.4. Recent Developments
- 11.2.24.5. Financials (Based on Availability)
- 11.2.25 GUNZE
- 11.2.25.1. Overview
- 11.2.25.2. Products
- 11.2.25.3. SWOT Analysis
- 11.2.25.4. Recent Developments
- 11.2.25.5. Financials (Based on Availability)
- 11.2.26 TDK
- 11.2.26.1. Overview
- 11.2.26.2. Products
- 11.2.26.3. SWOT Analysis
- 11.2.26.4. Recent Developments
- 11.2.26.5. Financials (Based on Availability)
- 11.2.1 Henkel
List of Figures
- Figure 1: Global Electrically Conducting Polymer Revenue Breakdown (million, %) by Region 2024 & 2032
- Figure 2: Global Electrically Conducting Polymer Volume Breakdown (K, %) by Region 2024 & 2032
- Figure 3: North America Electrically Conducting Polymer Revenue (million), by Application 2024 & 2032
- Figure 4: North America Electrically Conducting Polymer Volume (K), by Application 2024 & 2032
- Figure 5: North America Electrically Conducting Polymer Revenue Share (%), by Application 2024 & 2032
- Figure 6: North America Electrically Conducting Polymer Volume Share (%), by Application 2024 & 2032
- Figure 7: North America Electrically Conducting Polymer Revenue (million), by Types 2024 & 2032
- Figure 8: North America Electrically Conducting Polymer Volume (K), by Types 2024 & 2032
- Figure 9: North America Electrically Conducting Polymer Revenue Share (%), by Types 2024 & 2032
- Figure 10: North America Electrically Conducting Polymer Volume Share (%), by Types 2024 & 2032
- Figure 11: North America Electrically Conducting Polymer Revenue (million), by Country 2024 & 2032
- Figure 12: North America Electrically Conducting Polymer Volume (K), by Country 2024 & 2032
- Figure 13: North America Electrically Conducting Polymer Revenue Share (%), by Country 2024 & 2032
- Figure 14: North America Electrically Conducting Polymer Volume Share (%), by Country 2024 & 2032
- Figure 15: South America Electrically Conducting Polymer Revenue (million), by Application 2024 & 2032
- Figure 16: South America Electrically Conducting Polymer Volume (K), by Application 2024 & 2032
- Figure 17: South America Electrically Conducting Polymer Revenue Share (%), by Application 2024 & 2032
- Figure 18: South America Electrically Conducting Polymer Volume Share (%), by Application 2024 & 2032
- Figure 19: South America Electrically Conducting Polymer Revenue (million), by Types 2024 & 2032
- Figure 20: South America Electrically Conducting Polymer Volume (K), by Types 2024 & 2032
- Figure 21: South America Electrically Conducting Polymer Revenue Share (%), by Types 2024 & 2032
- Figure 22: South America Electrically Conducting Polymer Volume Share (%), by Types 2024 & 2032
- Figure 23: South America Electrically Conducting Polymer Revenue (million), by Country 2024 & 2032
- Figure 24: South America Electrically Conducting Polymer Volume (K), by Country 2024 & 2032
- Figure 25: South America Electrically Conducting Polymer Revenue Share (%), by Country 2024 & 2032
- Figure 26: South America Electrically Conducting Polymer Volume Share (%), by Country 2024 & 2032
- Figure 27: Europe Electrically Conducting Polymer Revenue (million), by Application 2024 & 2032
- Figure 28: Europe Electrically Conducting Polymer Volume (K), by Application 2024 & 2032
- Figure 29: Europe Electrically Conducting Polymer Revenue Share (%), by Application 2024 & 2032
- Figure 30: Europe Electrically Conducting Polymer Volume Share (%), by Application 2024 & 2032
- Figure 31: Europe Electrically Conducting Polymer Revenue (million), by Types 2024 & 2032
- Figure 32: Europe Electrically Conducting Polymer Volume (K), by Types 2024 & 2032
- Figure 33: Europe Electrically Conducting Polymer Revenue Share (%), by Types 2024 & 2032
- Figure 34: Europe Electrically Conducting Polymer Volume Share (%), by Types 2024 & 2032
- Figure 35: Europe Electrically Conducting Polymer Revenue (million), by Country 2024 & 2032
- Figure 36: Europe Electrically Conducting Polymer Volume (K), by Country 2024 & 2032
- Figure 37: Europe Electrically Conducting Polymer Revenue Share (%), by Country 2024 & 2032
- Figure 38: Europe Electrically Conducting Polymer Volume Share (%), by Country 2024 & 2032
- Figure 39: Middle East & Africa Electrically Conducting Polymer Revenue (million), by Application 2024 & 2032
- Figure 40: Middle East & Africa Electrically Conducting Polymer Volume (K), by Application 2024 & 2032
- Figure 41: Middle East & Africa Electrically Conducting Polymer Revenue Share (%), by Application 2024 & 2032
- Figure 42: Middle East & Africa Electrically Conducting Polymer Volume Share (%), by Application 2024 & 2032
- Figure 43: Middle East & Africa Electrically Conducting Polymer Revenue (million), by Types 2024 & 2032
- Figure 44: Middle East & Africa Electrically Conducting Polymer Volume (K), by Types 2024 & 2032
- Figure 45: Middle East & Africa Electrically Conducting Polymer Revenue Share (%), by Types 2024 & 2032
- Figure 46: Middle East & Africa Electrically Conducting Polymer Volume Share (%), by Types 2024 & 2032
- Figure 47: Middle East & Africa Electrically Conducting Polymer Revenue (million), by Country 2024 & 2032
- Figure 48: Middle East & Africa Electrically Conducting Polymer Volume (K), by Country 2024 & 2032
- Figure 49: Middle East & Africa Electrically Conducting Polymer Revenue Share (%), by Country 2024 & 2032
- Figure 50: Middle East & Africa Electrically Conducting Polymer Volume Share (%), by Country 2024 & 2032
- Figure 51: Asia Pacific Electrically Conducting Polymer Revenue (million), by Application 2024 & 2032
- Figure 52: Asia Pacific Electrically Conducting Polymer Volume (K), by Application 2024 & 2032
- Figure 53: Asia Pacific Electrically Conducting Polymer Revenue Share (%), by Application 2024 & 2032
- Figure 54: Asia Pacific Electrically Conducting Polymer Volume Share (%), by Application 2024 & 2032
- Figure 55: Asia Pacific Electrically Conducting Polymer Revenue (million), by Types 2024 & 2032
- Figure 56: Asia Pacific Electrically Conducting Polymer Volume (K), by Types 2024 & 2032
- Figure 57: Asia Pacific Electrically Conducting Polymer Revenue Share (%), by Types 2024 & 2032
- Figure 58: Asia Pacific Electrically Conducting Polymer Volume Share (%), by Types 2024 & 2032
- Figure 59: Asia Pacific Electrically Conducting Polymer Revenue (million), by Country 2024 & 2032
- Figure 60: Asia Pacific Electrically Conducting Polymer Volume (K), by Country 2024 & 2032
- Figure 61: Asia Pacific Electrically Conducting Polymer Revenue Share (%), by Country 2024 & 2032
- Figure 62: Asia Pacific Electrically Conducting Polymer Volume Share (%), by Country 2024 & 2032
List of Tables
- Table 1: Global Electrically Conducting Polymer Revenue million Forecast, by Region 2019 & 2032
- Table 2: Global Electrically Conducting Polymer Volume K Forecast, by Region 2019 & 2032
- Table 3: Global Electrically Conducting Polymer Revenue million Forecast, by Application 2019 & 2032
- Table 4: Global Electrically Conducting Polymer Volume K Forecast, by Application 2019 & 2032
- Table 5: Global Electrically Conducting Polymer Revenue million Forecast, by Types 2019 & 2032
- Table 6: Global Electrically Conducting Polymer Volume K Forecast, by Types 2019 & 2032
- Table 7: Global Electrically Conducting Polymer Revenue million Forecast, by Region 2019 & 2032
- Table 8: Global Electrically Conducting Polymer Volume K Forecast, by Region 2019 & 2032
- Table 9: Global Electrically Conducting Polymer Revenue million Forecast, by Application 2019 & 2032
- Table 10: Global Electrically Conducting Polymer Volume K Forecast, by Application 2019 & 2032
- Table 11: Global Electrically Conducting Polymer Revenue million Forecast, by Types 2019 & 2032
- Table 12: Global Electrically Conducting Polymer Volume K Forecast, by Types 2019 & 2032
- Table 13: Global Electrically Conducting Polymer Revenue million Forecast, by Country 2019 & 2032
- Table 14: Global Electrically Conducting Polymer Volume K Forecast, by Country 2019 & 2032
- Table 15: United States Electrically Conducting Polymer Revenue (million) Forecast, by Application 2019 & 2032
- Table 16: United States Electrically Conducting Polymer Volume (K) Forecast, by Application 2019 & 2032
- Table 17: Canada Electrically Conducting Polymer Revenue (million) Forecast, by Application 2019 & 2032
- Table 18: Canada Electrically Conducting Polymer Volume (K) Forecast, by Application 2019 & 2032
- Table 19: Mexico Electrically Conducting Polymer Revenue (million) Forecast, by Application 2019 & 2032
- Table 20: Mexico Electrically Conducting Polymer Volume (K) Forecast, by Application 2019 & 2032
- Table 21: Global Electrically Conducting Polymer Revenue million Forecast, by Application 2019 & 2032
- Table 22: Global Electrically Conducting Polymer Volume K Forecast, by Application 2019 & 2032
- Table 23: Global Electrically Conducting Polymer Revenue million Forecast, by Types 2019 & 2032
- Table 24: Global Electrically Conducting Polymer Volume K Forecast, by Types 2019 & 2032
- Table 25: Global Electrically Conducting Polymer Revenue million Forecast, by Country 2019 & 2032
- Table 26: Global Electrically Conducting Polymer Volume K Forecast, by Country 2019 & 2032
- Table 27: Brazil Electrically Conducting Polymer Revenue (million) Forecast, by Application 2019 & 2032
- Table 28: Brazil Electrically Conducting Polymer Volume (K) Forecast, by Application 2019 & 2032
- Table 29: Argentina Electrically Conducting Polymer Revenue (million) Forecast, by Application 2019 & 2032
- Table 30: Argentina Electrically Conducting Polymer Volume (K) Forecast, by Application 2019 & 2032
- Table 31: Rest of South America Electrically Conducting Polymer Revenue (million) Forecast, by Application 2019 & 2032
- Table 32: Rest of South America Electrically Conducting Polymer Volume (K) Forecast, by Application 2019 & 2032
- Table 33: Global Electrically Conducting Polymer Revenue million Forecast, by Application 2019 & 2032
- Table 34: Global Electrically Conducting Polymer Volume K Forecast, by Application 2019 & 2032
- Table 35: Global Electrically Conducting Polymer Revenue million Forecast, by Types 2019 & 2032
- Table 36: Global Electrically Conducting Polymer Volume K Forecast, by Types 2019 & 2032
- Table 37: Global Electrically Conducting Polymer Revenue million Forecast, by Country 2019 & 2032
- Table 38: Global Electrically Conducting Polymer Volume K Forecast, by Country 2019 & 2032
- Table 39: United Kingdom Electrically Conducting Polymer Revenue (million) Forecast, by Application 2019 & 2032
- Table 40: United Kingdom Electrically Conducting Polymer Volume (K) Forecast, by Application 2019 & 2032
- Table 41: Germany Electrically Conducting Polymer Revenue (million) Forecast, by Application 2019 & 2032
- Table 42: Germany Electrically Conducting Polymer Volume (K) Forecast, by Application 2019 & 2032
- Table 43: France Electrically Conducting Polymer Revenue (million) Forecast, by Application 2019 & 2032
- Table 44: France Electrically Conducting Polymer Volume (K) Forecast, by Application 2019 & 2032
- Table 45: Italy Electrically Conducting Polymer Revenue (million) Forecast, by Application 2019 & 2032
- Table 46: Italy Electrically Conducting Polymer Volume (K) Forecast, by Application 2019 & 2032
- Table 47: Spain Electrically Conducting Polymer Revenue (million) Forecast, by Application 2019 & 2032
- Table 48: Spain Electrically Conducting Polymer Volume (K) Forecast, by Application 2019 & 2032
- Table 49: Russia Electrically Conducting Polymer Revenue (million) Forecast, by Application 2019 & 2032
- Table 50: Russia Electrically Conducting Polymer Volume (K) Forecast, by Application 2019 & 2032
- Table 51: Benelux Electrically Conducting Polymer Revenue (million) Forecast, by Application 2019 & 2032
- Table 52: Benelux Electrically Conducting Polymer Volume (K) Forecast, by Application 2019 & 2032
- Table 53: Nordics Electrically Conducting Polymer Revenue (million) Forecast, by Application 2019 & 2032
- Table 54: Nordics Electrically Conducting Polymer Volume (K) Forecast, by Application 2019 & 2032
- Table 55: Rest of Europe Electrically Conducting Polymer Revenue (million) Forecast, by Application 2019 & 2032
- Table 56: Rest of Europe Electrically Conducting Polymer Volume (K) Forecast, by Application 2019 & 2032
- Table 57: Global Electrically Conducting Polymer Revenue million Forecast, by Application 2019 & 2032
- Table 58: Global Electrically Conducting Polymer Volume K Forecast, by Application 2019 & 2032
- Table 59: Global Electrically Conducting Polymer Revenue million Forecast, by Types 2019 & 2032
- Table 60: Global Electrically Conducting Polymer Volume K Forecast, by Types 2019 & 2032
- Table 61: Global Electrically Conducting Polymer Revenue million Forecast, by Country 2019 & 2032
- Table 62: Global Electrically Conducting Polymer Volume K Forecast, by Country 2019 & 2032
- Table 63: Turkey Electrically Conducting Polymer Revenue (million) Forecast, by Application 2019 & 2032
- Table 64: Turkey Electrically Conducting Polymer Volume (K) Forecast, by Application 2019 & 2032
- Table 65: Israel Electrically Conducting Polymer Revenue (million) Forecast, by Application 2019 & 2032
- Table 66: Israel Electrically Conducting Polymer Volume (K) Forecast, by Application 2019 & 2032
- Table 67: GCC Electrically Conducting Polymer Revenue (million) Forecast, by Application 2019 & 2032
- Table 68: GCC Electrically Conducting Polymer Volume (K) Forecast, by Application 2019 & 2032
- Table 69: North Africa Electrically Conducting Polymer Revenue (million) Forecast, by Application 2019 & 2032
- Table 70: North Africa Electrically Conducting Polymer Volume (K) Forecast, by Application 2019 & 2032
- Table 71: South Africa Electrically Conducting Polymer Revenue (million) Forecast, by Application 2019 & 2032
- Table 72: South Africa Electrically Conducting Polymer Volume (K) Forecast, by Application 2019 & 2032
- Table 73: Rest of Middle East & Africa Electrically Conducting Polymer Revenue (million) Forecast, by Application 2019 & 2032
- Table 74: Rest of Middle East & Africa Electrically Conducting Polymer Volume (K) Forecast, by Application 2019 & 2032
- Table 75: Global Electrically Conducting Polymer Revenue million Forecast, by Application 2019 & 2032
- Table 76: Global Electrically Conducting Polymer Volume K Forecast, by Application 2019 & 2032
- Table 77: Global Electrically Conducting Polymer Revenue million Forecast, by Types 2019 & 2032
- Table 78: Global Electrically Conducting Polymer Volume K Forecast, by Types 2019 & 2032
- Table 79: Global Electrically Conducting Polymer Revenue million Forecast, by Country 2019 & 2032
- Table 80: Global Electrically Conducting Polymer Volume K Forecast, by Country 2019 & 2032
- Table 81: China Electrically Conducting Polymer Revenue (million) Forecast, by Application 2019 & 2032
- Table 82: China Electrically Conducting Polymer Volume (K) Forecast, by Application 2019 & 2032
- Table 83: India Electrically Conducting Polymer Revenue (million) Forecast, by Application 2019 & 2032
- Table 84: India Electrically Conducting Polymer Volume (K) Forecast, by Application 2019 & 2032
- Table 85: Japan Electrically Conducting Polymer Revenue (million) Forecast, by Application 2019 & 2032
- Table 86: Japan Electrically Conducting Polymer Volume (K) Forecast, by Application 2019 & 2032
- Table 87: South Korea Electrically Conducting Polymer Revenue (million) Forecast, by Application 2019 & 2032
- Table 88: South Korea Electrically Conducting Polymer Volume (K) Forecast, by Application 2019 & 2032
- Table 89: ASEAN Electrically Conducting Polymer Revenue (million) Forecast, by Application 2019 & 2032
- Table 90: ASEAN Electrically Conducting Polymer Volume (K) Forecast, by Application 2019 & 2032
- Table 91: Oceania Electrically Conducting Polymer Revenue (million) Forecast, by Application 2019 & 2032
- Table 92: Oceania Electrically Conducting Polymer Volume (K) Forecast, by Application 2019 & 2032
- Table 93: Rest of Asia Pacific Electrically Conducting Polymer Revenue (million) Forecast, by Application 2019 & 2032
- Table 94: Rest of Asia Pacific Electrically Conducting Polymer Volume (K) Forecast, by Application 2019 & 2032
Frequently Asked Questions
1. What is the projected Compound Annual Growth Rate (CAGR) of the Electrically Conducting Polymer?
The projected CAGR is approximately XX%.
2. Which companies are prominent players in the Electrically Conducting Polymer?
Key companies in the market include Henkel, H.B. Fuller, DOW Corning, Panacol-Elosol, 3M, Aremco Products, Mereco Technologies, Holland Shielding, M.G. Chemicals, Masterbond, Kemtron, Heraeus Group, Tayca, Parker Hannifin, Premix OY, The Lubrizol Corporation, Agfa, Rieke Metals, Avient, Boron Molecular, Kenner Material & System, Toyobo, Nitto Denko, SEKISUI, GUNZE, TDK.
3. What are the main segments of the Electrically Conducting Polymer?
The market segments include Application, Types.
4. Can you provide details about the market size?
The market size is estimated to be USD XXX million as of 2022.
5. What are some drivers contributing to market growth?
N/A
6. What are the notable trends driving market growth?
N/A
7. Are there any restraints impacting market growth?
N/A
8. Can you provide examples of recent developments in the market?
N/A
9. What pricing options are available for accessing the report?
Pricing options include single-user, multi-user, and enterprise licenses priced at USD 3950.00, USD 5925.00, and USD 7900.00 respectively.
10. Is the market size provided in terms of value or volume?
The market size is provided in terms of value, measured in million and volume, measured in K.
11. Are there any specific market keywords associated with the report?
Yes, the market keyword associated with the report is "Electrically Conducting Polymer," which aids in identifying and referencing the specific market segment covered.
12. How do I determine which pricing option suits my needs best?
The pricing options vary based on user requirements and access needs. Individual users may opt for single-user licenses, while businesses requiring broader access may choose multi-user or enterprise licenses for cost-effective access to the report.
13. Are there any additional resources or data provided in the Electrically Conducting Polymer report?
While the report offers comprehensive insights, it's advisable to review the specific contents or supplementary materials provided to ascertain if additional resources or data are available.
14. How can I stay updated on further developments or reports in the Electrically Conducting Polymer?
To stay informed about further developments, trends, and reports in the Electrically Conducting Polymer, consider subscribing to industry newsletters, following relevant companies and organizations, or regularly checking reputable industry news sources and publications.
Methodology
Step 1 - Identification of Relevant Samples Size from Population Database


Step 2 - Approaches for Defining Global Market Size (Value, Volume* & Price*)

Note*: In applicable scenarios
Step 3 - Data Sources
Primary Research
- Web Analytics
- Survey Reports
- Research Institute
- Latest Research Reports
- Opinion Leaders
Secondary Research
- Annual Reports
- White Paper
- Latest Press Release
- Industry Association
- Paid Database
- Investor Presentations

Step 4 - Data Triangulation
Involves using different sources of information in order to increase the validity of a study
These sources are likely to be stakeholders in a program - participants, other researchers, program staff, other community members, and so on.
Then we put all data in single framework & apply various statistical tools to find out the dynamic on the market.
During the analysis stage, feedback from the stakeholder groups would be compared to determine areas of agreement as well as areas of divergence
