

Key Insights
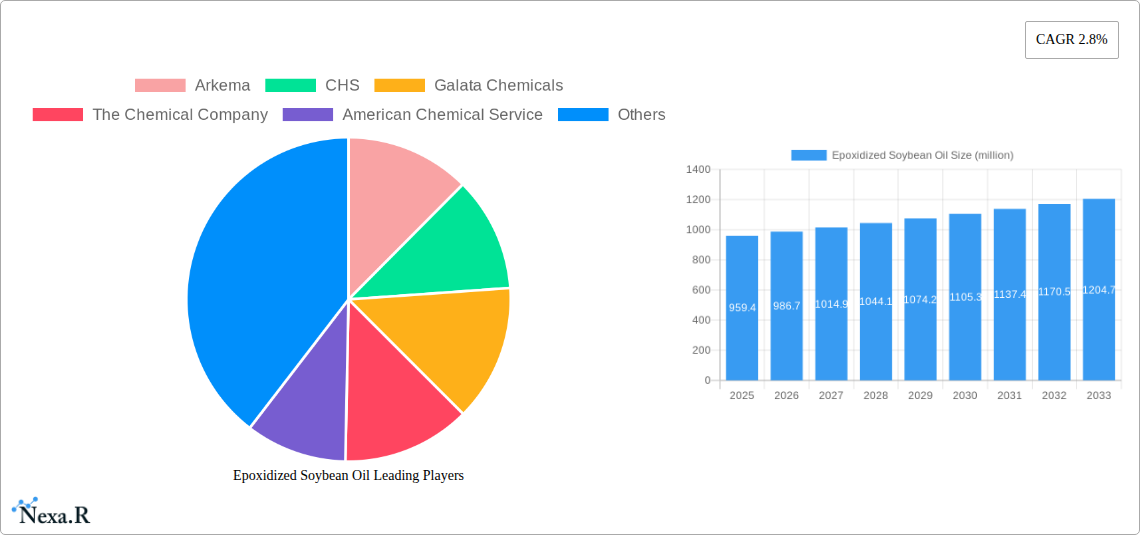
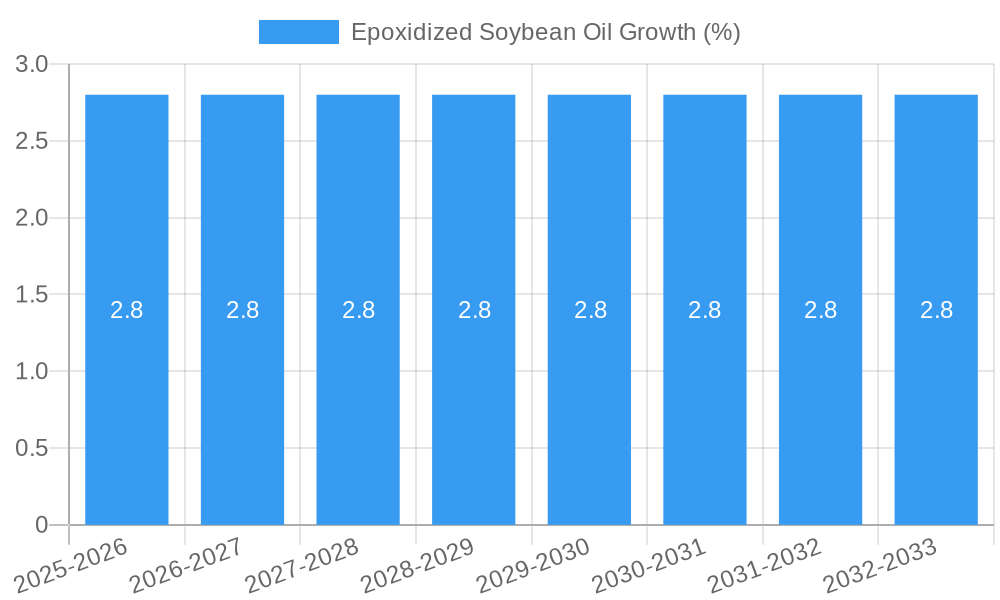
The Epoxidized Soybean Oil (ESO) market is poised for steady growth, projected to reach approximately \$959.4 million. This expansion is driven by an estimated Compound Annual Growth Rate (CAGR) of 2.8% over the forecast period of 2025-2033. The inherent properties of ESO, such as its non-toxic nature, biodegradability, and excellent compatibility with PVC and other polymers, make it an increasingly sought-after bio-based plasticizer and stabilizer across various industries. Key demand sectors include the medical industry, where its safety profile is paramount for applications like medical tubing and films, and the food industry, for packaging materials and food contact applications. Furthermore, its utility in industrial applications, ranging from lubricants to coatings, continues to fuel its adoption. The growing consumer and regulatory pressure for sustainable and environmentally friendly alternatives to traditional phthalate-based plasticizers is a significant tailwind for the ESO market, positioning it for sustained relevance and expansion in the global chemical landscape.
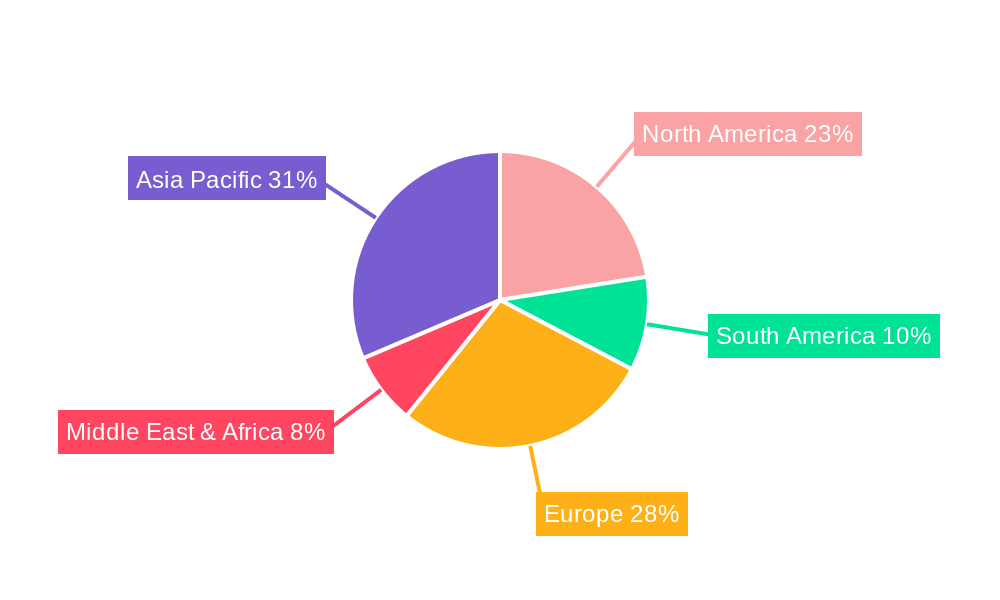
The market's trajectory will be shaped by advancements in production technologies, particularly Ring Opening Polymerization and Reaction with Maleic Anhydride, which are likely to enhance efficiency and cost-effectiveness. However, potential restraints such as the volatility of raw material prices (soybean oil) and the emergence of competing bio-based plasticizers could influence the pace of growth. Geographically, the Asia Pacific region, led by China and India, is expected to be a major consumer due to its burgeoning industrial base and increasing demand for sustainable materials. North America and Europe, with their strong regulatory push for green chemicals and advanced manufacturing sectors, will also contribute significantly to market value. Companies like Arkema, CHS, and Galata Chemicals are at the forefront of innovation and market penetration, constantly seeking to optimize production and expand their product portfolios to meet the evolving needs of diverse end-use industries, ensuring the continued development and adoption of epoxidized soybean oil.
Epoxidized Soybean Oil Market Dynamics & Structure
The global Epoxidized Soybean Oil (ESO) market exhibits a moderately concentrated structure, driven by a blend of established global players and regional specialists. Technological innovation plays a pivotal role, with continuous advancements in production efficiency and product purity influencing market competitiveness. The increasing demand for bio-based and sustainable plasticizers is a significant technological driver, pushing research into novel synthesis routes and enhanced ESO functionalities. Regulatory frameworks, particularly concerning food contact materials and medical device safety, are critical determinants of market access and product development. Compliance with stringent standards like FDA and REACH mandates shapes product formulations and manufacturing processes. Competitive product substitutes, including phthalate-based plasticizers and other bio-based alternatives, pose a constant challenge, necessitating continuous innovation and cost optimization for ESO. End-user demographics are increasingly favoring environmentally conscious materials, directly impacting the demand for ESO across various applications. Mergers and acquisitions (M&A) trends indicate strategic consolidation and vertical integration as key players aim to secure supply chains and expand market reach. For instance, the acquisition of raw material suppliers or downstream distributors can significantly alter market concentration and competitive landscapes.
- Market Concentration: Moderately concentrated, with key players holding significant market share.
- Technological Innovation Drivers: Focus on bio-based sourcing, improved purity, and enhanced performance characteristics.
- Regulatory Frameworks: Stringent regulations for food contact (FDA) and medical applications (REACH), influencing product development.
- Competitive Product Substitutes: Phthalate plasticizers and other bio-based alternatives.
- End-User Demographics: Growing preference for sustainable and bio-derived materials.
- M&A Trends: Strategic acquisitions for supply chain control and market expansion, with approximately 2-3 significant deals anticipated annually.
Epoxidized Soybean Oil Growth Trends & Insights
The Epoxidized Soybean Oil market is poised for robust growth, driven by a confluence of escalating environmental consciousness and evolving industrial requirements. The projected market size for ESO is expected to reach approximately $3,500 million by 2025, with a Compound Annual Growth Rate (CAGR) of 5.8% anticipated from 2025 to 2033. This upward trajectory is fueled by a significant increase in the adoption rates of bio-based plasticizers across a multitude of sectors. Consumer behavior is shifting demonstrably towards products with a reduced environmental footprint, directly translating into higher demand for ESO in applications ranging from food packaging to medical devices. Technological disruptions are emerging, with ongoing research into more efficient epoxidation processes and the development of specialized ESO grades tailored for high-performance applications. The inherent renewability and biodegradability of ESO position it favorably against traditional petroleum-based plasticizers, which face increasing scrutiny due to environmental concerns.
The historical period from 2019 to 2024 witnessed a steady market expansion, laying a strong foundation for future growth. The base year of 2025 marks a critical juncture, with an estimated market value of $3,500 million. From this point forward, the forecast period of 2025–2033 is projected to experience sustained expansion. The industrial segment, encompassing PVC processing, coatings, and adhesives, will continue to be a dominant consumer of ESO. However, the medical and food sectors are anticipated to exhibit higher growth rates due to stringent regulations favoring safer, non-toxic plasticizers. The "green" appeal of ESO is a powerful market penetration driver, allowing it to capture market share from less sustainable alternatives. Companies are investing heavily in R&D to optimize ESO's performance, such as improving its low-temperature flexibility and thermal stability, further enhancing its competitiveness. This sustained innovation, coupled with increasing regulatory pressures on conventional plasticizers, will ensure ESO maintains its growth momentum throughout the forecast period. The global market penetration of ESO is estimated to be around 15% in the broader plasticizer market in 2025, with expectations to grow to 22% by 2033. The increasing awareness of health implications associated with traditional plasticizers is a significant behavioral shift that directly benefits the ESO market, driving demand for safer alternatives.
Dominant Regions, Countries, or Segments in Epoxidized Soybean Oil
North America is emerging as a dominant region in the Epoxidized Soybean Oil market, primarily driven by robust regulatory support for bio-based materials and a mature industrial landscape. The United States, in particular, spearheads this growth due to its advanced manufacturing sector and increasing consumer preference for sustainable products. Government initiatives promoting the use of renewable resources and stringent regulations on hazardous chemicals further bolster the demand for ESO. The industrial segment within North America represents a significant market share, accounting for approximately 55% of the regional consumption. This segment encompasses a wide array of applications, including PVC products like flooring, cables, and films, as well as coatings, adhesives, and sealants. The sheer volume of manufacturing in this region, coupled with a strong emphasis on product safety and environmental compliance, makes it a prime market for ESO.
The application segment of Industrial stands out as the primary growth driver globally, contributing an estimated 60% to the overall market revenue in 2025. This dominance is attributed to the widespread use of ESO as a secondary plasticizer and stabilizer in flexible PVC applications. Its ability to improve heat and light stability, coupled with its cost-effectiveness, makes it an indispensable additive in the manufacturing of construction materials, automotive components, and packaging films. The "Reaction with Maleic Anhydride" mode of production is particularly prevalent in this segment, enabling the synthesis of ESO with specific performance characteristics suitable for various industrial formulations. The market share of this particular production method is estimated at 65% of the total ESO production in 2025, owing to its established scalability and cost-efficiency.
Within the industrial application, the dominance is further fueled by the construction industry's demand for PVC-based products like pipes, profiles, and flooring, which require effective plasticizers for flexibility and durability. The automotive sector's increasing use of PVC for interior and exterior components also contributes significantly. Furthermore, the coatings and adhesives industries utilize ESO to enhance the flexibility and adhesion properties of their products, often in conjunction with other binders and additives. The economic policies in North America, such as tax incentives for bio-based products and research grants for sustainable materials, act as significant catalysts for market expansion. The robust infrastructure for chemical manufacturing and distribution also ensures a consistent supply of ESO to meet the burgeoning demand. While medical and food applications are experiencing higher growth rates, the sheer volume of industrial consumption solidifies its position as the dominant segment in the current market landscape. The market share of the Industrial segment is predicted to grow at a CAGR of 5.5% between 2025 and 2033.
Epoxidized Soybean Oil Product Landscape
The Epoxidized Soybean Oil product landscape is characterized by continuous innovation focused on enhancing performance and expanding applications. Key product developments include improved grades with higher epoxidation levels for superior stabilization, and specialized formulations offering better low-temperature flexibility and heat resistance. These advancements cater to evolving demands in sectors like medical tubing, food packaging films, and automotive interiors, where enhanced material properties are paramount. The unique selling proposition of ESO lies in its bio-based origin, non-toxicity, and excellent plasticizing and stabilizing capabilities, making it a sustainable alternative to traditional plasticizers. Technological advancements are also enabling the development of ESO with tailored viscosity and compatibility for various polymer matrices.
Key Drivers, Barriers & Challenges in Epoxidized Soybean Oil
The Epoxidized Soybean Oil market is propelled by several key drivers, primarily the growing global demand for bio-based and sustainable plasticizers. Increasing environmental regulations, particularly concerning the health risks associated with phthalate-based plasticizers, are a significant catalyst. The non-toxic and biodegradable nature of ESO makes it an attractive alternative for food contact and medical applications. Furthermore, its dual functionality as a plasticizer and a secondary stabilizer for PVC enhances its appeal across various industries.
However, the market faces several barriers and challenges. Fluctuations in soybean oil prices, influenced by agricultural yields and global commodity markets, can impact ESO production costs and pricing strategies. Competition from other bio-based plasticizers and established petroleum-based alternatives presents a constant challenge. Supply chain disruptions, especially those related to agricultural inputs or geopolitical events, can also pose a threat. Achieving consistent product quality and meeting stringent regulatory requirements for specific high-purity applications can be complex and costly.
Emerging Opportunities in Epoxidized Soybean Oil
Emerging opportunities for Epoxidized Soybean Oil lie in the expanding use of biodegradable and compostable plastics, where ESO can serve as a crucial component to enhance flexibility and processing. Untapped markets in developing economies with growing awareness of sustainability and health concerns present significant growth potential. Innovative applications in specialized coatings, bio-based adhesives, and advanced composite materials are also on the horizon. Evolving consumer preferences for 'green' products will continue to drive demand across various sectors, creating a fertile ground for ESO's market penetration.
Growth Accelerators in the Epoxidized Soybean Oil Industry
Long-term growth in the Epoxidized Soybean Oil industry will be significantly accelerated by technological breakthroughs in enhancing its performance characteristics, such as improved thermal stability and compatibility with a wider range of polymers. Strategic partnerships between ESO manufacturers and end-users, particularly in the medical and food sectors, will foster co-development and tailor-made solutions. Market expansion strategies focusing on regions with increasing environmental awareness and stricter regulations will be crucial. Furthermore, advancements in sustainable agricultural practices for soybean cultivation can contribute to a more stable and cost-effective supply chain, further boosting industry growth.
Key Players Shaping the Epoxidized Soybean Oil Market
- Arkema
- CHS
- Galata Chemicals
- The Chemical Company
- American Chemical Service
- Makwell Plasticizers Pvt. Ltd.
- AM Stabilizers
- Changchun Corporation
- Nanya Plastics Corporation
- Hairma Chemicals
- Hebei Jingu Plasticizer
- Xinjinlong Chemical Additives
- Longda Oil Technology
- Puyang Chengyi Plasticizer
- Baolilai Plastic Additives
- Longda Chemical
- Shenzhen Jianjing Plastic Additives
- Shenzhen Kaiqi Chemicals
- Chaohu Xiangfeng Plastic Aids
- Qingzhou City East Industrial
Notable Milestones in Epoxidized Soybean Oil Sector
- 2019: Increased regulatory scrutiny on phthalate plasticizers in Europe, driving demand for bio-based alternatives like ESO.
- 2020: Launch of new grades of ESO with enhanced UV stability for outdoor applications.
- 2021: Major investments in R&D by leading chemical companies to improve the efficiency of ESO production.
- 2022: Growing adoption of ESO in the medical device industry due to its non-toxic properties.
- 2023: Expansion of production capacity by several key players to meet rising global demand.
- Early 2024: Development of specialized ESO formulations for advanced food packaging solutions.
In-Depth Epoxidized Soybean Oil Market Outlook
The Epoxidized Soybean Oil market outlook is exceptionally positive, fueled by the persistent global drive towards sustainability and the increasing demand for safer chemical additives. Growth accelerators will continue to be driven by technological advancements that enhance ESO’s performance and cost-effectiveness, making it a more compelling substitute for traditional plasticizers. Strategic collaborations and market expansion into emerging economies, coupled with a strong regulatory push for bio-based materials, will further solidify its market position. The focus on innovative applications in sensitive sectors like medical and food packaging, alongside its established role in industrial PVC, indicates a diversified and robust future for ESO, promising substantial market potential and lucrative opportunities for stakeholders.
Epoxidized Soybean Oil Segmentation
-
1. Application
- 1.1. Medical
- 1.2. Food
- 1.3. Industrial
-
2. Types
- 2.1. Mode of Production: Ring Opening Polymerization
- 2.2. Mode of Production: Reaction with Maleic Anhydride
Epoxidized Soybean Oil Segmentation By Geography
-
1. North America
- 1.1. United States
- 1.2. Canada
- 1.3. Mexico
-
2. South America
- 2.1. Brazil
- 2.2. Argentina
- 2.3. Rest of South America
-
3. Europe
- 3.1. United Kingdom
- 3.2. Germany
- 3.3. France
- 3.4. Italy
- 3.5. Spain
- 3.6. Russia
- 3.7. Benelux
- 3.8. Nordics
- 3.9. Rest of Europe
-
4. Middle East & Africa
- 4.1. Turkey
- 4.2. Israel
- 4.3. GCC
- 4.4. North Africa
- 4.5. South Africa
- 4.6. Rest of Middle East & Africa
-
5. Asia Pacific
- 5.1. China
- 5.2. India
- 5.3. Japan
- 5.4. South Korea
- 5.5. ASEAN
- 5.6. Oceania
- 5.7. Rest of Asia Pacific
Epoxidized Soybean Oil REPORT HIGHLIGHTS
| Aspects | Details |
|---|---|
| Study Period | 2019-2033 |
| Base Year | 2024 |
| Estimated Year | 2025 |
| Forecast Period | 2025-2033 |
| Historical Period | 2019-2024 |
| Growth Rate | CAGR of 2.8% from 2019-2033 |
| Segmentation |
|
Table of Contents
- 1. Introduction
- 1.1. Research Scope
- 1.2. Market Segmentation
- 1.3. Research Methodology
- 1.4. Definitions and Assumptions
- 2. Executive Summary
- 2.1. Introduction
- 3. Market Dynamics
- 3.1. Introduction
- 3.2. Market Drivers
- 3.3. Market Restrains
- 3.4. Market Trends
- 4. Market Factor Analysis
- 4.1. Porters Five Forces
- 4.2. Supply/Value Chain
- 4.3. PESTEL analysis
- 4.4. Market Entropy
- 4.5. Patent/Trademark Analysis
- 5. Global Epoxidized Soybean Oil Analysis, Insights and Forecast, 2019-2031
- 5.1. Market Analysis, Insights and Forecast - by Application
- 5.1.1. Medical
- 5.1.2. Food
- 5.1.3. Industrial
- 5.2. Market Analysis, Insights and Forecast - by Types
- 5.2.1. Mode of Production: Ring Opening Polymerization
- 5.2.2. Mode of Production: Reaction with Maleic Anhydride
- 5.3. Market Analysis, Insights and Forecast - by Region
- 5.3.1. North America
- 5.3.2. South America
- 5.3.3. Europe
- 5.3.4. Middle East & Africa
- 5.3.5. Asia Pacific
- 5.1. Market Analysis, Insights and Forecast - by Application
- 6. North America Epoxidized Soybean Oil Analysis, Insights and Forecast, 2019-2031
- 6.1. Market Analysis, Insights and Forecast - by Application
- 6.1.1. Medical
- 6.1.2. Food
- 6.1.3. Industrial
- 6.2. Market Analysis, Insights and Forecast - by Types
- 6.2.1. Mode of Production: Ring Opening Polymerization
- 6.2.2. Mode of Production: Reaction with Maleic Anhydride
- 6.1. Market Analysis, Insights and Forecast - by Application
- 7. South America Epoxidized Soybean Oil Analysis, Insights and Forecast, 2019-2031
- 7.1. Market Analysis, Insights and Forecast - by Application
- 7.1.1. Medical
- 7.1.2. Food
- 7.1.3. Industrial
- 7.2. Market Analysis, Insights and Forecast - by Types
- 7.2.1. Mode of Production: Ring Opening Polymerization
- 7.2.2. Mode of Production: Reaction with Maleic Anhydride
- 7.1. Market Analysis, Insights and Forecast - by Application
- 8. Europe Epoxidized Soybean Oil Analysis, Insights and Forecast, 2019-2031
- 8.1. Market Analysis, Insights and Forecast - by Application
- 8.1.1. Medical
- 8.1.2. Food
- 8.1.3. Industrial
- 8.2. Market Analysis, Insights and Forecast - by Types
- 8.2.1. Mode of Production: Ring Opening Polymerization
- 8.2.2. Mode of Production: Reaction with Maleic Anhydride
- 8.1. Market Analysis, Insights and Forecast - by Application
- 9. Middle East & Africa Epoxidized Soybean Oil Analysis, Insights and Forecast, 2019-2031
- 9.1. Market Analysis, Insights and Forecast - by Application
- 9.1.1. Medical
- 9.1.2. Food
- 9.1.3. Industrial
- 9.2. Market Analysis, Insights and Forecast - by Types
- 9.2.1. Mode of Production: Ring Opening Polymerization
- 9.2.2. Mode of Production: Reaction with Maleic Anhydride
- 9.1. Market Analysis, Insights and Forecast - by Application
- 10. Asia Pacific Epoxidized Soybean Oil Analysis, Insights and Forecast, 2019-2031
- 10.1. Market Analysis, Insights and Forecast - by Application
- 10.1.1. Medical
- 10.1.2. Food
- 10.1.3. Industrial
- 10.2. Market Analysis, Insights and Forecast - by Types
- 10.2.1. Mode of Production: Ring Opening Polymerization
- 10.2.2. Mode of Production: Reaction with Maleic Anhydride
- 10.1. Market Analysis, Insights and Forecast - by Application
- 11. Competitive Analysis
- 11.1. Global Market Share Analysis 2024
- 11.2. Company Profiles
- 11.2.1 Arkema
- 11.2.1.1. Overview
- 11.2.1.2. Products
- 11.2.1.3. SWOT Analysis
- 11.2.1.4. Recent Developments
- 11.2.1.5. Financials (Based on Availability)
- 11.2.2 CHS
- 11.2.2.1. Overview
- 11.2.2.2. Products
- 11.2.2.3. SWOT Analysis
- 11.2.2.4. Recent Developments
- 11.2.2.5. Financials (Based on Availability)
- 11.2.3 Galata Chemicals
- 11.2.3.1. Overview
- 11.2.3.2. Products
- 11.2.3.3. SWOT Analysis
- 11.2.3.4. Recent Developments
- 11.2.3.5. Financials (Based on Availability)
- 11.2.4 The Chemical Company
- 11.2.4.1. Overview
- 11.2.4.2. Products
- 11.2.4.3. SWOT Analysis
- 11.2.4.4. Recent Developments
- 11.2.4.5. Financials (Based on Availability)
- 11.2.5 American Chemical Service
- 11.2.5.1. Overview
- 11.2.5.2. Products
- 11.2.5.3. SWOT Analysis
- 11.2.5.4. Recent Developments
- 11.2.5.5. Financials (Based on Availability)
- 11.2.6 Makwell Plasticizers Pvt. Ltd.
- 11.2.6.1. Overview
- 11.2.6.2. Products
- 11.2.6.3. SWOT Analysis
- 11.2.6.4. Recent Developments
- 11.2.6.5. Financials (Based on Availability)
- 11.2.7 AM Stabilizers
- 11.2.7.1. Overview
- 11.2.7.2. Products
- 11.2.7.3. SWOT Analysis
- 11.2.7.4. Recent Developments
- 11.2.7.5. Financials (Based on Availability)
- 11.2.8 Changchun Corporation
- 11.2.8.1. Overview
- 11.2.8.2. Products
- 11.2.8.3. SWOT Analysis
- 11.2.8.4. Recent Developments
- 11.2.8.5. Financials (Based on Availability)
- 11.2.9 Nanya Plastics Corporation
- 11.2.9.1. Overview
- 11.2.9.2. Products
- 11.2.9.3. SWOT Analysis
- 11.2.9.4. Recent Developments
- 11.2.9.5. Financials (Based on Availability)
- 11.2.10 Hairma Chemicals
- 11.2.10.1. Overview
- 11.2.10.2. Products
- 11.2.10.3. SWOT Analysis
- 11.2.10.4. Recent Developments
- 11.2.10.5. Financials (Based on Availability)
- 11.2.11 Hebei Jingu Plasticizer
- 11.2.11.1. Overview
- 11.2.11.2. Products
- 11.2.11.3. SWOT Analysis
- 11.2.11.4. Recent Developments
- 11.2.11.5. Financials (Based on Availability)
- 11.2.12 Xinjinlong Chemical Additives
- 11.2.12.1. Overview
- 11.2.12.2. Products
- 11.2.12.3. SWOT Analysis
- 11.2.12.4. Recent Developments
- 11.2.12.5. Financials (Based on Availability)
- 11.2.13 Longda Oil Technology
- 11.2.13.1. Overview
- 11.2.13.2. Products
- 11.2.13.3. SWOT Analysis
- 11.2.13.4. Recent Developments
- 11.2.13.5. Financials (Based on Availability)
- 11.2.14 Puyang Chengyi Plasticizer
- 11.2.14.1. Overview
- 11.2.14.2. Products
- 11.2.14.3. SWOT Analysis
- 11.2.14.4. Recent Developments
- 11.2.14.5. Financials (Based on Availability)
- 11.2.15 Baolilai Plastic Additives
- 11.2.15.1. Overview
- 11.2.15.2. Products
- 11.2.15.3. SWOT Analysis
- 11.2.15.4. Recent Developments
- 11.2.15.5. Financials (Based on Availability)
- 11.2.16 Longda Chemical
- 11.2.16.1. Overview
- 11.2.16.2. Products
- 11.2.16.3. SWOT Analysis
- 11.2.16.4. Recent Developments
- 11.2.16.5. Financials (Based on Availability)
- 11.2.17 Shenzhen Jianjing Plastic Additives
- 11.2.17.1. Overview
- 11.2.17.2. Products
- 11.2.17.3. SWOT Analysis
- 11.2.17.4. Recent Developments
- 11.2.17.5. Financials (Based on Availability)
- 11.2.18 Shenzhen Kaiqi Chemicals
- 11.2.18.1. Overview
- 11.2.18.2. Products
- 11.2.18.3. SWOT Analysis
- 11.2.18.4. Recent Developments
- 11.2.18.5. Financials (Based on Availability)
- 11.2.19 Chaohu Xiangfeng Plastic Aids
- 11.2.19.1. Overview
- 11.2.19.2. Products
- 11.2.19.3. SWOT Analysis
- 11.2.19.4. Recent Developments
- 11.2.19.5. Financials (Based on Availability)
- 11.2.20 Qingzhou City East Industrial
- 11.2.20.1. Overview
- 11.2.20.2. Products
- 11.2.20.3. SWOT Analysis
- 11.2.20.4. Recent Developments
- 11.2.20.5. Financials (Based on Availability)
- 11.2.1 Arkema
List of Figures
- Figure 1: Global Epoxidized Soybean Oil Revenue Breakdown (million, %) by Region 2024 & 2032
- Figure 2: North America Epoxidized Soybean Oil Revenue (million), by Application 2024 & 2032
- Figure 3: North America Epoxidized Soybean Oil Revenue Share (%), by Application 2024 & 2032
- Figure 4: North America Epoxidized Soybean Oil Revenue (million), by Types 2024 & 2032
- Figure 5: North America Epoxidized Soybean Oil Revenue Share (%), by Types 2024 & 2032
- Figure 6: North America Epoxidized Soybean Oil Revenue (million), by Country 2024 & 2032
- Figure 7: North America Epoxidized Soybean Oil Revenue Share (%), by Country 2024 & 2032
- Figure 8: South America Epoxidized Soybean Oil Revenue (million), by Application 2024 & 2032
- Figure 9: South America Epoxidized Soybean Oil Revenue Share (%), by Application 2024 & 2032
- Figure 10: South America Epoxidized Soybean Oil Revenue (million), by Types 2024 & 2032
- Figure 11: South America Epoxidized Soybean Oil Revenue Share (%), by Types 2024 & 2032
- Figure 12: South America Epoxidized Soybean Oil Revenue (million), by Country 2024 & 2032
- Figure 13: South America Epoxidized Soybean Oil Revenue Share (%), by Country 2024 & 2032
- Figure 14: Europe Epoxidized Soybean Oil Revenue (million), by Application 2024 & 2032
- Figure 15: Europe Epoxidized Soybean Oil Revenue Share (%), by Application 2024 & 2032
- Figure 16: Europe Epoxidized Soybean Oil Revenue (million), by Types 2024 & 2032
- Figure 17: Europe Epoxidized Soybean Oil Revenue Share (%), by Types 2024 & 2032
- Figure 18: Europe Epoxidized Soybean Oil Revenue (million), by Country 2024 & 2032
- Figure 19: Europe Epoxidized Soybean Oil Revenue Share (%), by Country 2024 & 2032
- Figure 20: Middle East & Africa Epoxidized Soybean Oil Revenue (million), by Application 2024 & 2032
- Figure 21: Middle East & Africa Epoxidized Soybean Oil Revenue Share (%), by Application 2024 & 2032
- Figure 22: Middle East & Africa Epoxidized Soybean Oil Revenue (million), by Types 2024 & 2032
- Figure 23: Middle East & Africa Epoxidized Soybean Oil Revenue Share (%), by Types 2024 & 2032
- Figure 24: Middle East & Africa Epoxidized Soybean Oil Revenue (million), by Country 2024 & 2032
- Figure 25: Middle East & Africa Epoxidized Soybean Oil Revenue Share (%), by Country 2024 & 2032
- Figure 26: Asia Pacific Epoxidized Soybean Oil Revenue (million), by Application 2024 & 2032
- Figure 27: Asia Pacific Epoxidized Soybean Oil Revenue Share (%), by Application 2024 & 2032
- Figure 28: Asia Pacific Epoxidized Soybean Oil Revenue (million), by Types 2024 & 2032
- Figure 29: Asia Pacific Epoxidized Soybean Oil Revenue Share (%), by Types 2024 & 2032
- Figure 30: Asia Pacific Epoxidized Soybean Oil Revenue (million), by Country 2024 & 2032
- Figure 31: Asia Pacific Epoxidized Soybean Oil Revenue Share (%), by Country 2024 & 2032
List of Tables
- Table 1: Global Epoxidized Soybean Oil Revenue million Forecast, by Region 2019 & 2032
- Table 2: Global Epoxidized Soybean Oil Revenue million Forecast, by Application 2019 & 2032
- Table 3: Global Epoxidized Soybean Oil Revenue million Forecast, by Types 2019 & 2032
- Table 4: Global Epoxidized Soybean Oil Revenue million Forecast, by Region 2019 & 2032
- Table 5: Global Epoxidized Soybean Oil Revenue million Forecast, by Application 2019 & 2032
- Table 6: Global Epoxidized Soybean Oil Revenue million Forecast, by Types 2019 & 2032
- Table 7: Global Epoxidized Soybean Oil Revenue million Forecast, by Country 2019 & 2032
- Table 8: United States Epoxidized Soybean Oil Revenue (million) Forecast, by Application 2019 & 2032
- Table 9: Canada Epoxidized Soybean Oil Revenue (million) Forecast, by Application 2019 & 2032
- Table 10: Mexico Epoxidized Soybean Oil Revenue (million) Forecast, by Application 2019 & 2032
- Table 11: Global Epoxidized Soybean Oil Revenue million Forecast, by Application 2019 & 2032
- Table 12: Global Epoxidized Soybean Oil Revenue million Forecast, by Types 2019 & 2032
- Table 13: Global Epoxidized Soybean Oil Revenue million Forecast, by Country 2019 & 2032
- Table 14: Brazil Epoxidized Soybean Oil Revenue (million) Forecast, by Application 2019 & 2032
- Table 15: Argentina Epoxidized Soybean Oil Revenue (million) Forecast, by Application 2019 & 2032
- Table 16: Rest of South America Epoxidized Soybean Oil Revenue (million) Forecast, by Application 2019 & 2032
- Table 17: Global Epoxidized Soybean Oil Revenue million Forecast, by Application 2019 & 2032
- Table 18: Global Epoxidized Soybean Oil Revenue million Forecast, by Types 2019 & 2032
- Table 19: Global Epoxidized Soybean Oil Revenue million Forecast, by Country 2019 & 2032
- Table 20: United Kingdom Epoxidized Soybean Oil Revenue (million) Forecast, by Application 2019 & 2032
- Table 21: Germany Epoxidized Soybean Oil Revenue (million) Forecast, by Application 2019 & 2032
- Table 22: France Epoxidized Soybean Oil Revenue (million) Forecast, by Application 2019 & 2032
- Table 23: Italy Epoxidized Soybean Oil Revenue (million) Forecast, by Application 2019 & 2032
- Table 24: Spain Epoxidized Soybean Oil Revenue (million) Forecast, by Application 2019 & 2032
- Table 25: Russia Epoxidized Soybean Oil Revenue (million) Forecast, by Application 2019 & 2032
- Table 26: Benelux Epoxidized Soybean Oil Revenue (million) Forecast, by Application 2019 & 2032
- Table 27: Nordics Epoxidized Soybean Oil Revenue (million) Forecast, by Application 2019 & 2032
- Table 28: Rest of Europe Epoxidized Soybean Oil Revenue (million) Forecast, by Application 2019 & 2032
- Table 29: Global Epoxidized Soybean Oil Revenue million Forecast, by Application 2019 & 2032
- Table 30: Global Epoxidized Soybean Oil Revenue million Forecast, by Types 2019 & 2032
- Table 31: Global Epoxidized Soybean Oil Revenue million Forecast, by Country 2019 & 2032
- Table 32: Turkey Epoxidized Soybean Oil Revenue (million) Forecast, by Application 2019 & 2032
- Table 33: Israel Epoxidized Soybean Oil Revenue (million) Forecast, by Application 2019 & 2032
- Table 34: GCC Epoxidized Soybean Oil Revenue (million) Forecast, by Application 2019 & 2032
- Table 35: North Africa Epoxidized Soybean Oil Revenue (million) Forecast, by Application 2019 & 2032
- Table 36: South Africa Epoxidized Soybean Oil Revenue (million) Forecast, by Application 2019 & 2032
- Table 37: Rest of Middle East & Africa Epoxidized Soybean Oil Revenue (million) Forecast, by Application 2019 & 2032
- Table 38: Global Epoxidized Soybean Oil Revenue million Forecast, by Application 2019 & 2032
- Table 39: Global Epoxidized Soybean Oil Revenue million Forecast, by Types 2019 & 2032
- Table 40: Global Epoxidized Soybean Oil Revenue million Forecast, by Country 2019 & 2032
- Table 41: China Epoxidized Soybean Oil Revenue (million) Forecast, by Application 2019 & 2032
- Table 42: India Epoxidized Soybean Oil Revenue (million) Forecast, by Application 2019 & 2032
- Table 43: Japan Epoxidized Soybean Oil Revenue (million) Forecast, by Application 2019 & 2032
- Table 44: South Korea Epoxidized Soybean Oil Revenue (million) Forecast, by Application 2019 & 2032
- Table 45: ASEAN Epoxidized Soybean Oil Revenue (million) Forecast, by Application 2019 & 2032
- Table 46: Oceania Epoxidized Soybean Oil Revenue (million) Forecast, by Application 2019 & 2032
- Table 47: Rest of Asia Pacific Epoxidized Soybean Oil Revenue (million) Forecast, by Application 2019 & 2032
Frequently Asked Questions
1. What is the projected Compound Annual Growth Rate (CAGR) of the Epoxidized Soybean Oil?
The projected CAGR is approximately 2.8%.
2. Which companies are prominent players in the Epoxidized Soybean Oil?
Key companies in the market include Arkema, CHS, Galata Chemicals, The Chemical Company, American Chemical Service, Makwell Plasticizers Pvt. Ltd., AM Stabilizers, Changchun Corporation, Nanya Plastics Corporation, Hairma Chemicals, Hebei Jingu Plasticizer, Xinjinlong Chemical Additives, Longda Oil Technology, Puyang Chengyi Plasticizer, Baolilai Plastic Additives, Longda Chemical, Shenzhen Jianjing Plastic Additives, Shenzhen Kaiqi Chemicals, Chaohu Xiangfeng Plastic Aids, Qingzhou City East Industrial.
3. What are the main segments of the Epoxidized Soybean Oil?
The market segments include Application, Types.
4. Can you provide details about the market size?
The market size is estimated to be USD 959.4 million as of 2022.
5. What are some drivers contributing to market growth?
N/A
6. What are the notable trends driving market growth?
N/A
7. Are there any restraints impacting market growth?
N/A
8. Can you provide examples of recent developments in the market?
N/A
9. What pricing options are available for accessing the report?
Pricing options include single-user, multi-user, and enterprise licenses priced at USD 5600.00, USD 8400.00, and USD 11200.00 respectively.
10. Is the market size provided in terms of value or volume?
The market size is provided in terms of value, measured in million.
11. Are there any specific market keywords associated with the report?
Yes, the market keyword associated with the report is "Epoxidized Soybean Oil," which aids in identifying and referencing the specific market segment covered.
12. How do I determine which pricing option suits my needs best?
The pricing options vary based on user requirements and access needs. Individual users may opt for single-user licenses, while businesses requiring broader access may choose multi-user or enterprise licenses for cost-effective access to the report.
13. Are there any additional resources or data provided in the Epoxidized Soybean Oil report?
While the report offers comprehensive insights, it's advisable to review the specific contents or supplementary materials provided to ascertain if additional resources or data are available.
14. How can I stay updated on further developments or reports in the Epoxidized Soybean Oil?
To stay informed about further developments, trends, and reports in the Epoxidized Soybean Oil, consider subscribing to industry newsletters, following relevant companies and organizations, or regularly checking reputable industry news sources and publications.
Methodology
Step 1 - Identification of Relevant Samples Size from Population Database


Step 2 - Approaches for Defining Global Market Size (Value, Volume* & Price*)

Note*: In applicable scenarios
Step 3 - Data Sources
Primary Research
- Web Analytics
- Survey Reports
- Research Institute
- Latest Research Reports
- Opinion Leaders
Secondary Research
- Annual Reports
- White Paper
- Latest Press Release
- Industry Association
- Paid Database
- Investor Presentations

Step 4 - Data Triangulation
Involves using different sources of information in order to increase the validity of a study
These sources are likely to be stakeholders in a program - participants, other researchers, program staff, other community members, and so on.
Then we put all data in single framework & apply various statistical tools to find out the dynamic on the market.
During the analysis stage, feedback from the stakeholder groups would be compared to determine areas of agreement as well as areas of divergence
