

Key Insights
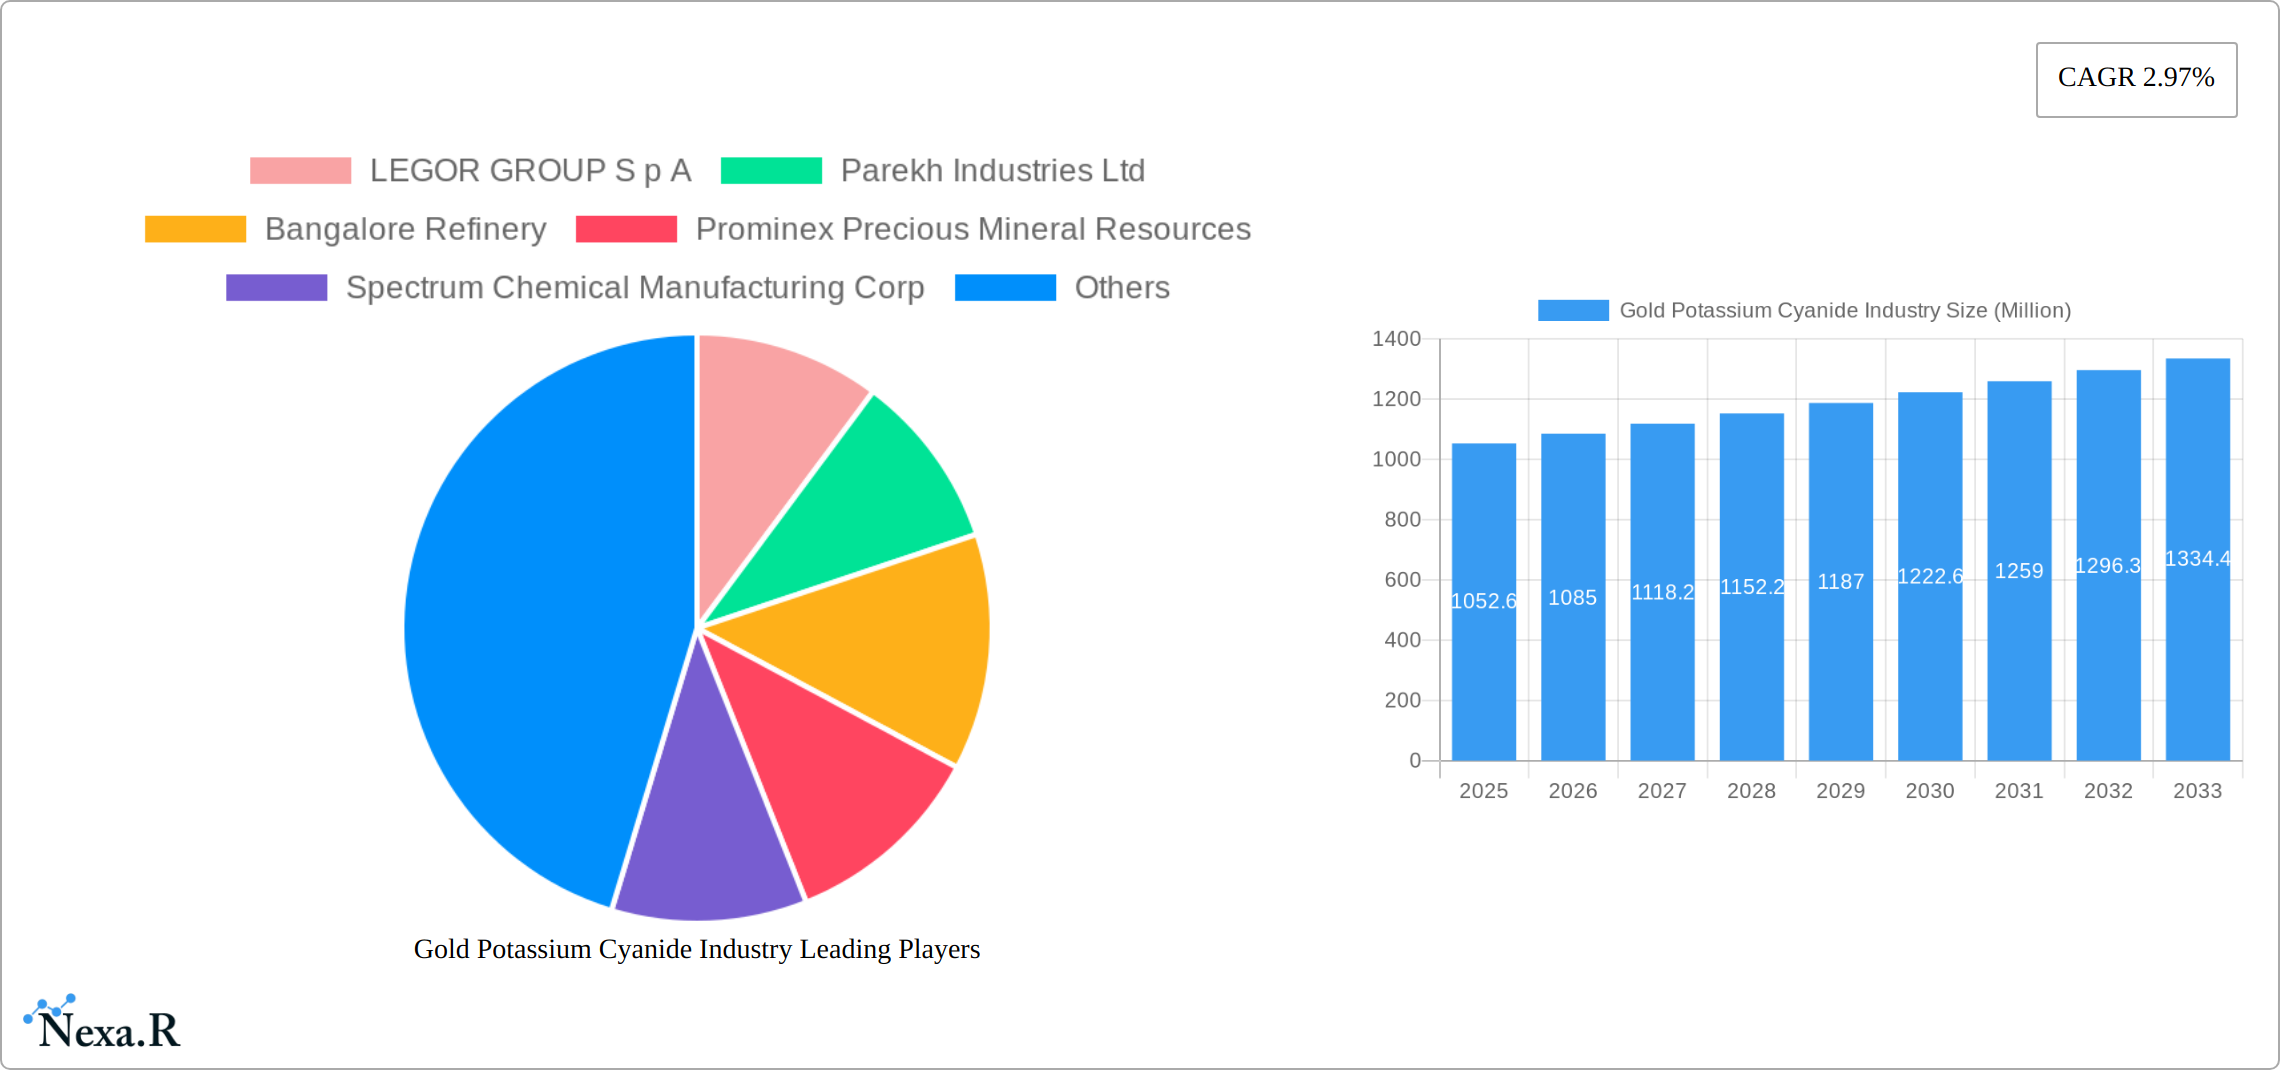
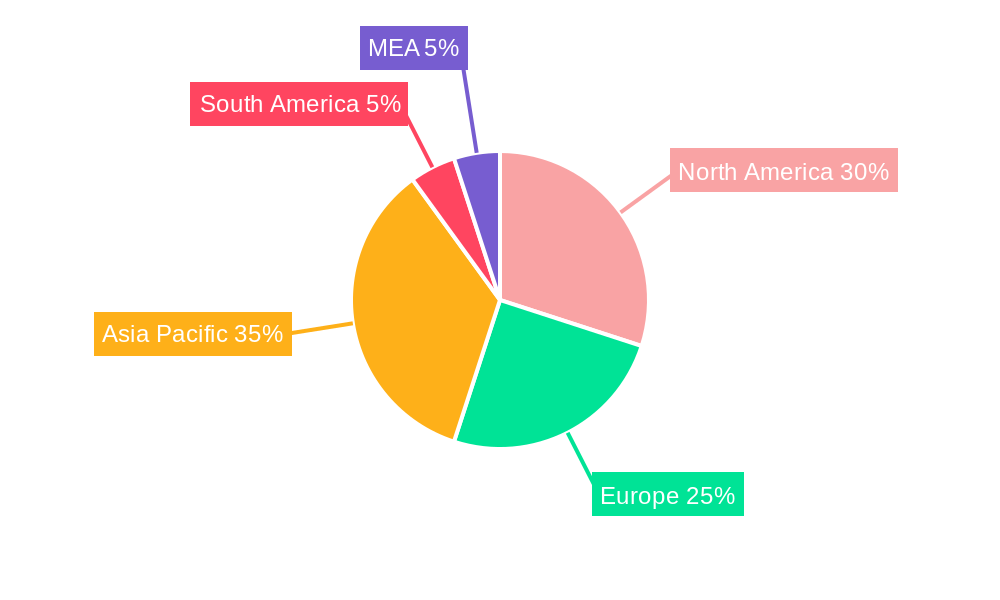
The global gold potassium cyanide market, valued at $1052.6 million in 2025, is projected to experience steady growth, driven by its crucial role in the electroplating industry, particularly for gold plating in electronics and jewelry manufacturing. The market's Compound Annual Growth Rate (CAGR) of 2.97% from 2019-2024 indicates consistent demand, although this rate might slightly fluctuate based on economic conditions and fluctuating gold prices. High-purity gold potassium cyanide is expected to dominate the market due to its superior performance in applications demanding precise gold deposition, such as in electronics and high-end jewelry. The increasing demand for sophisticated electronic devices and the continued popularity of gold jewelry will fuel market expansion. However, stringent environmental regulations surrounding cyanide's toxicity pose a significant restraint, pushing manufacturers to adopt safer handling practices and explore alternative gold plating technologies. This necessitates significant investments in responsible manufacturing and waste management, impacting overall profitability. Geographic segmentation reveals strong market presence in North America and Asia-Pacific, driven by established manufacturing hubs and robust consumer demand. While Europe holds a considerable share, the market's growth potential lies in emerging economies within Asia-Pacific, particularly India and China, where manufacturing and jewelry sectors are rapidly expanding. The competitive landscape features both established players like Umicore Electroplating and LEGOR Group S p A, alongside smaller regional manufacturers. This blend fosters innovation and price competition, further shaping market dynamics.
The forecast period (2025-2033) anticipates continued growth, although the CAGR might be subject to minor adjustments reflecting global economic fluctuations and technological advancements. The increasing adoption of sustainable practices in the electroplating industry is likely to influence market strategies, driving innovation in safer and more environmentally friendly gold plating solutions. The market segmentation by application highlights the significant contribution of the electronics sector, which demands high-purity gold potassium cyanide for intricate circuitry. The decorative costume jewellery segment presents a considerable market opportunity due to increased demand for gold-plated accessories. Continuous research and development focused on enhancing the safety and efficiency of gold potassium cyanide handling will play a crucial role in shaping the market's trajectory.
Gold Potassium Cyanide Industry Market Report: 2019-2033
This comprehensive report provides an in-depth analysis of the Gold Potassium Cyanide industry, encompassing market dynamics, growth trends, regional analysis, product landscape, key players, and future outlook. The study covers the period from 2019 to 2033, with 2025 as the base year and forecast period spanning 2025-2033. The report utilizes data from various sources and incorporates expert insights to deliver a complete picture of this vital sector. The total market size in 2025 is estimated at xx Million.
Gold Potassium Cyanide Industry Market Dynamics & Structure
The Gold Potassium Cyanide market is characterized by a moderately concentrated landscape, with a few key players holding significant market share. Technological innovation, particularly in improving purity and reducing environmental impact, is a key driver. Stringent regulatory frameworks concerning the handling and disposal of cyanide compounds significantly influence market operations. Competitive substitutes, such as alternative electroplating solutions, pose a challenge to market growth. End-user demographics, primarily concentrated in the electronics and jewelry sectors, heavily influence demand. Mergers and acquisitions (M&A) activity remains moderate, with xx M&A deals recorded between 2019 and 2024, reflecting industry consolidation efforts.
- Market Concentration: Moderately concentrated, with top 5 players holding approximately xx% market share.
- Technological Innovation: Focus on improving purity levels (High Purity segment outpacing Low Purity), developing environmentally friendly alternatives, and enhancing process efficiency.
- Regulatory Framework: Stringent regulations governing cyanide handling and waste management impacting operational costs and market entry.
- Competitive Substitutes: Alternative electroplating solutions and materials posing a growing competitive threat.
- End-User Demographics: Dominated by the electronics and jewelry industries, with growing demand from other sectors like watches and decorative items.
- M&A Trends: xx M&A deals observed between 2019 and 2024, indicative of consolidation within the industry.
Gold Potassium Cyanide Industry Growth Trends & Insights
The Gold Potassium Cyanide market experienced consistent growth between 2019 and 2024, expanding from [Insert Specific Value] Million to [Insert Specific Value] Million, representing a Compound Annual Growth Rate (CAGR) of [Insert Specific Value]%. This expansion was fueled by increased demand from the electronics industry and the enduring popularity of gold-plated jewelry. Technological advancements, such as the development of high-purity cyanide compounds for specialized applications, significantly contributed to this market growth. The adoption rate of high-purity gold potassium cyanide surged, exceeding [Insert Specific Value]% in 2024, driven by its superior performance in demanding applications. Consumer preferences for sophisticated and durable electronics and jewelry are projected to further stimulate market expansion. The forecast period (2025-2033) anticipates a CAGR of [Insert Specific Value]%, with the market size projected to reach [Insert Specific Value] Million by 2033. This positive outlook is further supported by [Insert Supporting Data/Evidence, e.g., market research reports, industry expert opinions].
Dominant Regions, Countries, or Segments in Gold Potassium Cyanide Industry
The Asia-Pacific region currently holds the leading position in the Gold Potassium Cyanide market, propelled by the robust growth of its electronics manufacturing sector, especially in China and India. Within the application segments, Electroplating of Metals commands the largest market share, followed by Decorative Costume Jewellery. The high-purity segment demonstrates faster growth compared to its low-purity counterpart, reflecting the increasing demand for advanced electronic devices. [Insert Data on Market Share Percentage for each segment]. The growth in [Specific Region/Country] is particularly noteworthy due to [Specific Reason, e.g., government initiatives, favorable economic conditions].
- Key Drivers:
- Rapid industrialization and economic growth in Asia-Pacific, specifically in [mention specific countries with high growth].
- Expansion of the electronics manufacturing sector, driven by [mention specific factors like increased smartphone production or rising demand for electric vehicles].
- Rising demand for gold-plated jewelry, influenced by [mention specific trends, e.g., changing consumer preferences, fashion trends].
- Growing adoption of high-purity gold potassium cyanide in specialized applications, such as [mention specific applications, e.g., aerospace, medical devices].
- Dominance Factors:
- Strong manufacturing base and cost advantages in Asia-Pacific, particularly in [mention specific countries].
- High consumer demand for gold-plated products, driven by [mention factors like cultural preferences or economic prosperity].
- Government policies supporting industrial growth in [mention specific countries and policies].
- Growth Potential:
- Emerging markets in Africa and Latin America present significant untapped potential, particularly in [mention specific countries with high growth potential].
- Growth in high-purity applications, particularly in niche industries like [mention specific industries].
Gold Potassium Cyanide Industry Product Landscape
The Gold Potassium Cyanide market offers a diverse range of products with varying purity levels to meet the needs of diverse applications. High-purity gold potassium cyanide is preferred for sensitive applications requiring exceptional performance and quality. Product innovations are focused on enhancing purity levels, improving stability, reducing environmental impact, and developing more sustainable alternatives. [Mention specific examples of product innovations].
Key Drivers, Barriers & Challenges in Gold Potassium Cyanide Industry
Key Drivers:
- Rising demand from the electronics industry, driven by [mention specific technological advancements].
- Increasing consumption in the jewelry sector, fueled by [mention specific factors influencing this growth].
- Technological advancements leading to higher purity, greater efficiency, and reduced production costs.
Challenges:
- Stringent environmental regulations limiting cyanide usage, necessitating investment in [mention mitigation strategies].
- Price volatility of raw materials, particularly [mention specific raw materials], impacting profitability.
- Safety concerns associated with cyanide handling. The industry faces approximately [Insert Specific Value] Million in annual costs due to safety regulations and related liabilities. This necessitates ongoing investment in safety training and improved handling procedures.
Emerging Opportunities in Gold Potassium Cyanide Industry
- Expanding applications in niche sectors (e.g., medical devices).
- Development of eco-friendly alternatives to reduce environmental concerns.
- Focus on recycling and reuse of cyanide compounds to promote sustainability.
Growth Accelerators in the Gold Potassium Cyanide Industry Industry
Technological breakthroughs in cyanide production, enhancing purity and reducing environmental footprint, are significant growth catalysts. Strategic partnerships between chemical manufacturers and end-user industries facilitate market penetration. Expansion into untapped markets, especially in emerging economies, presents vast growth potential.
Key Players Shaping the Gold Potassium Cyanide Market
- LEGOR GROUP S p A
- Parekh Industries Ltd
- Bangalore Refinery
- Prominex Precious Mineral Resources
- Spectrum Chemical Manufacturing Corp
- Umicore Electroplating
- Innova Corporate
- Alfa Aesar Thermo Fisher Scientific
- Mahavir Expochem Ltd
- METALOR Technologies SA
Notable Milestones in Gold Potassium Cyanide Industry Sector
- November 2022: Besra Gold Inc. secured USD 300 million in financial support from Quantum Metals Recovery Inc., boosting gold exploration and development.
- March 2022: Spectrum Chemical launched 12 new bioCERTIFIED products, expanding its portfolio for biopharmaceutical manufacturing.
In-Depth Gold Potassium Cyanide Industry Market Outlook
The Gold Potassium Cyanide market is poised for continued robust growth in the coming years, driven by consistent demand from key industries and ongoing technological advancements. Strategic investments in research and development, coupled with strategic partnerships and collaborations, will be crucial for unlocking new market opportunities and enhancing industry competitiveness. The growing emphasis on sustainability and environmental responsibility will significantly shape future market dynamics, stimulating demand for greener and more efficient production processes. This necessitates a focus on [Mention specific strategies, e.g., developing biodegradable alternatives, implementing closed-loop systems]. [Include a concluding statement summarizing the overall outlook with a positive and forward-looking tone].
Gold Potassium Cyanide Industry Segmentation
-
1. Type
- 1.1. Low Purity
- 1.2. High Purity
-
2. Applications
- 2.1. Electroplating of Metals
- 2.2. Decorative Costume Jewellery
- 2.3. Electronic Devices
- 2.4. Watches
- 2.5. Other Applications
Gold Potassium Cyanide Industry Segmentation By Geography
-
1. Asia Pacific
- 1.1. China
- 1.2. India
- 1.3. Japan
- 1.4. South Korea
- 1.5. Rest of Asia Pacific
-
2. North America
- 2.1. United States
- 2.2. Canada
- 2.3. Mexico
-
3. Europe
- 3.1. Germany
- 3.2. United Kingdom
- 3.3. France
- 3.4. Italy
- 3.5. Rest of Europe
-
4. South America
- 4.1. Brazil
- 4.2. Argentina
- 4.3. Rest of South America
-
5. Middle East and Africa
- 5.1. Saudi Arabia
- 5.2. South Africa
- 5.3. Rest of Middle East and Africa
Gold Potassium Cyanide Industry REPORT HIGHLIGHTS
| Aspects | Details |
|---|---|
| Study Period | 2019-2033 |
| Base Year | 2024 |
| Estimated Year | 2025 |
| Forecast Period | 2025-2033 |
| Historical Period | 2019-2024 |
| Growth Rate | CAGR of 2.97% from 2019-2033 |
| Segmentation |
|
Table of Contents
- 1. Introduction
- 1.1. Research Scope
- 1.2. Market Segmentation
- 1.3. Research Methodology
- 1.4. Definitions and Assumptions
- 2. Executive Summary
- 2.1. Introduction
- 3. Market Dynamics
- 3.1. Introduction
- 3.2. Market Drivers
- 3.2.1. Increasing Applications for Electroplating of Gold; Growing Demand from the Electronics Industry
- 3.3. Market Restrains
- 3.3.1. High Toxic Nature and Impact of COVID-19 Pandemic; Other Restraints
- 3.4. Market Trends
- 3.4.1. Growing Demand from Electronics and Metal Plating Industries
- 4. Market Factor Analysis
- 4.1. Porters Five Forces
- 4.2. Supply/Value Chain
- 4.3. PESTEL analysis
- 4.4. Market Entropy
- 4.5. Patent/Trademark Analysis
- 5. Global Gold Potassium Cyanide Industry Analysis, Insights and Forecast, 2019-2031
- 5.1. Market Analysis, Insights and Forecast - by Type
- 5.1.1. Low Purity
- 5.1.2. High Purity
- 5.2. Market Analysis, Insights and Forecast - by Applications
- 5.2.1. Electroplating of Metals
- 5.2.2. Decorative Costume Jewellery
- 5.2.3. Electronic Devices
- 5.2.4. Watches
- 5.2.5. Other Applications
- 5.3. Market Analysis, Insights and Forecast - by Region
- 5.3.1. Asia Pacific
- 5.3.2. North America
- 5.3.3. Europe
- 5.3.4. South America
- 5.3.5. Middle East and Africa
- 5.1. Market Analysis, Insights and Forecast - by Type
- 6. Asia Pacific Gold Potassium Cyanide Industry Analysis, Insights and Forecast, 2019-2031
- 6.1. Market Analysis, Insights and Forecast - by Type
- 6.1.1. Low Purity
- 6.1.2. High Purity
- 6.2. Market Analysis, Insights and Forecast - by Applications
- 6.2.1. Electroplating of Metals
- 6.2.2. Decorative Costume Jewellery
- 6.2.3. Electronic Devices
- 6.2.4. Watches
- 6.2.5. Other Applications
- 6.1. Market Analysis, Insights and Forecast - by Type
- 7. North America Gold Potassium Cyanide Industry Analysis, Insights and Forecast, 2019-2031
- 7.1. Market Analysis, Insights and Forecast - by Type
- 7.1.1. Low Purity
- 7.1.2. High Purity
- 7.2. Market Analysis, Insights and Forecast - by Applications
- 7.2.1. Electroplating of Metals
- 7.2.2. Decorative Costume Jewellery
- 7.2.3. Electronic Devices
- 7.2.4. Watches
- 7.2.5. Other Applications
- 7.1. Market Analysis, Insights and Forecast - by Type
- 8. Europe Gold Potassium Cyanide Industry Analysis, Insights and Forecast, 2019-2031
- 8.1. Market Analysis, Insights and Forecast - by Type
- 8.1.1. Low Purity
- 8.1.2. High Purity
- 8.2. Market Analysis, Insights and Forecast - by Applications
- 8.2.1. Electroplating of Metals
- 8.2.2. Decorative Costume Jewellery
- 8.2.3. Electronic Devices
- 8.2.4. Watches
- 8.2.5. Other Applications
- 8.1. Market Analysis, Insights and Forecast - by Type
- 9. South America Gold Potassium Cyanide Industry Analysis, Insights and Forecast, 2019-2031
- 9.1. Market Analysis, Insights and Forecast - by Type
- 9.1.1. Low Purity
- 9.1.2. High Purity
- 9.2. Market Analysis, Insights and Forecast - by Applications
- 9.2.1. Electroplating of Metals
- 9.2.2. Decorative Costume Jewellery
- 9.2.3. Electronic Devices
- 9.2.4. Watches
- 9.2.5. Other Applications
- 9.1. Market Analysis, Insights and Forecast - by Type
- 10. Middle East and Africa Gold Potassium Cyanide Industry Analysis, Insights and Forecast, 2019-2031
- 10.1. Market Analysis, Insights and Forecast - by Type
- 10.1.1. Low Purity
- 10.1.2. High Purity
- 10.2. Market Analysis, Insights and Forecast - by Applications
- 10.2.1. Electroplating of Metals
- 10.2.2. Decorative Costume Jewellery
- 10.2.3. Electronic Devices
- 10.2.4. Watches
- 10.2.5. Other Applications
- 10.1. Market Analysis, Insights and Forecast - by Type
- 11. North America Gold Potassium Cyanide Industry Analysis, Insights and Forecast, 2019-2031
- 11.1. Market Analysis, Insights and Forecast - By Country/Sub-region
- 11.1.1 United States
- 11.1.2 Canada
- 11.1.3 Mexico
- 12. Europe Gold Potassium Cyanide Industry Analysis, Insights and Forecast, 2019-2031
- 12.1. Market Analysis, Insights and Forecast - By Country/Sub-region
- 12.1.1 Germany
- 12.1.2 France
- 12.1.3 Italy
- 12.1.4 United Kingdom
- 12.1.5 Netherlands
- 12.1.6 Rest of Europe
- 13. Asia Pacific Gold Potassium Cyanide Industry Analysis, Insights and Forecast, 2019-2031
- 13.1. Market Analysis, Insights and Forecast - By Country/Sub-region
- 13.1.1 China
- 13.1.2 Japan
- 13.1.3 India
- 13.1.4 South Korea
- 13.1.5 Taiwan
- 13.1.6 Australia
- 13.1.7 Rest of Asia-Pacific
- 14. South America Gold Potassium Cyanide Industry Analysis, Insights and Forecast, 2019-2031
- 14.1. Market Analysis, Insights and Forecast - By Country/Sub-region
- 14.1.1 Brazil
- 14.1.2 Argentina
- 14.1.3 Rest of South America
- 15. MEA Gold Potassium Cyanide Industry Analysis, Insights and Forecast, 2019-2031
- 15.1. Market Analysis, Insights and Forecast - By Country/Sub-region
- 15.1.1 Middle East
- 15.1.2 Africa
- 16. Competitive Analysis
- 16.1. Global Market Share Analysis 2024
- 16.2. Company Profiles
- 16.2.1 LEGOR GROUP S p A
- 16.2.1.1. Overview
- 16.2.1.2. Products
- 16.2.1.3. SWOT Analysis
- 16.2.1.4. Recent Developments
- 16.2.1.5. Financials (Based on Availability)
- 16.2.2 Parekh Industries Ltd
- 16.2.2.1. Overview
- 16.2.2.2. Products
- 16.2.2.3. SWOT Analysis
- 16.2.2.4. Recent Developments
- 16.2.2.5. Financials (Based on Availability)
- 16.2.3 Bangalore Refinery
- 16.2.3.1. Overview
- 16.2.3.2. Products
- 16.2.3.3. SWOT Analysis
- 16.2.3.4. Recent Developments
- 16.2.3.5. Financials (Based on Availability)
- 16.2.4 Prominex Precious Mineral Resources
- 16.2.4.1. Overview
- 16.2.4.2. Products
- 16.2.4.3. SWOT Analysis
- 16.2.4.4. Recent Developments
- 16.2.4.5. Financials (Based on Availability)
- 16.2.5 Spectrum Chemical Manufacturing Corp
- 16.2.5.1. Overview
- 16.2.5.2. Products
- 16.2.5.3. SWOT Analysis
- 16.2.5.4. Recent Developments
- 16.2.5.5. Financials (Based on Availability)
- 16.2.6 Umicore Electroplating
- 16.2.6.1. Overview
- 16.2.6.2. Products
- 16.2.6.3. SWOT Analysis
- 16.2.6.4. Recent Developments
- 16.2.6.5. Financials (Based on Availability)
- 16.2.7 Innova Corporate
- 16.2.7.1. Overview
- 16.2.7.2. Products
- 16.2.7.3. SWOT Analysis
- 16.2.7.4. Recent Developments
- 16.2.7.5. Financials (Based on Availability)
- 16.2.8 Alfa Aesar Thermo Fisher Scientific
- 16.2.8.1. Overview
- 16.2.8.2. Products
- 16.2.8.3. SWOT Analysis
- 16.2.8.4. Recent Developments
- 16.2.8.5. Financials (Based on Availability)
- 16.2.9 Mahavir Expochem Ltd
- 16.2.9.1. Overview
- 16.2.9.2. Products
- 16.2.9.3. SWOT Analysis
- 16.2.9.4. Recent Developments
- 16.2.9.5. Financials (Based on Availability)
- 16.2.10 METALOR Technologies SA
- 16.2.10.1. Overview
- 16.2.10.2. Products
- 16.2.10.3. SWOT Analysis
- 16.2.10.4. Recent Developments
- 16.2.10.5. Financials (Based on Availability)
- 16.2.1 LEGOR GROUP S p A
List of Figures
- Figure 1: Global Gold Potassium Cyanide Industry Revenue Breakdown (Million, %) by Region 2024 & 2032
- Figure 2: Global Gold Potassium Cyanide Industry Volume Breakdown (K Tons, %) by Region 2024 & 2032
- Figure 3: North America Gold Potassium Cyanide Industry Revenue (Million), by Country 2024 & 2032
- Figure 4: North America Gold Potassium Cyanide Industry Volume (K Tons), by Country 2024 & 2032
- Figure 5: North America Gold Potassium Cyanide Industry Revenue Share (%), by Country 2024 & 2032
- Figure 6: North America Gold Potassium Cyanide Industry Volume Share (%), by Country 2024 & 2032
- Figure 7: Europe Gold Potassium Cyanide Industry Revenue (Million), by Country 2024 & 2032
- Figure 8: Europe Gold Potassium Cyanide Industry Volume (K Tons), by Country 2024 & 2032
- Figure 9: Europe Gold Potassium Cyanide Industry Revenue Share (%), by Country 2024 & 2032
- Figure 10: Europe Gold Potassium Cyanide Industry Volume Share (%), by Country 2024 & 2032
- Figure 11: Asia Pacific Gold Potassium Cyanide Industry Revenue (Million), by Country 2024 & 2032
- Figure 12: Asia Pacific Gold Potassium Cyanide Industry Volume (K Tons), by Country 2024 & 2032
- Figure 13: Asia Pacific Gold Potassium Cyanide Industry Revenue Share (%), by Country 2024 & 2032
- Figure 14: Asia Pacific Gold Potassium Cyanide Industry Volume Share (%), by Country 2024 & 2032
- Figure 15: South America Gold Potassium Cyanide Industry Revenue (Million), by Country 2024 & 2032
- Figure 16: South America Gold Potassium Cyanide Industry Volume (K Tons), by Country 2024 & 2032
- Figure 17: South America Gold Potassium Cyanide Industry Revenue Share (%), by Country 2024 & 2032
- Figure 18: South America Gold Potassium Cyanide Industry Volume Share (%), by Country 2024 & 2032
- Figure 19: MEA Gold Potassium Cyanide Industry Revenue (Million), by Country 2024 & 2032
- Figure 20: MEA Gold Potassium Cyanide Industry Volume (K Tons), by Country 2024 & 2032
- Figure 21: MEA Gold Potassium Cyanide Industry Revenue Share (%), by Country 2024 & 2032
- Figure 22: MEA Gold Potassium Cyanide Industry Volume Share (%), by Country 2024 & 2032
- Figure 23: Asia Pacific Gold Potassium Cyanide Industry Revenue (Million), by Type 2024 & 2032
- Figure 24: Asia Pacific Gold Potassium Cyanide Industry Volume (K Tons), by Type 2024 & 2032
- Figure 25: Asia Pacific Gold Potassium Cyanide Industry Revenue Share (%), by Type 2024 & 2032
- Figure 26: Asia Pacific Gold Potassium Cyanide Industry Volume Share (%), by Type 2024 & 2032
- Figure 27: Asia Pacific Gold Potassium Cyanide Industry Revenue (Million), by Applications 2024 & 2032
- Figure 28: Asia Pacific Gold Potassium Cyanide Industry Volume (K Tons), by Applications 2024 & 2032
- Figure 29: Asia Pacific Gold Potassium Cyanide Industry Revenue Share (%), by Applications 2024 & 2032
- Figure 30: Asia Pacific Gold Potassium Cyanide Industry Volume Share (%), by Applications 2024 & 2032
- Figure 31: Asia Pacific Gold Potassium Cyanide Industry Revenue (Million), by Country 2024 & 2032
- Figure 32: Asia Pacific Gold Potassium Cyanide Industry Volume (K Tons), by Country 2024 & 2032
- Figure 33: Asia Pacific Gold Potassium Cyanide Industry Revenue Share (%), by Country 2024 & 2032
- Figure 34: Asia Pacific Gold Potassium Cyanide Industry Volume Share (%), by Country 2024 & 2032
- Figure 35: North America Gold Potassium Cyanide Industry Revenue (Million), by Type 2024 & 2032
- Figure 36: North America Gold Potassium Cyanide Industry Volume (K Tons), by Type 2024 & 2032
- Figure 37: North America Gold Potassium Cyanide Industry Revenue Share (%), by Type 2024 & 2032
- Figure 38: North America Gold Potassium Cyanide Industry Volume Share (%), by Type 2024 & 2032
- Figure 39: North America Gold Potassium Cyanide Industry Revenue (Million), by Applications 2024 & 2032
- Figure 40: North America Gold Potassium Cyanide Industry Volume (K Tons), by Applications 2024 & 2032
- Figure 41: North America Gold Potassium Cyanide Industry Revenue Share (%), by Applications 2024 & 2032
- Figure 42: North America Gold Potassium Cyanide Industry Volume Share (%), by Applications 2024 & 2032
- Figure 43: North America Gold Potassium Cyanide Industry Revenue (Million), by Country 2024 & 2032
- Figure 44: North America Gold Potassium Cyanide Industry Volume (K Tons), by Country 2024 & 2032
- Figure 45: North America Gold Potassium Cyanide Industry Revenue Share (%), by Country 2024 & 2032
- Figure 46: North America Gold Potassium Cyanide Industry Volume Share (%), by Country 2024 & 2032
- Figure 47: Europe Gold Potassium Cyanide Industry Revenue (Million), by Type 2024 & 2032
- Figure 48: Europe Gold Potassium Cyanide Industry Volume (K Tons), by Type 2024 & 2032
- Figure 49: Europe Gold Potassium Cyanide Industry Revenue Share (%), by Type 2024 & 2032
- Figure 50: Europe Gold Potassium Cyanide Industry Volume Share (%), by Type 2024 & 2032
- Figure 51: Europe Gold Potassium Cyanide Industry Revenue (Million), by Applications 2024 & 2032
- Figure 52: Europe Gold Potassium Cyanide Industry Volume (K Tons), by Applications 2024 & 2032
- Figure 53: Europe Gold Potassium Cyanide Industry Revenue Share (%), by Applications 2024 & 2032
- Figure 54: Europe Gold Potassium Cyanide Industry Volume Share (%), by Applications 2024 & 2032
- Figure 55: Europe Gold Potassium Cyanide Industry Revenue (Million), by Country 2024 & 2032
- Figure 56: Europe Gold Potassium Cyanide Industry Volume (K Tons), by Country 2024 & 2032
- Figure 57: Europe Gold Potassium Cyanide Industry Revenue Share (%), by Country 2024 & 2032
- Figure 58: Europe Gold Potassium Cyanide Industry Volume Share (%), by Country 2024 & 2032
- Figure 59: South America Gold Potassium Cyanide Industry Revenue (Million), by Type 2024 & 2032
- Figure 60: South America Gold Potassium Cyanide Industry Volume (K Tons), by Type 2024 & 2032
- Figure 61: South America Gold Potassium Cyanide Industry Revenue Share (%), by Type 2024 & 2032
- Figure 62: South America Gold Potassium Cyanide Industry Volume Share (%), by Type 2024 & 2032
- Figure 63: South America Gold Potassium Cyanide Industry Revenue (Million), by Applications 2024 & 2032
- Figure 64: South America Gold Potassium Cyanide Industry Volume (K Tons), by Applications 2024 & 2032
- Figure 65: South America Gold Potassium Cyanide Industry Revenue Share (%), by Applications 2024 & 2032
- Figure 66: South America Gold Potassium Cyanide Industry Volume Share (%), by Applications 2024 & 2032
- Figure 67: South America Gold Potassium Cyanide Industry Revenue (Million), by Country 2024 & 2032
- Figure 68: South America Gold Potassium Cyanide Industry Volume (K Tons), by Country 2024 & 2032
- Figure 69: South America Gold Potassium Cyanide Industry Revenue Share (%), by Country 2024 & 2032
- Figure 70: South America Gold Potassium Cyanide Industry Volume Share (%), by Country 2024 & 2032
- Figure 71: Middle East and Africa Gold Potassium Cyanide Industry Revenue (Million), by Type 2024 & 2032
- Figure 72: Middle East and Africa Gold Potassium Cyanide Industry Volume (K Tons), by Type 2024 & 2032
- Figure 73: Middle East and Africa Gold Potassium Cyanide Industry Revenue Share (%), by Type 2024 & 2032
- Figure 74: Middle East and Africa Gold Potassium Cyanide Industry Volume Share (%), by Type 2024 & 2032
- Figure 75: Middle East and Africa Gold Potassium Cyanide Industry Revenue (Million), by Applications 2024 & 2032
- Figure 76: Middle East and Africa Gold Potassium Cyanide Industry Volume (K Tons), by Applications 2024 & 2032
- Figure 77: Middle East and Africa Gold Potassium Cyanide Industry Revenue Share (%), by Applications 2024 & 2032
- Figure 78: Middle East and Africa Gold Potassium Cyanide Industry Volume Share (%), by Applications 2024 & 2032
- Figure 79: Middle East and Africa Gold Potassium Cyanide Industry Revenue (Million), by Country 2024 & 2032
- Figure 80: Middle East and Africa Gold Potassium Cyanide Industry Volume (K Tons), by Country 2024 & 2032
- Figure 81: Middle East and Africa Gold Potassium Cyanide Industry Revenue Share (%), by Country 2024 & 2032
- Figure 82: Middle East and Africa Gold Potassium Cyanide Industry Volume Share (%), by Country 2024 & 2032
List of Tables
- Table 1: Global Gold Potassium Cyanide Industry Revenue Million Forecast, by Region 2019 & 2032
- Table 2: Global Gold Potassium Cyanide Industry Volume K Tons Forecast, by Region 2019 & 2032
- Table 3: Global Gold Potassium Cyanide Industry Revenue Million Forecast, by Type 2019 & 2032
- Table 4: Global Gold Potassium Cyanide Industry Volume K Tons Forecast, by Type 2019 & 2032
- Table 5: Global Gold Potassium Cyanide Industry Revenue Million Forecast, by Applications 2019 & 2032
- Table 6: Global Gold Potassium Cyanide Industry Volume K Tons Forecast, by Applications 2019 & 2032
- Table 7: Global Gold Potassium Cyanide Industry Revenue Million Forecast, by Region 2019 & 2032
- Table 8: Global Gold Potassium Cyanide Industry Volume K Tons Forecast, by Region 2019 & 2032
- Table 9: Global Gold Potassium Cyanide Industry Revenue Million Forecast, by Country 2019 & 2032
- Table 10: Global Gold Potassium Cyanide Industry Volume K Tons Forecast, by Country 2019 & 2032
- Table 11: United States Gold Potassium Cyanide Industry Revenue (Million) Forecast, by Application 2019 & 2032
- Table 12: United States Gold Potassium Cyanide Industry Volume (K Tons) Forecast, by Application 2019 & 2032
- Table 13: Canada Gold Potassium Cyanide Industry Revenue (Million) Forecast, by Application 2019 & 2032
- Table 14: Canada Gold Potassium Cyanide Industry Volume (K Tons) Forecast, by Application 2019 & 2032
- Table 15: Mexico Gold Potassium Cyanide Industry Revenue (Million) Forecast, by Application 2019 & 2032
- Table 16: Mexico Gold Potassium Cyanide Industry Volume (K Tons) Forecast, by Application 2019 & 2032
- Table 17: Global Gold Potassium Cyanide Industry Revenue Million Forecast, by Country 2019 & 2032
- Table 18: Global Gold Potassium Cyanide Industry Volume K Tons Forecast, by Country 2019 & 2032
- Table 19: Germany Gold Potassium Cyanide Industry Revenue (Million) Forecast, by Application 2019 & 2032
- Table 20: Germany Gold Potassium Cyanide Industry Volume (K Tons) Forecast, by Application 2019 & 2032
- Table 21: France Gold Potassium Cyanide Industry Revenue (Million) Forecast, by Application 2019 & 2032
- Table 22: France Gold Potassium Cyanide Industry Volume (K Tons) Forecast, by Application 2019 & 2032
- Table 23: Italy Gold Potassium Cyanide Industry Revenue (Million) Forecast, by Application 2019 & 2032
- Table 24: Italy Gold Potassium Cyanide Industry Volume (K Tons) Forecast, by Application 2019 & 2032
- Table 25: United Kingdom Gold Potassium Cyanide Industry Revenue (Million) Forecast, by Application 2019 & 2032
- Table 26: United Kingdom Gold Potassium Cyanide Industry Volume (K Tons) Forecast, by Application 2019 & 2032
- Table 27: Netherlands Gold Potassium Cyanide Industry Revenue (Million) Forecast, by Application 2019 & 2032
- Table 28: Netherlands Gold Potassium Cyanide Industry Volume (K Tons) Forecast, by Application 2019 & 2032
- Table 29: Rest of Europe Gold Potassium Cyanide Industry Revenue (Million) Forecast, by Application 2019 & 2032
- Table 30: Rest of Europe Gold Potassium Cyanide Industry Volume (K Tons) Forecast, by Application 2019 & 2032
- Table 31: Global Gold Potassium Cyanide Industry Revenue Million Forecast, by Country 2019 & 2032
- Table 32: Global Gold Potassium Cyanide Industry Volume K Tons Forecast, by Country 2019 & 2032
- Table 33: China Gold Potassium Cyanide Industry Revenue (Million) Forecast, by Application 2019 & 2032
- Table 34: China Gold Potassium Cyanide Industry Volume (K Tons) Forecast, by Application 2019 & 2032
- Table 35: Japan Gold Potassium Cyanide Industry Revenue (Million) Forecast, by Application 2019 & 2032
- Table 36: Japan Gold Potassium Cyanide Industry Volume (K Tons) Forecast, by Application 2019 & 2032
- Table 37: India Gold Potassium Cyanide Industry Revenue (Million) Forecast, by Application 2019 & 2032
- Table 38: India Gold Potassium Cyanide Industry Volume (K Tons) Forecast, by Application 2019 & 2032
- Table 39: South Korea Gold Potassium Cyanide Industry Revenue (Million) Forecast, by Application 2019 & 2032
- Table 40: South Korea Gold Potassium Cyanide Industry Volume (K Tons) Forecast, by Application 2019 & 2032
- Table 41: Taiwan Gold Potassium Cyanide Industry Revenue (Million) Forecast, by Application 2019 & 2032
- Table 42: Taiwan Gold Potassium Cyanide Industry Volume (K Tons) Forecast, by Application 2019 & 2032
- Table 43: Australia Gold Potassium Cyanide Industry Revenue (Million) Forecast, by Application 2019 & 2032
- Table 44: Australia Gold Potassium Cyanide Industry Volume (K Tons) Forecast, by Application 2019 & 2032
- Table 45: Rest of Asia-Pacific Gold Potassium Cyanide Industry Revenue (Million) Forecast, by Application 2019 & 2032
- Table 46: Rest of Asia-Pacific Gold Potassium Cyanide Industry Volume (K Tons) Forecast, by Application 2019 & 2032
- Table 47: Global Gold Potassium Cyanide Industry Revenue Million Forecast, by Country 2019 & 2032
- Table 48: Global Gold Potassium Cyanide Industry Volume K Tons Forecast, by Country 2019 & 2032
- Table 49: Brazil Gold Potassium Cyanide Industry Revenue (Million) Forecast, by Application 2019 & 2032
- Table 50: Brazil Gold Potassium Cyanide Industry Volume (K Tons) Forecast, by Application 2019 & 2032
- Table 51: Argentina Gold Potassium Cyanide Industry Revenue (Million) Forecast, by Application 2019 & 2032
- Table 52: Argentina Gold Potassium Cyanide Industry Volume (K Tons) Forecast, by Application 2019 & 2032
- Table 53: Rest of South America Gold Potassium Cyanide Industry Revenue (Million) Forecast, by Application 2019 & 2032
- Table 54: Rest of South America Gold Potassium Cyanide Industry Volume (K Tons) Forecast, by Application 2019 & 2032
- Table 55: Global Gold Potassium Cyanide Industry Revenue Million Forecast, by Country 2019 & 2032
- Table 56: Global Gold Potassium Cyanide Industry Volume K Tons Forecast, by Country 2019 & 2032
- Table 57: Middle East Gold Potassium Cyanide Industry Revenue (Million) Forecast, by Application 2019 & 2032
- Table 58: Middle East Gold Potassium Cyanide Industry Volume (K Tons) Forecast, by Application 2019 & 2032
- Table 59: Africa Gold Potassium Cyanide Industry Revenue (Million) Forecast, by Application 2019 & 2032
- Table 60: Africa Gold Potassium Cyanide Industry Volume (K Tons) Forecast, by Application 2019 & 2032
- Table 61: Global Gold Potassium Cyanide Industry Revenue Million Forecast, by Type 2019 & 2032
- Table 62: Global Gold Potassium Cyanide Industry Volume K Tons Forecast, by Type 2019 & 2032
- Table 63: Global Gold Potassium Cyanide Industry Revenue Million Forecast, by Applications 2019 & 2032
- Table 64: Global Gold Potassium Cyanide Industry Volume K Tons Forecast, by Applications 2019 & 2032
- Table 65: Global Gold Potassium Cyanide Industry Revenue Million Forecast, by Country 2019 & 2032
- Table 66: Global Gold Potassium Cyanide Industry Volume K Tons Forecast, by Country 2019 & 2032
- Table 67: China Gold Potassium Cyanide Industry Revenue (Million) Forecast, by Application 2019 & 2032
- Table 68: China Gold Potassium Cyanide Industry Volume (K Tons) Forecast, by Application 2019 & 2032
- Table 69: India Gold Potassium Cyanide Industry Revenue (Million) Forecast, by Application 2019 & 2032
- Table 70: India Gold Potassium Cyanide Industry Volume (K Tons) Forecast, by Application 2019 & 2032
- Table 71: Japan Gold Potassium Cyanide Industry Revenue (Million) Forecast, by Application 2019 & 2032
- Table 72: Japan Gold Potassium Cyanide Industry Volume (K Tons) Forecast, by Application 2019 & 2032
- Table 73: South Korea Gold Potassium Cyanide Industry Revenue (Million) Forecast, by Application 2019 & 2032
- Table 74: South Korea Gold Potassium Cyanide Industry Volume (K Tons) Forecast, by Application 2019 & 2032
- Table 75: Rest of Asia Pacific Gold Potassium Cyanide Industry Revenue (Million) Forecast, by Application 2019 & 2032
- Table 76: Rest of Asia Pacific Gold Potassium Cyanide Industry Volume (K Tons) Forecast, by Application 2019 & 2032
- Table 77: Global Gold Potassium Cyanide Industry Revenue Million Forecast, by Type 2019 & 2032
- Table 78: Global Gold Potassium Cyanide Industry Volume K Tons Forecast, by Type 2019 & 2032
- Table 79: Global Gold Potassium Cyanide Industry Revenue Million Forecast, by Applications 2019 & 2032
- Table 80: Global Gold Potassium Cyanide Industry Volume K Tons Forecast, by Applications 2019 & 2032
- Table 81: Global Gold Potassium Cyanide Industry Revenue Million Forecast, by Country 2019 & 2032
- Table 82: Global Gold Potassium Cyanide Industry Volume K Tons Forecast, by Country 2019 & 2032
- Table 83: United States Gold Potassium Cyanide Industry Revenue (Million) Forecast, by Application 2019 & 2032
- Table 84: United States Gold Potassium Cyanide Industry Volume (K Tons) Forecast, by Application 2019 & 2032
- Table 85: Canada Gold Potassium Cyanide Industry Revenue (Million) Forecast, by Application 2019 & 2032
- Table 86: Canada Gold Potassium Cyanide Industry Volume (K Tons) Forecast, by Application 2019 & 2032
- Table 87: Mexico Gold Potassium Cyanide Industry Revenue (Million) Forecast, by Application 2019 & 2032
- Table 88: Mexico Gold Potassium Cyanide Industry Volume (K Tons) Forecast, by Application 2019 & 2032
- Table 89: Global Gold Potassium Cyanide Industry Revenue Million Forecast, by Type 2019 & 2032
- Table 90: Global Gold Potassium Cyanide Industry Volume K Tons Forecast, by Type 2019 & 2032
- Table 91: Global Gold Potassium Cyanide Industry Revenue Million Forecast, by Applications 2019 & 2032
- Table 92: Global Gold Potassium Cyanide Industry Volume K Tons Forecast, by Applications 2019 & 2032
- Table 93: Global Gold Potassium Cyanide Industry Revenue Million Forecast, by Country 2019 & 2032
- Table 94: Global Gold Potassium Cyanide Industry Volume K Tons Forecast, by Country 2019 & 2032
- Table 95: Germany Gold Potassium Cyanide Industry Revenue (Million) Forecast, by Application 2019 & 2032
- Table 96: Germany Gold Potassium Cyanide Industry Volume (K Tons) Forecast, by Application 2019 & 2032
- Table 97: United Kingdom Gold Potassium Cyanide Industry Revenue (Million) Forecast, by Application 2019 & 2032
- Table 98: United Kingdom Gold Potassium Cyanide Industry Volume (K Tons) Forecast, by Application 2019 & 2032
- Table 99: France Gold Potassium Cyanide Industry Revenue (Million) Forecast, by Application 2019 & 2032
- Table 100: France Gold Potassium Cyanide Industry Volume (K Tons) Forecast, by Application 2019 & 2032
- Table 101: Italy Gold Potassium Cyanide Industry Revenue (Million) Forecast, by Application 2019 & 2032
- Table 102: Italy Gold Potassium Cyanide Industry Volume (K Tons) Forecast, by Application 2019 & 2032
- Table 103: Rest of Europe Gold Potassium Cyanide Industry Revenue (Million) Forecast, by Application 2019 & 2032
- Table 104: Rest of Europe Gold Potassium Cyanide Industry Volume (K Tons) Forecast, by Application 2019 & 2032
- Table 105: Global Gold Potassium Cyanide Industry Revenue Million Forecast, by Type 2019 & 2032
- Table 106: Global Gold Potassium Cyanide Industry Volume K Tons Forecast, by Type 2019 & 2032
- Table 107: Global Gold Potassium Cyanide Industry Revenue Million Forecast, by Applications 2019 & 2032
- Table 108: Global Gold Potassium Cyanide Industry Volume K Tons Forecast, by Applications 2019 & 2032
- Table 109: Global Gold Potassium Cyanide Industry Revenue Million Forecast, by Country 2019 & 2032
- Table 110: Global Gold Potassium Cyanide Industry Volume K Tons Forecast, by Country 2019 & 2032
- Table 111: Brazil Gold Potassium Cyanide Industry Revenue (Million) Forecast, by Application 2019 & 2032
- Table 112: Brazil Gold Potassium Cyanide Industry Volume (K Tons) Forecast, by Application 2019 & 2032
- Table 113: Argentina Gold Potassium Cyanide Industry Revenue (Million) Forecast, by Application 2019 & 2032
- Table 114: Argentina Gold Potassium Cyanide Industry Volume (K Tons) Forecast, by Application 2019 & 2032
- Table 115: Rest of South America Gold Potassium Cyanide Industry Revenue (Million) Forecast, by Application 2019 & 2032
- Table 116: Rest of South America Gold Potassium Cyanide Industry Volume (K Tons) Forecast, by Application 2019 & 2032
- Table 117: Global Gold Potassium Cyanide Industry Revenue Million Forecast, by Type 2019 & 2032
- Table 118: Global Gold Potassium Cyanide Industry Volume K Tons Forecast, by Type 2019 & 2032
- Table 119: Global Gold Potassium Cyanide Industry Revenue Million Forecast, by Applications 2019 & 2032
- Table 120: Global Gold Potassium Cyanide Industry Volume K Tons Forecast, by Applications 2019 & 2032
- Table 121: Global Gold Potassium Cyanide Industry Revenue Million Forecast, by Country 2019 & 2032
- Table 122: Global Gold Potassium Cyanide Industry Volume K Tons Forecast, by Country 2019 & 2032
- Table 123: Saudi Arabia Gold Potassium Cyanide Industry Revenue (Million) Forecast, by Application 2019 & 2032
- Table 124: Saudi Arabia Gold Potassium Cyanide Industry Volume (K Tons) Forecast, by Application 2019 & 2032
- Table 125: South Africa Gold Potassium Cyanide Industry Revenue (Million) Forecast, by Application 2019 & 2032
- Table 126: South Africa Gold Potassium Cyanide Industry Volume (K Tons) Forecast, by Application 2019 & 2032
- Table 127: Rest of Middle East and Africa Gold Potassium Cyanide Industry Revenue (Million) Forecast, by Application 2019 & 2032
- Table 128: Rest of Middle East and Africa Gold Potassium Cyanide Industry Volume (K Tons) Forecast, by Application 2019 & 2032
Frequently Asked Questions
1. What is the projected Compound Annual Growth Rate (CAGR) of the Gold Potassium Cyanide Industry?
The projected CAGR is approximately 2.97%.
2. Which companies are prominent players in the Gold Potassium Cyanide Industry?
Key companies in the market include LEGOR GROUP S p A, Parekh Industries Ltd, Bangalore Refinery, Prominex Precious Mineral Resources, Spectrum Chemical Manufacturing Corp, Umicore Electroplating, Innova Corporate, Alfa Aesar Thermo Fisher Scientific, Mahavir Expochem Ltd, METALOR Technologies SA.
3. What are the main segments of the Gold Potassium Cyanide Industry?
The market segments include Type, Applications.
4. Can you provide details about the market size?
The market size is estimated to be USD 1052.6 Million as of 2022.
5. What are some drivers contributing to market growth?
Increasing Applications for Electroplating of Gold; Growing Demand from the Electronics Industry.
6. What are the notable trends driving market growth?
Growing Demand from Electronics and Metal Plating Industries.
7. Are there any restraints impacting market growth?
High Toxic Nature and Impact of COVID-19 Pandemic; Other Restraints.
8. Can you provide examples of recent developments in the market?
November 2022: Besra Gold Inc announced its agreement with Quantum Metals Recovery Inc which will come into effect from January 2023. As per the agreement, Quantum Metals Recovery Inc will provide an amount of USD 300 million in financial support through the gold offtake purchase facility. The agreement consent between both companies would enable advancement in exploration and development planning for gold.
9. What pricing options are available for accessing the report?
Pricing options include single-user, multi-user, and enterprise licenses priced at USD 4750, USD 5250, and USD 8750 respectively.
10. Is the market size provided in terms of value or volume?
The market size is provided in terms of value, measured in Million and volume, measured in K Tons.
11. Are there any specific market keywords associated with the report?
Yes, the market keyword associated with the report is "Gold Potassium Cyanide Industry," which aids in identifying and referencing the specific market segment covered.
12. How do I determine which pricing option suits my needs best?
The pricing options vary based on user requirements and access needs. Individual users may opt for single-user licenses, while businesses requiring broader access may choose multi-user or enterprise licenses for cost-effective access to the report.
13. Are there any additional resources or data provided in the Gold Potassium Cyanide Industry report?
While the report offers comprehensive insights, it's advisable to review the specific contents or supplementary materials provided to ascertain if additional resources or data are available.
14. How can I stay updated on further developments or reports in the Gold Potassium Cyanide Industry?
To stay informed about further developments, trends, and reports in the Gold Potassium Cyanide Industry, consider subscribing to industry newsletters, following relevant companies and organizations, or regularly checking reputable industry news sources and publications.
Methodology
Step 1 - Identification of Relevant Samples Size from Population Database


Step 2 - Approaches for Defining Global Market Size (Value, Volume* & Price*)

Note*: In applicable scenarios
Step 3 - Data Sources
Primary Research
- Web Analytics
- Survey Reports
- Research Institute
- Latest Research Reports
- Opinion Leaders
Secondary Research
- Annual Reports
- White Paper
- Latest Press Release
- Industry Association
- Paid Database
- Investor Presentations

Step 4 - Data Triangulation
Involves using different sources of information in order to increase the validity of a study
These sources are likely to be stakeholders in a program - participants, other researchers, program staff, other community members, and so on.
Then we put all data in single framework & apply various statistical tools to find out the dynamic on the market.
During the analysis stage, feedback from the stakeholder groups would be compared to determine areas of agreement as well as areas of divergence
