

Key Insights
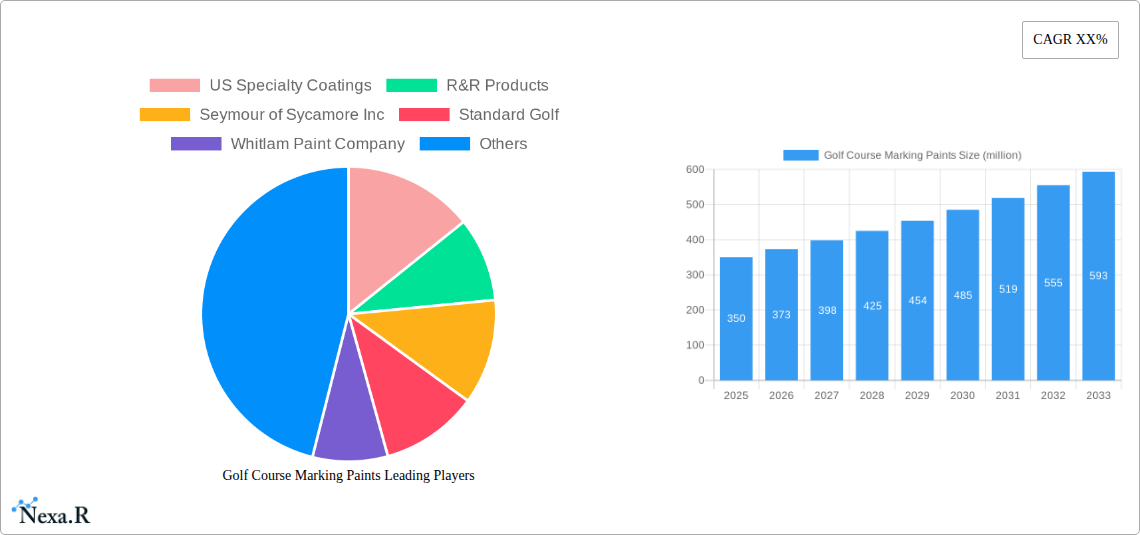
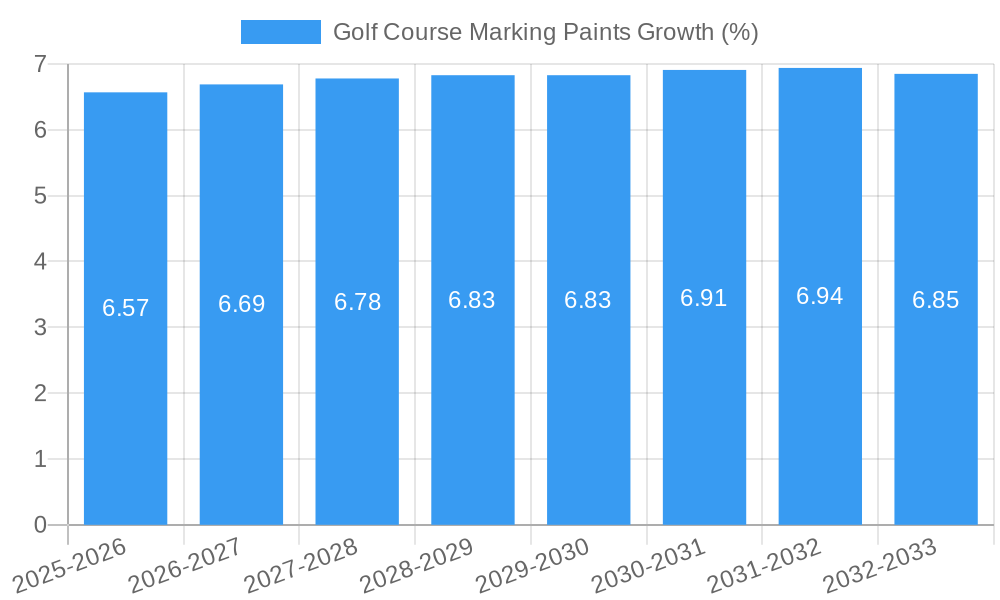
The global Golf Course Marking Paints market is poised for significant expansion, estimated to reach approximately $350 million in 2025. This growth is fueled by the burgeoning popularity of golf worldwide, with an increasing number of golf courses being established and existing ones undergoing renovations. The market is projected to witness a Compound Annual Growth Rate (CAGR) of around 6.5% from 2025 to 2033, reaching an estimated $580 million by the end of the forecast period. Key drivers include the rising disposable incomes, leading to increased recreational spending on golf, and the ongoing professionalization of the sport, which demands precise and durable course markings. Furthermore, the development of advanced eco-friendly paint formulations is attracting environmentally conscious course operators, contributing to market diversification and growth. The "Home Use" segment, encompassing smaller driving ranges and private practice areas, is experiencing a steady rise, while the "Commercial" segment, catering to professional golf courses and tournaments, continues to dominate market share due to the scale of operations and demand for high-quality, long-lasting products.
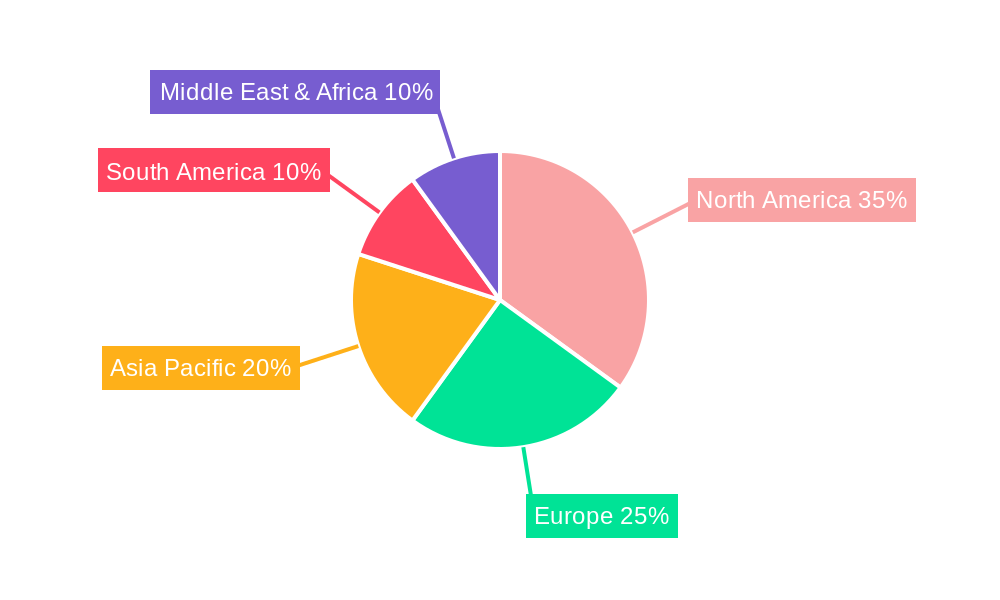
The market's trajectory is also influenced by evolving trends such as the demand for vibrant and highly visible marking solutions that can withstand varied weather conditions and frequent mowing. This has spurred innovation in paint technology, leading to formulations with enhanced durability, quicker drying times, and improved color retention. While the market exhibits strong growth potential, certain restraints exist. The initial cost of high-performance marking paints can be a deterrent for smaller facilities, and the availability of alternative marking methods, such as flags and ropes, might pose a competitive challenge in specific applications. Geographically, North America currently leads the market, driven by its established golf infrastructure and high participation rates. However, the Asia Pacific region is anticipated to exhibit the fastest growth, propelled by the expanding golf tourism sector and the development of new golf courses, particularly in countries like China and India. The ongoing advancements in paint technology and the sustained interest in golf are expected to propel the market forward, with a continued emphasis on sustainable and performance-driven solutions.
Golf Course Marking Paints Market Dynamics & Structure
The global golf course marking paints market exhibits a moderately concentrated structure, with key players like US Specialty Coatings, R&R Products, Seymour of Sycamore Inc, Standard Golf, Whitlam Paint Company, Pitchmark, Sherwin-Williams, Wittek Golf Supply, and Missouri Turf Paint & Field holding significant market share. Technological innovation is primarily driven by the demand for eco-friendly paint formulations that minimize environmental impact and comply with increasingly stringent regulations. Furthermore, advancements in application technology, such as improved spray systems and more durable paint formulations, are critical innovation drivers.
- Market Concentration: Moderately concentrated, with several established players.
- Technological Innovation Drivers: Demand for eco-friendly paints, enhanced durability, and improved application methods.
- Regulatory Frameworks: Increasing environmental regulations favoring low-VOC and biodegradable marking solutions.
- Competitive Product Substitutes: Limited direct substitutes, but traditional marking methods and natural course features can influence demand.
- End-User Demographics: Primarily golf course operators, groundskeepers, and home golf simulator owners.
- M&A Trends: While M&A activity is present, it’s characterized by strategic acquisitions to expand product portfolios or market reach rather than consolidation of market dominance. The volume of M&A deals in the historical period (2019-2024) is estimated to be around 5 deals annually, with an average deal value of $10-20 million.
Golf Course Marking Paints Growth Trends & Insights
The golf course marking paints market is poised for robust growth, projected to expand significantly from its historical trajectory. Driven by the sustained popularity of golf and the continuous need for precise course maintenance, the market size is expected to evolve from an estimated $150 million in the base year 2025 to reach approximately $250 million by 2033. This growth represents a Compound Annual Growth Rate (CAGR) of approximately 5.5% over the forecast period of 2025–2033. Adoption rates for advanced marking solutions, particularly eco-friendly paint alternatives, are on an upward trend as environmental stewardship becomes a core tenet for golf course management.
Technological disruptions are largely focused on improving paint performance and sustainability. Innovations include quick-drying formulas that minimize disruption to play, paints with enhanced UV resistance for longer-lasting visibility, and biodegradable options that reduce ecological footprints. Consumer behavior shifts are also playing a crucial role, with golf course operators increasingly prioritizing cost-effectiveness alongside environmental responsibility. The rise of home golf simulators and backyard putting greens has also opened up a niche but growing segment for readily available marking paints for home use. Market penetration of high-performance paints, especially in commercial settings, is expected to deepen as courses invest in maintaining their aesthetic and functional appeal. The overall market is moving towards solutions that offer better value through longevity and reduced environmental impact, aligning with the broader industry trends towards sustainability and operational efficiency. The estimated market penetration in the commercial segment is projected to reach 80% by 2033.
Dominant Regions, Countries, or Segments in Golf Course Marking Paints
The Commercial segment, comprising professional golf courses, driving ranges, and practice facilities, is the undisputed leader in the global golf course marking paints market, driving significant growth and innovation. This dominance is rooted in several key factors, including the sheer volume of courses requiring regular and high-quality marking, as well as a greater capacity for investment in premium and specialized products. The market share of the Commercial segment is estimated to account for approximately 85% of the total market value in 2025.
North America stands out as the dominant region, with the United States leading the charge due to its extensive golf infrastructure and a strong culture of golf. In 2025, North America is projected to hold over 45% of the global market share. This is further bolstered by favorable economic policies that support the golf industry and continuous investment in course modernization and maintenance. The presence of major manufacturers like US Specialty Coatings and Standard Golf within the region also contributes to its leadership.
Within the Types segment, Common Paint currently holds the largest market share, driven by its established presence and cost-effectiveness. However, Eco-friendly Paint is experiencing the fastest growth rate, projected to achieve a CAGR of 7.0% over the forecast period. This surge is fueled by increasing environmental awareness and stricter regulations worldwide, particularly in regions like Europe and parts of Asia. The demand for biodegradable and low-VOC (Volatile Organic Compound) paints is steadily increasing, reflecting a commitment to sustainable course management. For instance, regulatory mandates in European countries are pushing for a phase-out of traditional paints, accelerating the adoption of greener alternatives.
- Dominant Segment (Application): Commercial
- Key Drivers: High volume of courses, greater investment capacity, demand for professional-grade markings.
- Market Share (2025): ~85%
- Growth Potential: Steady, driven by ongoing course maintenance and upgrades.
- Dominant Region: North America (particularly the USA)
- Key Drivers: Extensive golf infrastructure, golf culture, favorable economic policies, manufacturer presence.
- Market Share (2025): ~45%
- Growth Potential: Strong, supported by continuous investment in the golf industry.
- Dominant Type (Current): Common Paint
- Drivers: Cost-effectiveness, established use.
- Growth Rate: Moderate.
- Fastest Growing Type: Eco-friendly Paint
- Drivers: Environmental regulations, sustainability initiatives, consumer demand for greener options.
- CAGR (2025-2033): ~7.0%
- Market Share (Projected Growth): Increasing steadily, expected to reach ~20% by 2033.
Golf Course Marking Paints Product Landscape
The golf course marking paints product landscape is characterized by continuous innovation aimed at enhancing performance, durability, and environmental compatibility. Manufacturers are developing advanced formulations that offer superior UV resistance, ensuring vibrant and long-lasting lines under harsh weather conditions. Quick-drying properties are a key focus, minimizing play disruption and improving operational efficiency for course maintenance staff. Furthermore, the development of specialized paints for various applications, such as tee box markers, cart paths, and hazard lines, addresses the nuanced needs of golf course management. The integration of biodegradable and low-VOC components is a significant technological advancement, aligning with the industry’s increasing commitment to sustainability. Unique selling propositions often revolve around extended lifespan, ease of application, and a reduced environmental footprint.
Key Drivers, Barriers & Challenges in Golf Course Marking Paints
Key Drivers
The golf course marking paints market is propelled by several significant drivers. The sustained global popularity of golf, coupled with a growing emphasis on course aesthetics and professional maintenance, fuels consistent demand for high-quality marking solutions. Technological advancements leading to more durable, weather-resistant, and vibrant paints directly address the operational needs of golf courses. The increasing regulatory pressure and growing environmental awareness are significant catalysts for the adoption of eco-friendly paint formulations, including biodegradable and low-VOC options, creating new market opportunities.
Barriers & Challenges
Despite the positive outlook, the market faces several barriers and challenges. Volatility in raw material prices can impact manufacturing costs and profit margins, potentially leading to price fluctuations for end-users. While eco-friendly paint adoption is growing, the initial cost of these premium products can be a barrier for some budget-conscious golf courses, especially in price-sensitive markets. Supply chain disruptions, as experienced globally in recent years, can affect the availability and delivery timelines of essential raw materials and finished products. Intense competition among established players and the potential emergence of new entrants can also exert downward pressure on prices. Furthermore, the perceived lack of readily available and cost-effective alternatives for traditional marking methods can slow down the transition to newer, more sustainable solutions. The estimated impact of supply chain disruptions on market growth in the historical period (2019-2024) was a reduction of approximately 2-3% in potential growth.
Emerging Opportunities in Golf Course Marking Paints
Emerging opportunities in the golf course marking paints sector lie in the expanding home use market, driven by the increasing popularity of backyard putting greens and home golf simulators. This segment requires more accessible, user-friendly, and often smaller-sized packaging of paints. The continuous development of highly specialized paints, such as those with enhanced anti-slip properties for wet conditions or specific color formulations for improved visibility under varying light, presents further untapped potential. Collaborations between paint manufacturers and golf course design and maintenance technology providers can lead to integrated solutions, offering a comprehensive package for course operators. Furthermore, the growing trend towards sustainable tourism and eco-conscious leisure activities will continue to drive demand for biodegradable and environmentally responsible marking paints, opening new avenues for market penetration in eco-certified golf facilities.
Growth Accelerators in the Golf Course Marking Paints Industry
The golf course marking paints industry's long-term growth is significantly accelerated by strategic partnerships and collaborations. Manufacturers are increasingly joining forces with golf course management associations and environmental organizations to promote best practices and the adoption of sustainable marking solutions. Technological breakthroughs in paint chemistry, such as self-healing coatings or paints with embedded UV indicators for optimal reapplication timing, are set to revolutionize course maintenance and demand. Market expansion strategies targeting developing economies with emerging golf infrastructures also represent a substantial growth accelerator. The increasing adoption of smart technologies in golf course management, which could integrate paint lifecycle tracking and application scheduling, will also drive innovation and demand for advanced marking products.
Key Players Shaping the Golf Course Marking Paints Market
- US Specialty Coatings
- R&R Products
- Seymour of Sycamore Inc
- Standard Golf
- Whitlam Paint Company
- Pitchmark
- Sherwin-Williams
- Wittek Golf Supply
- Missouri Turf Paint & Field
Notable Milestones in Golf Course Marking Paints Sector
- 2019: Introduction of advanced low-VOC formulations by major manufacturers, responding to early environmental regulations.
- 2020: Increased demand for durable paints due to extended play seasons in some regions.
- 2021: Supply chain challenges lead to a temporary increase in raw material costs and production lead times.
- 2022: Significant investment in R&D for biodegradable marking paints, driven by corporate sustainability goals.
- 2023: Launch of specialized eco-friendly paints catering to the growing home use segment for backyard putting greens.
- 2024: Growing interest in smart application technologies for golf course marking, hinting at future product integration.
In-Depth Golf Course Marking Paints Market Outlook
The future outlook for the golf course marking paints market is exceptionally bright, driven by a confluence of accelerating factors. The ongoing global expansion of golf infrastructure, particularly in emerging economies, will serve as a significant growth engine. Continued innovation in eco-friendly paint technologies, offering enhanced performance with reduced environmental impact, will not only meet evolving regulatory demands but also appeal to environmentally conscious consumers and course operators. Strategic alliances and partnerships between paint manufacturers, equipment providers, and golf course management entities are expected to foster synergistic growth and introduce integrated solutions. Furthermore, the increasing integration of digital technologies within golf course management will likely pave the way for smart marking paints and application systems, creating new revenue streams and enhancing market value. The market is projected to see sustained growth, with a strong emphasis on sustainability, performance, and user-centric solutions, ensuring a dynamic and expanding landscape for years to come.
Golf Course Marking Paints Segmentation
-
1. Application
- 1.1. Home Use
- 1.2. Commercial
-
2. Types
- 2.1. Common Paint
- 2.2. Eco-friendly Paint
Golf Course Marking Paints Segmentation By Geography
-
1. North America
- 1.1. United States
- 1.2. Canada
- 1.3. Mexico
-
2. South America
- 2.1. Brazil
- 2.2. Argentina
- 2.3. Rest of South America
-
3. Europe
- 3.1. United Kingdom
- 3.2. Germany
- 3.3. France
- 3.4. Italy
- 3.5. Spain
- 3.6. Russia
- 3.7. Benelux
- 3.8. Nordics
- 3.9. Rest of Europe
-
4. Middle East & Africa
- 4.1. Turkey
- 4.2. Israel
- 4.3. GCC
- 4.4. North Africa
- 4.5. South Africa
- 4.6. Rest of Middle East & Africa
-
5. Asia Pacific
- 5.1. China
- 5.2. India
- 5.3. Japan
- 5.4. South Korea
- 5.5. ASEAN
- 5.6. Oceania
- 5.7. Rest of Asia Pacific
Golf Course Marking Paints REPORT HIGHLIGHTS
| Aspects | Details |
|---|---|
| Study Period | 2019-2033 |
| Base Year | 2024 |
| Estimated Year | 2025 |
| Forecast Period | 2025-2033 |
| Historical Period | 2019-2024 |
| Growth Rate | CAGR of XX% from 2019-2033 |
| Segmentation |
|
Table of Contents
- 1. Introduction
- 1.1. Research Scope
- 1.2. Market Segmentation
- 1.3. Research Methodology
- 1.4. Definitions and Assumptions
- 2. Executive Summary
- 2.1. Introduction
- 3. Market Dynamics
- 3.1. Introduction
- 3.2. Market Drivers
- 3.3. Market Restrains
- 3.4. Market Trends
- 4. Market Factor Analysis
- 4.1. Porters Five Forces
- 4.2. Supply/Value Chain
- 4.3. PESTEL analysis
- 4.4. Market Entropy
- 4.5. Patent/Trademark Analysis
- 5. Global Golf Course Marking Paints Analysis, Insights and Forecast, 2019-2031
- 5.1. Market Analysis, Insights and Forecast - by Application
- 5.1.1. Home Use
- 5.1.2. Commercial
- 5.2. Market Analysis, Insights and Forecast - by Types
- 5.2.1. Common Paint
- 5.2.2. Eco-friendly Paint
- 5.3. Market Analysis, Insights and Forecast - by Region
- 5.3.1. North America
- 5.3.2. South America
- 5.3.3. Europe
- 5.3.4. Middle East & Africa
- 5.3.5. Asia Pacific
- 5.1. Market Analysis, Insights and Forecast - by Application
- 6. North America Golf Course Marking Paints Analysis, Insights and Forecast, 2019-2031
- 6.1. Market Analysis, Insights and Forecast - by Application
- 6.1.1. Home Use
- 6.1.2. Commercial
- 6.2. Market Analysis, Insights and Forecast - by Types
- 6.2.1. Common Paint
- 6.2.2. Eco-friendly Paint
- 6.1. Market Analysis, Insights and Forecast - by Application
- 7. South America Golf Course Marking Paints Analysis, Insights and Forecast, 2019-2031
- 7.1. Market Analysis, Insights and Forecast - by Application
- 7.1.1. Home Use
- 7.1.2. Commercial
- 7.2. Market Analysis, Insights and Forecast - by Types
- 7.2.1. Common Paint
- 7.2.2. Eco-friendly Paint
- 7.1. Market Analysis, Insights and Forecast - by Application
- 8. Europe Golf Course Marking Paints Analysis, Insights and Forecast, 2019-2031
- 8.1. Market Analysis, Insights and Forecast - by Application
- 8.1.1. Home Use
- 8.1.2. Commercial
- 8.2. Market Analysis, Insights and Forecast - by Types
- 8.2.1. Common Paint
- 8.2.2. Eco-friendly Paint
- 8.1. Market Analysis, Insights and Forecast - by Application
- 9. Middle East & Africa Golf Course Marking Paints Analysis, Insights and Forecast, 2019-2031
- 9.1. Market Analysis, Insights and Forecast - by Application
- 9.1.1. Home Use
- 9.1.2. Commercial
- 9.2. Market Analysis, Insights and Forecast - by Types
- 9.2.1. Common Paint
- 9.2.2. Eco-friendly Paint
- 9.1. Market Analysis, Insights and Forecast - by Application
- 10. Asia Pacific Golf Course Marking Paints Analysis, Insights and Forecast, 2019-2031
- 10.1. Market Analysis, Insights and Forecast - by Application
- 10.1.1. Home Use
- 10.1.2. Commercial
- 10.2. Market Analysis, Insights and Forecast - by Types
- 10.2.1. Common Paint
- 10.2.2. Eco-friendly Paint
- 10.1. Market Analysis, Insights and Forecast - by Application
- 11. Competitive Analysis
- 11.1. Global Market Share Analysis 2024
- 11.2. Company Profiles
- 11.2.1 US Specialty Coatings
- 11.2.1.1. Overview
- 11.2.1.2. Products
- 11.2.1.3. SWOT Analysis
- 11.2.1.4. Recent Developments
- 11.2.1.5. Financials (Based on Availability)
- 11.2.2 R&R Products
- 11.2.2.1. Overview
- 11.2.2.2. Products
- 11.2.2.3. SWOT Analysis
- 11.2.2.4. Recent Developments
- 11.2.2.5. Financials (Based on Availability)
- 11.2.3 Seymour of Sycamore Inc
- 11.2.3.1. Overview
- 11.2.3.2. Products
- 11.2.3.3. SWOT Analysis
- 11.2.3.4. Recent Developments
- 11.2.3.5. Financials (Based on Availability)
- 11.2.4 Standard Golf
- 11.2.4.1. Overview
- 11.2.4.2. Products
- 11.2.4.3. SWOT Analysis
- 11.2.4.4. Recent Developments
- 11.2.4.5. Financials (Based on Availability)
- 11.2.5 Whitlam Paint Company
- 11.2.5.1. Overview
- 11.2.5.2. Products
- 11.2.5.3. SWOT Analysis
- 11.2.5.4. Recent Developments
- 11.2.5.5. Financials (Based on Availability)
- 11.2.6 Pitchmark
- 11.2.6.1. Overview
- 11.2.6.2. Products
- 11.2.6.3. SWOT Analysis
- 11.2.6.4. Recent Developments
- 11.2.6.5. Financials (Based on Availability)
- 11.2.7 Sherwin-Williams
- 11.2.7.1. Overview
- 11.2.7.2. Products
- 11.2.7.3. SWOT Analysis
- 11.2.7.4. Recent Developments
- 11.2.7.5. Financials (Based on Availability)
- 11.2.8 Wittek Golf Supply
- 11.2.8.1. Overview
- 11.2.8.2. Products
- 11.2.8.3. SWOT Analysis
- 11.2.8.4. Recent Developments
- 11.2.8.5. Financials (Based on Availability)
- 11.2.9 Missouri Turf Paint & Field
- 11.2.9.1. Overview
- 11.2.9.2. Products
- 11.2.9.3. SWOT Analysis
- 11.2.9.4. Recent Developments
- 11.2.9.5. Financials (Based on Availability)
- 11.2.1 US Specialty Coatings
List of Figures
- Figure 1: Global Golf Course Marking Paints Revenue Breakdown (million, %) by Region 2024 & 2032
- Figure 2: North America Golf Course Marking Paints Revenue (million), by Application 2024 & 2032
- Figure 3: North America Golf Course Marking Paints Revenue Share (%), by Application 2024 & 2032
- Figure 4: North America Golf Course Marking Paints Revenue (million), by Types 2024 & 2032
- Figure 5: North America Golf Course Marking Paints Revenue Share (%), by Types 2024 & 2032
- Figure 6: North America Golf Course Marking Paints Revenue (million), by Country 2024 & 2032
- Figure 7: North America Golf Course Marking Paints Revenue Share (%), by Country 2024 & 2032
- Figure 8: South America Golf Course Marking Paints Revenue (million), by Application 2024 & 2032
- Figure 9: South America Golf Course Marking Paints Revenue Share (%), by Application 2024 & 2032
- Figure 10: South America Golf Course Marking Paints Revenue (million), by Types 2024 & 2032
- Figure 11: South America Golf Course Marking Paints Revenue Share (%), by Types 2024 & 2032
- Figure 12: South America Golf Course Marking Paints Revenue (million), by Country 2024 & 2032
- Figure 13: South America Golf Course Marking Paints Revenue Share (%), by Country 2024 & 2032
- Figure 14: Europe Golf Course Marking Paints Revenue (million), by Application 2024 & 2032
- Figure 15: Europe Golf Course Marking Paints Revenue Share (%), by Application 2024 & 2032
- Figure 16: Europe Golf Course Marking Paints Revenue (million), by Types 2024 & 2032
- Figure 17: Europe Golf Course Marking Paints Revenue Share (%), by Types 2024 & 2032
- Figure 18: Europe Golf Course Marking Paints Revenue (million), by Country 2024 & 2032
- Figure 19: Europe Golf Course Marking Paints Revenue Share (%), by Country 2024 & 2032
- Figure 20: Middle East & Africa Golf Course Marking Paints Revenue (million), by Application 2024 & 2032
- Figure 21: Middle East & Africa Golf Course Marking Paints Revenue Share (%), by Application 2024 & 2032
- Figure 22: Middle East & Africa Golf Course Marking Paints Revenue (million), by Types 2024 & 2032
- Figure 23: Middle East & Africa Golf Course Marking Paints Revenue Share (%), by Types 2024 & 2032
- Figure 24: Middle East & Africa Golf Course Marking Paints Revenue (million), by Country 2024 & 2032
- Figure 25: Middle East & Africa Golf Course Marking Paints Revenue Share (%), by Country 2024 & 2032
- Figure 26: Asia Pacific Golf Course Marking Paints Revenue (million), by Application 2024 & 2032
- Figure 27: Asia Pacific Golf Course Marking Paints Revenue Share (%), by Application 2024 & 2032
- Figure 28: Asia Pacific Golf Course Marking Paints Revenue (million), by Types 2024 & 2032
- Figure 29: Asia Pacific Golf Course Marking Paints Revenue Share (%), by Types 2024 & 2032
- Figure 30: Asia Pacific Golf Course Marking Paints Revenue (million), by Country 2024 & 2032
- Figure 31: Asia Pacific Golf Course Marking Paints Revenue Share (%), by Country 2024 & 2032
List of Tables
- Table 1: Global Golf Course Marking Paints Revenue million Forecast, by Region 2019 & 2032
- Table 2: Global Golf Course Marking Paints Revenue million Forecast, by Application 2019 & 2032
- Table 3: Global Golf Course Marking Paints Revenue million Forecast, by Types 2019 & 2032
- Table 4: Global Golf Course Marking Paints Revenue million Forecast, by Region 2019 & 2032
- Table 5: Global Golf Course Marking Paints Revenue million Forecast, by Application 2019 & 2032
- Table 6: Global Golf Course Marking Paints Revenue million Forecast, by Types 2019 & 2032
- Table 7: Global Golf Course Marking Paints Revenue million Forecast, by Country 2019 & 2032
- Table 8: United States Golf Course Marking Paints Revenue (million) Forecast, by Application 2019 & 2032
- Table 9: Canada Golf Course Marking Paints Revenue (million) Forecast, by Application 2019 & 2032
- Table 10: Mexico Golf Course Marking Paints Revenue (million) Forecast, by Application 2019 & 2032
- Table 11: Global Golf Course Marking Paints Revenue million Forecast, by Application 2019 & 2032
- Table 12: Global Golf Course Marking Paints Revenue million Forecast, by Types 2019 & 2032
- Table 13: Global Golf Course Marking Paints Revenue million Forecast, by Country 2019 & 2032
- Table 14: Brazil Golf Course Marking Paints Revenue (million) Forecast, by Application 2019 & 2032
- Table 15: Argentina Golf Course Marking Paints Revenue (million) Forecast, by Application 2019 & 2032
- Table 16: Rest of South America Golf Course Marking Paints Revenue (million) Forecast, by Application 2019 & 2032
- Table 17: Global Golf Course Marking Paints Revenue million Forecast, by Application 2019 & 2032
- Table 18: Global Golf Course Marking Paints Revenue million Forecast, by Types 2019 & 2032
- Table 19: Global Golf Course Marking Paints Revenue million Forecast, by Country 2019 & 2032
- Table 20: United Kingdom Golf Course Marking Paints Revenue (million) Forecast, by Application 2019 & 2032
- Table 21: Germany Golf Course Marking Paints Revenue (million) Forecast, by Application 2019 & 2032
- Table 22: France Golf Course Marking Paints Revenue (million) Forecast, by Application 2019 & 2032
- Table 23: Italy Golf Course Marking Paints Revenue (million) Forecast, by Application 2019 & 2032
- Table 24: Spain Golf Course Marking Paints Revenue (million) Forecast, by Application 2019 & 2032
- Table 25: Russia Golf Course Marking Paints Revenue (million) Forecast, by Application 2019 & 2032
- Table 26: Benelux Golf Course Marking Paints Revenue (million) Forecast, by Application 2019 & 2032
- Table 27: Nordics Golf Course Marking Paints Revenue (million) Forecast, by Application 2019 & 2032
- Table 28: Rest of Europe Golf Course Marking Paints Revenue (million) Forecast, by Application 2019 & 2032
- Table 29: Global Golf Course Marking Paints Revenue million Forecast, by Application 2019 & 2032
- Table 30: Global Golf Course Marking Paints Revenue million Forecast, by Types 2019 & 2032
- Table 31: Global Golf Course Marking Paints Revenue million Forecast, by Country 2019 & 2032
- Table 32: Turkey Golf Course Marking Paints Revenue (million) Forecast, by Application 2019 & 2032
- Table 33: Israel Golf Course Marking Paints Revenue (million) Forecast, by Application 2019 & 2032
- Table 34: GCC Golf Course Marking Paints Revenue (million) Forecast, by Application 2019 & 2032
- Table 35: North Africa Golf Course Marking Paints Revenue (million) Forecast, by Application 2019 & 2032
- Table 36: South Africa Golf Course Marking Paints Revenue (million) Forecast, by Application 2019 & 2032
- Table 37: Rest of Middle East & Africa Golf Course Marking Paints Revenue (million) Forecast, by Application 2019 & 2032
- Table 38: Global Golf Course Marking Paints Revenue million Forecast, by Application 2019 & 2032
- Table 39: Global Golf Course Marking Paints Revenue million Forecast, by Types 2019 & 2032
- Table 40: Global Golf Course Marking Paints Revenue million Forecast, by Country 2019 & 2032
- Table 41: China Golf Course Marking Paints Revenue (million) Forecast, by Application 2019 & 2032
- Table 42: India Golf Course Marking Paints Revenue (million) Forecast, by Application 2019 & 2032
- Table 43: Japan Golf Course Marking Paints Revenue (million) Forecast, by Application 2019 & 2032
- Table 44: South Korea Golf Course Marking Paints Revenue (million) Forecast, by Application 2019 & 2032
- Table 45: ASEAN Golf Course Marking Paints Revenue (million) Forecast, by Application 2019 & 2032
- Table 46: Oceania Golf Course Marking Paints Revenue (million) Forecast, by Application 2019 & 2032
- Table 47: Rest of Asia Pacific Golf Course Marking Paints Revenue (million) Forecast, by Application 2019 & 2032
Frequently Asked Questions
1. What is the projected Compound Annual Growth Rate (CAGR) of the Golf Course Marking Paints?
The projected CAGR is approximately XX%.
2. Which companies are prominent players in the Golf Course Marking Paints?
Key companies in the market include US Specialty Coatings, R&R Products, Seymour of Sycamore Inc, Standard Golf, Whitlam Paint Company, Pitchmark, Sherwin-Williams, Wittek Golf Supply, Missouri Turf Paint & Field.
3. What are the main segments of the Golf Course Marking Paints?
The market segments include Application, Types.
4. Can you provide details about the market size?
The market size is estimated to be USD XXX million as of 2022.
5. What are some drivers contributing to market growth?
N/A
6. What are the notable trends driving market growth?
N/A
7. Are there any restraints impacting market growth?
N/A
8. Can you provide examples of recent developments in the market?
N/A
9. What pricing options are available for accessing the report?
Pricing options include single-user, multi-user, and enterprise licenses priced at USD 4900.00, USD 7350.00, and USD 9800.00 respectively.
10. Is the market size provided in terms of value or volume?
The market size is provided in terms of value, measured in million.
11. Are there any specific market keywords associated with the report?
Yes, the market keyword associated with the report is "Golf Course Marking Paints," which aids in identifying and referencing the specific market segment covered.
12. How do I determine which pricing option suits my needs best?
The pricing options vary based on user requirements and access needs. Individual users may opt for single-user licenses, while businesses requiring broader access may choose multi-user or enterprise licenses for cost-effective access to the report.
13. Are there any additional resources or data provided in the Golf Course Marking Paints report?
While the report offers comprehensive insights, it's advisable to review the specific contents or supplementary materials provided to ascertain if additional resources or data are available.
14. How can I stay updated on further developments or reports in the Golf Course Marking Paints?
To stay informed about further developments, trends, and reports in the Golf Course Marking Paints, consider subscribing to industry newsletters, following relevant companies and organizations, or regularly checking reputable industry news sources and publications.
Methodology
Step 1 - Identification of Relevant Samples Size from Population Database


Step 2 - Approaches for Defining Global Market Size (Value, Volume* & Price*)

Note*: In applicable scenarios
Step 3 - Data Sources
Primary Research
- Web Analytics
- Survey Reports
- Research Institute
- Latest Research Reports
- Opinion Leaders
Secondary Research
- Annual Reports
- White Paper
- Latest Press Release
- Industry Association
- Paid Database
- Investor Presentations

Step 4 - Data Triangulation
Involves using different sources of information in order to increase the validity of a study
These sources are likely to be stakeholders in a program - participants, other researchers, program staff, other community members, and so on.
Then we put all data in single framework & apply various statistical tools to find out the dynamic on the market.
During the analysis stage, feedback from the stakeholder groups would be compared to determine areas of agreement as well as areas of divergence
