

Key Insights
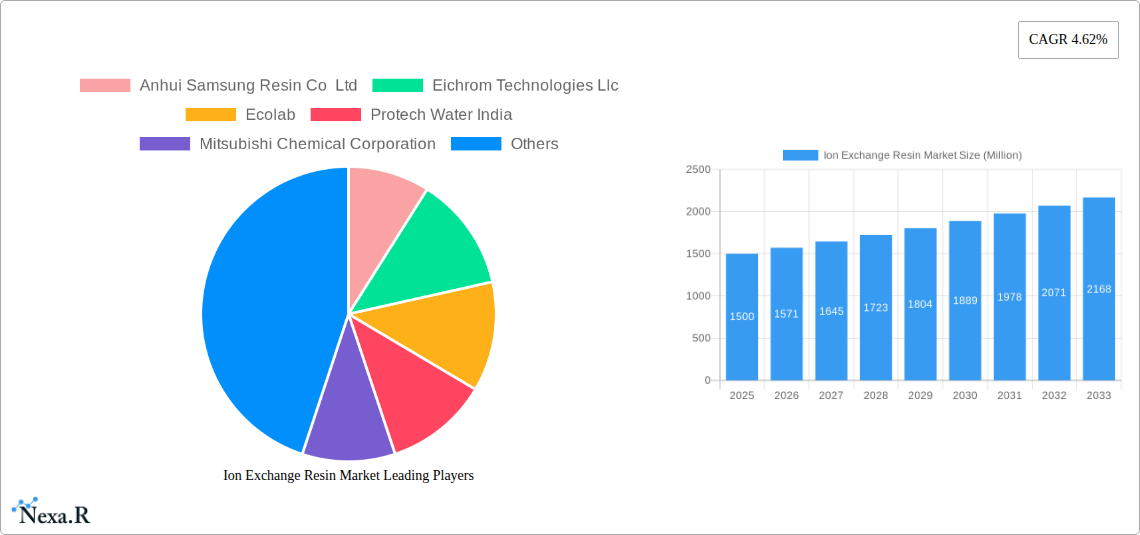
The global ion exchange resin market, valued at approximately $XX million in 2025, is projected to experience robust growth, exhibiting a compound annual growth rate (CAGR) of 4.62% from 2025 to 2033. This expansion is driven by several key factors. The increasing demand for purified water in various industries, including pharmaceuticals, food and beverages, and water treatment, is a primary catalyst. Stringent regulatory frameworks concerning water purity and effluent treatment are further bolstering market growth. Advancements in resin technology, leading to higher efficiency and longer lifespans, contribute significantly. The growing adoption of ion exchange resins in emerging economies, particularly in Asia-Pacific, fueled by industrialization and infrastructure development, presents substantial growth opportunities. Furthermore, the rising focus on sustainable water management practices globally is positively impacting market demand. The market is segmented by resin type (commodity and specialty) and application (pharmaceutical, food & beverage, water treatment, mining & metallurgy, chemical processing, power, and others). Specialty resins, owing to their superior performance characteristics in specific applications, are anticipated to witness faster growth compared to commodity resins. The pharmaceutical and water treatment segments currently hold significant market shares and are expected to remain key drivers of market expansion throughout the forecast period.
Competition in the ion exchange resin market is intense, with both established multinational corporations and regional players vying for market share. Key players such as DuPont, Mitsubishi Chemical Corporation, and Lanxess are leveraging their extensive research and development capabilities to introduce innovative products and expand their market reach. The strategic acquisitions and partnerships observed within the market further intensify competition. However, factors such as fluctuating raw material prices and potential environmental concerns related to resin disposal pose challenges to market growth. Nevertheless, the long-term outlook for the ion exchange resin market remains positive, driven by the aforementioned growth drivers and the ongoing need for efficient and effective water purification and treatment solutions across diverse sectors. The market is expected to witness considerable expansion across all major geographical regions, with Asia-Pacific anticipated to lead the growth due to its rapidly expanding industrial base and burgeoning infrastructure projects.
This comprehensive report provides a detailed analysis of the Ion Exchange Resin market, encompassing market dynamics, growth trends, regional analysis, product landscape, key players, and future outlook. The study period covers 2019-2033, with 2025 as the base and estimated year. The forecast period extends from 2025 to 2033, while the historical period analyzed is 2019-2024. This report is essential for industry professionals, investors, and anyone seeking to understand this crucial market segment. The market size is projected at xx Million by 2033.
Ion Exchange Resin Market Market Dynamics & Structure
The Ion Exchange Resin market, encompassing both commodity and specialty resins, is characterized by moderate concentration, with several key players holding significant market share. Technological innovation, particularly in developing high-performance resins for specific applications, is a key driver. Stringent environmental regulations concerning water treatment and industrial effluent disposal are also impacting market growth. The market faces competition from alternative technologies, including membrane filtration. Mergers and acquisitions (M&A) activity has been moderate, with strategic partnerships increasingly common. End-user demographics vary widely across application segments, including water treatment, pharmaceuticals, and chemical processing.
- Market Concentration: Moderately concentrated, with the top 5 players holding approximately xx% of the market share in 2024.
- Technological Innovation: Focus on high-performance, specialized resins for niche applications and sustainable manufacturing processes.
- Regulatory Framework: Stringent environmental regulations drive demand, particularly in water treatment.
- Competitive Substitutes: Membrane filtration and other separation technologies pose competitive challenges.
- M&A Activity: Moderate activity, with a focus on strategic partnerships and acquisitions to expand product portfolios and geographic reach. Approximately xx M&A deals were recorded between 2019 and 2024.
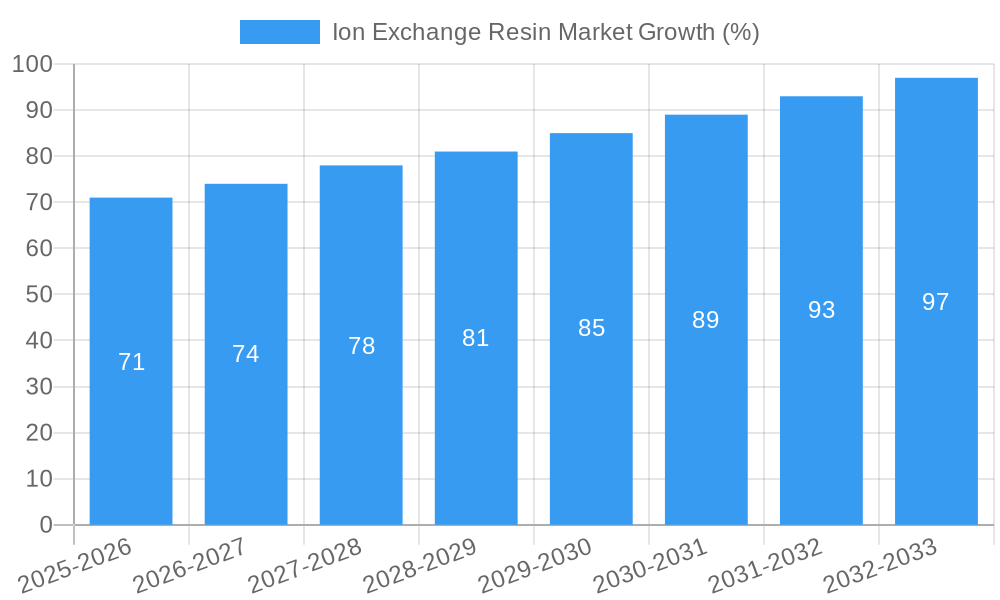
Ion Exchange Resin Market Growth Trends & Insights
The Ion Exchange Resin market is experiencing steady growth, driven by increasing demand across various applications. The market size has grown from xx Million in 2019 to xx Million in 2024, registering a CAGR of xx%. This growth is fueled by rising industrialization, urbanization, and increasing environmental concerns. Technological advancements, such as the development of more efficient and selective resins, are further driving market expansion. Consumer behavior shifts towards sustainable and environmentally friendly solutions are also impacting market dynamics. Market penetration remains relatively high in developed regions but offers significant growth potential in emerging economies.
- Market Size Evolution: Steady growth from xx Million in 2019 to xx Million in 2024, projected to reach xx Million by 2033.
- Adoption Rates: High adoption rates in developed regions, with significant growth potential in emerging markets.
- Technological Disruptions: Advancements in resin technology, focusing on enhanced selectivity, efficiency, and sustainability.
- Consumer Behavior Shifts: Growing demand for environmentally friendly and sustainable solutions.
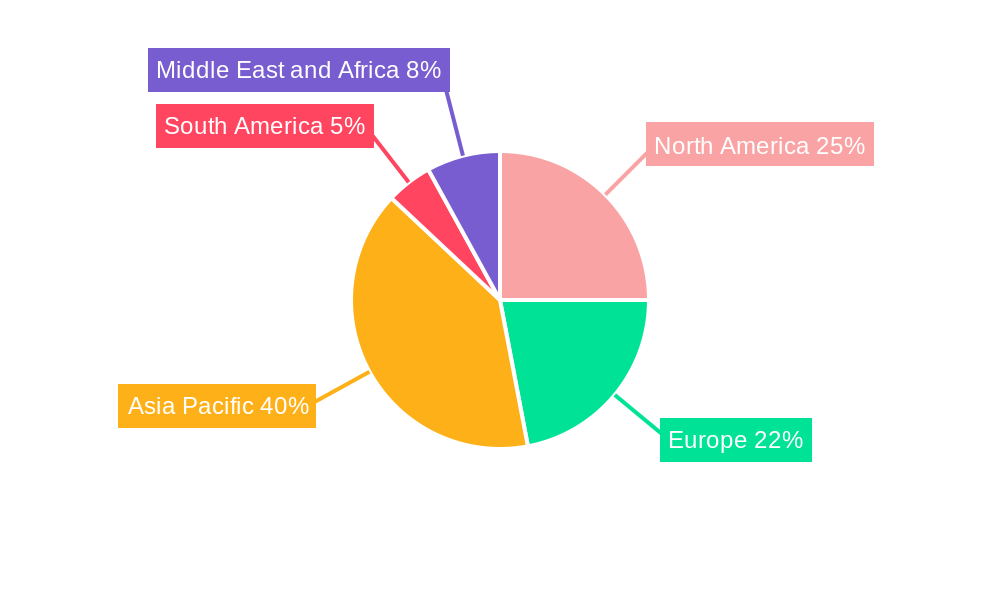
Dominant Regions, Countries, or Segments in Ion Exchange Resin Market
The water treatment segment dominates the Ion Exchange Resin market, driven by increasing concerns about water quality and scarcity. North America and Europe hold significant market share, while Asia Pacific is expected to witness the highest growth rate due to rapid industrialization and infrastructure development. Within resin types, commodity resins command a larger market share due to their cost-effectiveness, while specialty resins show higher growth potential due to specific application requirements.
Dominant Segments:
- Water Treatment: Largest application segment driven by stringent water quality regulations and increasing water scarcity.
- Pharmaceutical: High growth due to stringent purity requirements in pharmaceutical manufacturing.
- Region: North America and Europe hold leading positions, while Asia Pacific is the fastest-growing region.
Key Drivers:
- Stringent environmental regulations: Driving demand for advanced water treatment solutions.
- Infrastructure development: Boosting demand in emerging economies.
- Rising industrialization: Increasing the need for efficient industrial processes.
Ion Exchange Resin Market Product Landscape
The Ion Exchange Resin market offers a wide range of products, including commodity and specialty resins designed for specific applications. Innovations focus on improving resin performance, including higher selectivity, increased capacity, and longer lifespan. Technological advancements incorporate sustainable manufacturing practices and the development of bio-based resins. Unique selling propositions focus on cost-effectiveness, high efficiency, and environmental sustainability.
Key Drivers, Barriers & Challenges in Ion Exchange Resin Market
Key Drivers:
- Growing demand for water purification and treatment.
- Stringent environmental regulations.
- Increasing industrialization and urbanization.
- Advancements in resin technology.
Key Challenges:
- Fluctuations in raw material prices.
- Competition from alternative technologies.
- Supply chain disruptions.
- Regulatory hurdles and compliance costs.
Emerging Opportunities in Ion Exchange Resin Market
Emerging opportunities include the growing demand for specialized resins in niche applications such as bioprocessing, renewable energy, and electronics manufacturing. Untapped markets in developing economies present significant growth potential. Innovative applications, such as using ion exchange resins for CO2 capture and metal recovery, are emerging.
Growth Accelerators in the Ion Exchange Resin Market Industry
Long-term growth will be driven by continued technological advancements, strategic partnerships, and market expansion into emerging economies. Sustainable manufacturing practices and the development of bio-based resins will further accelerate market growth.
Key Players Shaping the Ion Exchange Resin Market Market
- Anhui Samsung Resin Co Ltd
- Eichrom Technologies Llc
- Ecolab
- Protech Water India
- Mitsubishi Chemical Corporation
- Dupont
- Resintech Inc
- Suqing Group
- Bio-rad Laboratories Inc
- Evoqua Water Technologies Llc
- Samyang Corporation
- Pure Resin Co Ltd
- Suzhou Bojie Resin Technology Co Ltd
- Novasep
- Jacobi Carbons Group
- Sunresin New Materials Co Ltd
- Thermax Limited
- Lanxess
- Ion Exchange (India) Ltd
- Doshion Polyscience Pvt Ltd
Notable Milestones in Ion Exchange Resin Market Sector
- November 2022: Purolite (Ecolab) renewed its deal with Repligen Corporation to supply ligands until 2032.
- January 2023: Lanxess AG and TotalEnergies partnered for sustainable styrene production.
In-Depth Ion Exchange Resin Market Market Outlook
The Ion Exchange Resin market is poised for continued growth, driven by technological innovations, strategic partnerships, and expanding applications across various industries. Future market potential is significant, particularly in emerging economies and niche applications. Strategic opportunities exist for companies focusing on sustainable manufacturing, developing high-performance resins, and expanding into untapped markets.
Ion Exchange Resin Market Segmentation
-
1. Type
- 1.1. Commodity Resins
- 1.2. Specialty Resins
-
2. Application
- 2.1. Pharmaceutical
- 2.2. Food and Beverage
- 2.3. Water Treatment
- 2.4. Mining and Metallurgy
- 2.5. Chemical Processing
- 2.6. Power
- 2.7. Other Applications
Ion Exchange Resin Market Segmentation By Geography
-
1. Asia Pacific
- 1.1. China
- 1.2. India
- 1.3. Japan
- 1.4. South Korea
- 1.5. ASEAN Countries
- 1.6. Rest of Asia Pacific
-
2. North America
- 2.1. United States
- 2.2. Canada
- 2.3. Mexico
-
3. Europe
- 3.1. Germany
- 3.2. United Kingdom
- 3.3. Italy
- 3.4. France
- 3.5. Rest of Europe
-
4. South America
- 4.1. Brazil
- 4.2. Argentina
- 4.3. Rest of South America
-
5. Middle East and Africa
- 5.1. Saudi Arabia
- 5.2. South Africa
- 5.3. Rest of Middle East and Africa
Ion Exchange Resin Market REPORT HIGHLIGHTS
| Aspects | Details |
|---|---|
| Study Period | 2019-2033 |
| Base Year | 2024 |
| Estimated Year | 2025 |
| Forecast Period | 2025-2033 |
| Historical Period | 2019-2024 |
| Growth Rate | CAGR of 4.62% from 2019-2033 |
| Segmentation |
|
Table of Contents
- 1. Introduction
- 1.1. Research Scope
- 1.2. Market Segmentation
- 1.3. Research Methodology
- 1.4. Definitions and Assumptions
- 2. Executive Summary
- 2.1. Introduction
- 3. Market Dynamics
- 3.1. Introduction
- 3.2. Market Drivers
- 3.2.1. Increasing Demand For Ultra Pure Water From Electronics Or Pharmaceutical Industry; Growing Wastewater Treatment Industry; Other Drivers
- 3.3. Market Restrains
- 3.3.1. Bacterial Contamination Caused by Ion Exchange Resins; Other Restraints
- 3.4. Market Trends
- 3.4.1. Water Treatment Segment to Drive the Market
- 4. Market Factor Analysis
- 4.1. Porters Five Forces
- 4.2. Supply/Value Chain
- 4.3. PESTEL analysis
- 4.4. Market Entropy
- 4.5. Patent/Trademark Analysis
- 5. Global Ion Exchange Resin Market Analysis, Insights and Forecast, 2019-2031
- 5.1. Market Analysis, Insights and Forecast - by Type
- 5.1.1. Commodity Resins
- 5.1.2. Specialty Resins
- 5.2. Market Analysis, Insights and Forecast - by Application
- 5.2.1. Pharmaceutical
- 5.2.2. Food and Beverage
- 5.2.3. Water Treatment
- 5.2.4. Mining and Metallurgy
- 5.2.5. Chemical Processing
- 5.2.6. Power
- 5.2.7. Other Applications
- 5.3. Market Analysis, Insights and Forecast - by Region
- 5.3.1. Asia Pacific
- 5.3.2. North America
- 5.3.3. Europe
- 5.3.4. South America
- 5.3.5. Middle East and Africa
- 5.1. Market Analysis, Insights and Forecast - by Type
- 6. Asia Pacific Ion Exchange Resin Market Analysis, Insights and Forecast, 2019-2031
- 6.1. Market Analysis, Insights and Forecast - by Type
- 6.1.1. Commodity Resins
- 6.1.2. Specialty Resins
- 6.2. Market Analysis, Insights and Forecast - by Application
- 6.2.1. Pharmaceutical
- 6.2.2. Food and Beverage
- 6.2.3. Water Treatment
- 6.2.4. Mining and Metallurgy
- 6.2.5. Chemical Processing
- 6.2.6. Power
- 6.2.7. Other Applications
- 6.1. Market Analysis, Insights and Forecast - by Type
- 7. North America Ion Exchange Resin Market Analysis, Insights and Forecast, 2019-2031
- 7.1. Market Analysis, Insights and Forecast - by Type
- 7.1.1. Commodity Resins
- 7.1.2. Specialty Resins
- 7.2. Market Analysis, Insights and Forecast - by Application
- 7.2.1. Pharmaceutical
- 7.2.2. Food and Beverage
- 7.2.3. Water Treatment
- 7.2.4. Mining and Metallurgy
- 7.2.5. Chemical Processing
- 7.2.6. Power
- 7.2.7. Other Applications
- 7.1. Market Analysis, Insights and Forecast - by Type
- 8. Europe Ion Exchange Resin Market Analysis, Insights and Forecast, 2019-2031
- 8.1. Market Analysis, Insights and Forecast - by Type
- 8.1.1. Commodity Resins
- 8.1.2. Specialty Resins
- 8.2. Market Analysis, Insights and Forecast - by Application
- 8.2.1. Pharmaceutical
- 8.2.2. Food and Beverage
- 8.2.3. Water Treatment
- 8.2.4. Mining and Metallurgy
- 8.2.5. Chemical Processing
- 8.2.6. Power
- 8.2.7. Other Applications
- 8.1. Market Analysis, Insights and Forecast - by Type
- 9. South America Ion Exchange Resin Market Analysis, Insights and Forecast, 2019-2031
- 9.1. Market Analysis, Insights and Forecast - by Type
- 9.1.1. Commodity Resins
- 9.1.2. Specialty Resins
- 9.2. Market Analysis, Insights and Forecast - by Application
- 9.2.1. Pharmaceutical
- 9.2.2. Food and Beverage
- 9.2.3. Water Treatment
- 9.2.4. Mining and Metallurgy
- 9.2.5. Chemical Processing
- 9.2.6. Power
- 9.2.7. Other Applications
- 9.1. Market Analysis, Insights and Forecast - by Type
- 10. Middle East and Africa Ion Exchange Resin Market Analysis, Insights and Forecast, 2019-2031
- 10.1. Market Analysis, Insights and Forecast - by Type
- 10.1.1. Commodity Resins
- 10.1.2. Specialty Resins
- 10.2. Market Analysis, Insights and Forecast - by Application
- 10.2.1. Pharmaceutical
- 10.2.2. Food and Beverage
- 10.2.3. Water Treatment
- 10.2.4. Mining and Metallurgy
- 10.2.5. Chemical Processing
- 10.2.6. Power
- 10.2.7. Other Applications
- 10.1. Market Analysis, Insights and Forecast - by Type
- 11. Asia Pacific Ion Exchange Resin Market Analysis, Insights and Forecast, 2019-2031
- 11.1. Market Analysis, Insights and Forecast - By Country/Sub-region
- 11.1.1 China
- 11.1.2 India
- 11.1.3 Japan
- 11.1.4 South Korea
- 11.1.5 ASEAN Countries
- 11.1.6 Rest of Asia Pacific
- 12. North America Ion Exchange Resin Market Analysis, Insights and Forecast, 2019-2031
- 12.1. Market Analysis, Insights and Forecast - By Country/Sub-region
- 12.1.1 United States
- 12.1.2 Canada
- 12.1.3 Mexico
- 13. Europe Ion Exchange Resin Market Analysis, Insights and Forecast, 2019-2031
- 13.1. Market Analysis, Insights and Forecast - By Country/Sub-region
- 13.1.1 Germany
- 13.1.2 United Kingdom
- 13.1.3 Italy
- 13.1.4 France
- 13.1.5 Rest of Europe
- 14. South America Ion Exchange Resin Market Analysis, Insights and Forecast, 2019-2031
- 14.1. Market Analysis, Insights and Forecast - By Country/Sub-region
- 14.1.1 Brazil
- 14.1.2 Argentina
- 14.1.3 Rest of South America
- 15. Middle East and Africa Ion Exchange Resin Market Analysis, Insights and Forecast, 2019-2031
- 15.1. Market Analysis, Insights and Forecast - By Country/Sub-region
- 15.1.1 Saudi Arabia
- 15.1.2 South Africa
- 15.1.3 Rest of Middle East and Africa
- 16. Competitive Analysis
- 16.1. Global Market Share Analysis 2024
- 16.2. Company Profiles
- 16.2.1 Anhui Samsung Resin Co Ltd
- 16.2.1.1. Overview
- 16.2.1.2. Products
- 16.2.1.3. SWOT Analysis
- 16.2.1.4. Recent Developments
- 16.2.1.5. Financials (Based on Availability)
- 16.2.2 Eichrom Technologies Llc
- 16.2.2.1. Overview
- 16.2.2.2. Products
- 16.2.2.3. SWOT Analysis
- 16.2.2.4. Recent Developments
- 16.2.2.5. Financials (Based on Availability)
- 16.2.3 Ecolab
- 16.2.3.1. Overview
- 16.2.3.2. Products
- 16.2.3.3. SWOT Analysis
- 16.2.3.4. Recent Developments
- 16.2.3.5. Financials (Based on Availability)
- 16.2.4 Protech Water India
- 16.2.4.1. Overview
- 16.2.4.2. Products
- 16.2.4.3. SWOT Analysis
- 16.2.4.4. Recent Developments
- 16.2.4.5. Financials (Based on Availability)
- 16.2.5 Mitsubishi Chemical Corporation
- 16.2.5.1. Overview
- 16.2.5.2. Products
- 16.2.5.3. SWOT Analysis
- 16.2.5.4. Recent Developments
- 16.2.5.5. Financials (Based on Availability)
- 16.2.6 Dupont
- 16.2.6.1. Overview
- 16.2.6.2. Products
- 16.2.6.3. SWOT Analysis
- 16.2.6.4. Recent Developments
- 16.2.6.5. Financials (Based on Availability)
- 16.2.7 Resintech Inc
- 16.2.7.1. Overview
- 16.2.7.2. Products
- 16.2.7.3. SWOT Analysis
- 16.2.7.4. Recent Developments
- 16.2.7.5. Financials (Based on Availability)
- 16.2.8 Suqing Group
- 16.2.8.1. Overview
- 16.2.8.2. Products
- 16.2.8.3. SWOT Analysis
- 16.2.8.4. Recent Developments
- 16.2.8.5. Financials (Based on Availability)
- 16.2.9 Bio-rad Laboratories Inc
- 16.2.9.1. Overview
- 16.2.9.2. Products
- 16.2.9.3. SWOT Analysis
- 16.2.9.4. Recent Developments
- 16.2.9.5. Financials (Based on Availability)
- 16.2.10 Evoqua Water Technologies Llc
- 16.2.10.1. Overview
- 16.2.10.2. Products
- 16.2.10.3. SWOT Analysis
- 16.2.10.4. Recent Developments
- 16.2.10.5. Financials (Based on Availability)
- 16.2.11 Samyang Corporation
- 16.2.11.1. Overview
- 16.2.11.2. Products
- 16.2.11.3. SWOT Analysis
- 16.2.11.4. Recent Developments
- 16.2.11.5. Financials (Based on Availability)
- 16.2.12 Pure Resin Co Ltd
- 16.2.12.1. Overview
- 16.2.12.2. Products
- 16.2.12.3. SWOT Analysis
- 16.2.12.4. Recent Developments
- 16.2.12.5. Financials (Based on Availability)
- 16.2.13 Suzhou Bojie Resin Technology Co Ltd
- 16.2.13.1. Overview
- 16.2.13.2. Products
- 16.2.13.3. SWOT Analysis
- 16.2.13.4. Recent Developments
- 16.2.13.5. Financials (Based on Availability)
- 16.2.14 Novasep
- 16.2.14.1. Overview
- 16.2.14.2. Products
- 16.2.14.3. SWOT Analysis
- 16.2.14.4. Recent Developments
- 16.2.14.5. Financials (Based on Availability)
- 16.2.15 Jacobi Carbons Group
- 16.2.15.1. Overview
- 16.2.15.2. Products
- 16.2.15.3. SWOT Analysis
- 16.2.15.4. Recent Developments
- 16.2.15.5. Financials (Based on Availability)
- 16.2.16 Sunresin New Materials Co Ltd
- 16.2.16.1. Overview
- 16.2.16.2. Products
- 16.2.16.3. SWOT Analysis
- 16.2.16.4. Recent Developments
- 16.2.16.5. Financials (Based on Availability)
- 16.2.17 Thermax Limited*List Not Exhaustive
- 16.2.17.1. Overview
- 16.2.17.2. Products
- 16.2.17.3. SWOT Analysis
- 16.2.17.4. Recent Developments
- 16.2.17.5. Financials (Based on Availability)
- 16.2.18 Lanxess
- 16.2.18.1. Overview
- 16.2.18.2. Products
- 16.2.18.3. SWOT Analysis
- 16.2.18.4. Recent Developments
- 16.2.18.5. Financials (Based on Availability)
- 16.2.19 Ion Exchange (India) Ltd
- 16.2.19.1. Overview
- 16.2.19.2. Products
- 16.2.19.3. SWOT Analysis
- 16.2.19.4. Recent Developments
- 16.2.19.5. Financials (Based on Availability)
- 16.2.20 Doshion Polyscience Pvt Ltd
- 16.2.20.1. Overview
- 16.2.20.2. Products
- 16.2.20.3. SWOT Analysis
- 16.2.20.4. Recent Developments
- 16.2.20.5. Financials (Based on Availability)
- 16.2.1 Anhui Samsung Resin Co Ltd
List of Figures
- Figure 1: Global Ion Exchange Resin Market Revenue Breakdown (Million, %) by Region 2024 & 2032
- Figure 2: Asia Pacific Ion Exchange Resin Market Revenue (Million), by Country 2024 & 2032
- Figure 3: Asia Pacific Ion Exchange Resin Market Revenue Share (%), by Country 2024 & 2032
- Figure 4: North America Ion Exchange Resin Market Revenue (Million), by Country 2024 & 2032
- Figure 5: North America Ion Exchange Resin Market Revenue Share (%), by Country 2024 & 2032
- Figure 6: Europe Ion Exchange Resin Market Revenue (Million), by Country 2024 & 2032
- Figure 7: Europe Ion Exchange Resin Market Revenue Share (%), by Country 2024 & 2032
- Figure 8: South America Ion Exchange Resin Market Revenue (Million), by Country 2024 & 2032
- Figure 9: South America Ion Exchange Resin Market Revenue Share (%), by Country 2024 & 2032
- Figure 10: Middle East and Africa Ion Exchange Resin Market Revenue (Million), by Country 2024 & 2032
- Figure 11: Middle East and Africa Ion Exchange Resin Market Revenue Share (%), by Country 2024 & 2032
- Figure 12: Asia Pacific Ion Exchange Resin Market Revenue (Million), by Type 2024 & 2032
- Figure 13: Asia Pacific Ion Exchange Resin Market Revenue Share (%), by Type 2024 & 2032
- Figure 14: Asia Pacific Ion Exchange Resin Market Revenue (Million), by Application 2024 & 2032
- Figure 15: Asia Pacific Ion Exchange Resin Market Revenue Share (%), by Application 2024 & 2032
- Figure 16: Asia Pacific Ion Exchange Resin Market Revenue (Million), by Country 2024 & 2032
- Figure 17: Asia Pacific Ion Exchange Resin Market Revenue Share (%), by Country 2024 & 2032
- Figure 18: North America Ion Exchange Resin Market Revenue (Million), by Type 2024 & 2032
- Figure 19: North America Ion Exchange Resin Market Revenue Share (%), by Type 2024 & 2032
- Figure 20: North America Ion Exchange Resin Market Revenue (Million), by Application 2024 & 2032
- Figure 21: North America Ion Exchange Resin Market Revenue Share (%), by Application 2024 & 2032
- Figure 22: North America Ion Exchange Resin Market Revenue (Million), by Country 2024 & 2032
- Figure 23: North America Ion Exchange Resin Market Revenue Share (%), by Country 2024 & 2032
- Figure 24: Europe Ion Exchange Resin Market Revenue (Million), by Type 2024 & 2032
- Figure 25: Europe Ion Exchange Resin Market Revenue Share (%), by Type 2024 & 2032
- Figure 26: Europe Ion Exchange Resin Market Revenue (Million), by Application 2024 & 2032
- Figure 27: Europe Ion Exchange Resin Market Revenue Share (%), by Application 2024 & 2032
- Figure 28: Europe Ion Exchange Resin Market Revenue (Million), by Country 2024 & 2032
- Figure 29: Europe Ion Exchange Resin Market Revenue Share (%), by Country 2024 & 2032
- Figure 30: South America Ion Exchange Resin Market Revenue (Million), by Type 2024 & 2032
- Figure 31: South America Ion Exchange Resin Market Revenue Share (%), by Type 2024 & 2032
- Figure 32: South America Ion Exchange Resin Market Revenue (Million), by Application 2024 & 2032
- Figure 33: South America Ion Exchange Resin Market Revenue Share (%), by Application 2024 & 2032
- Figure 34: South America Ion Exchange Resin Market Revenue (Million), by Country 2024 & 2032
- Figure 35: South America Ion Exchange Resin Market Revenue Share (%), by Country 2024 & 2032
- Figure 36: Middle East and Africa Ion Exchange Resin Market Revenue (Million), by Type 2024 & 2032
- Figure 37: Middle East and Africa Ion Exchange Resin Market Revenue Share (%), by Type 2024 & 2032
- Figure 38: Middle East and Africa Ion Exchange Resin Market Revenue (Million), by Application 2024 & 2032
- Figure 39: Middle East and Africa Ion Exchange Resin Market Revenue Share (%), by Application 2024 & 2032
- Figure 40: Middle East and Africa Ion Exchange Resin Market Revenue (Million), by Country 2024 & 2032
- Figure 41: Middle East and Africa Ion Exchange Resin Market Revenue Share (%), by Country 2024 & 2032
List of Tables
- Table 1: Global Ion Exchange Resin Market Revenue Million Forecast, by Region 2019 & 2032
- Table 2: Global Ion Exchange Resin Market Revenue Million Forecast, by Type 2019 & 2032
- Table 3: Global Ion Exchange Resin Market Revenue Million Forecast, by Application 2019 & 2032
- Table 4: Global Ion Exchange Resin Market Revenue Million Forecast, by Region 2019 & 2032
- Table 5: Global Ion Exchange Resin Market Revenue Million Forecast, by Country 2019 & 2032
- Table 6: China Ion Exchange Resin Market Revenue (Million) Forecast, by Application 2019 & 2032
- Table 7: India Ion Exchange Resin Market Revenue (Million) Forecast, by Application 2019 & 2032
- Table 8: Japan Ion Exchange Resin Market Revenue (Million) Forecast, by Application 2019 & 2032
- Table 9: South Korea Ion Exchange Resin Market Revenue (Million) Forecast, by Application 2019 & 2032
- Table 10: ASEAN Countries Ion Exchange Resin Market Revenue (Million) Forecast, by Application 2019 & 2032
- Table 11: Rest of Asia Pacific Ion Exchange Resin Market Revenue (Million) Forecast, by Application 2019 & 2032
- Table 12: Global Ion Exchange Resin Market Revenue Million Forecast, by Country 2019 & 2032
- Table 13: United States Ion Exchange Resin Market Revenue (Million) Forecast, by Application 2019 & 2032
- Table 14: Canada Ion Exchange Resin Market Revenue (Million) Forecast, by Application 2019 & 2032
- Table 15: Mexico Ion Exchange Resin Market Revenue (Million) Forecast, by Application 2019 & 2032
- Table 16: Global Ion Exchange Resin Market Revenue Million Forecast, by Country 2019 & 2032
- Table 17: Germany Ion Exchange Resin Market Revenue (Million) Forecast, by Application 2019 & 2032
- Table 18: United Kingdom Ion Exchange Resin Market Revenue (Million) Forecast, by Application 2019 & 2032
- Table 19: Italy Ion Exchange Resin Market Revenue (Million) Forecast, by Application 2019 & 2032
- Table 20: France Ion Exchange Resin Market Revenue (Million) Forecast, by Application 2019 & 2032
- Table 21: Rest of Europe Ion Exchange Resin Market Revenue (Million) Forecast, by Application 2019 & 2032
- Table 22: Global Ion Exchange Resin Market Revenue Million Forecast, by Country 2019 & 2032
- Table 23: Brazil Ion Exchange Resin Market Revenue (Million) Forecast, by Application 2019 & 2032
- Table 24: Argentina Ion Exchange Resin Market Revenue (Million) Forecast, by Application 2019 & 2032
- Table 25: Rest of South America Ion Exchange Resin Market Revenue (Million) Forecast, by Application 2019 & 2032
- Table 26: Global Ion Exchange Resin Market Revenue Million Forecast, by Country 2019 & 2032
- Table 27: Saudi Arabia Ion Exchange Resin Market Revenue (Million) Forecast, by Application 2019 & 2032
- Table 28: South Africa Ion Exchange Resin Market Revenue (Million) Forecast, by Application 2019 & 2032
- Table 29: Rest of Middle East and Africa Ion Exchange Resin Market Revenue (Million) Forecast, by Application 2019 & 2032
- Table 30: Global Ion Exchange Resin Market Revenue Million Forecast, by Type 2019 & 2032
- Table 31: Global Ion Exchange Resin Market Revenue Million Forecast, by Application 2019 & 2032
- Table 32: Global Ion Exchange Resin Market Revenue Million Forecast, by Country 2019 & 2032
- Table 33: China Ion Exchange Resin Market Revenue (Million) Forecast, by Application 2019 & 2032
- Table 34: India Ion Exchange Resin Market Revenue (Million) Forecast, by Application 2019 & 2032
- Table 35: Japan Ion Exchange Resin Market Revenue (Million) Forecast, by Application 2019 & 2032
- Table 36: South Korea Ion Exchange Resin Market Revenue (Million) Forecast, by Application 2019 & 2032
- Table 37: ASEAN Countries Ion Exchange Resin Market Revenue (Million) Forecast, by Application 2019 & 2032
- Table 38: Rest of Asia Pacific Ion Exchange Resin Market Revenue (Million) Forecast, by Application 2019 & 2032
- Table 39: Global Ion Exchange Resin Market Revenue Million Forecast, by Type 2019 & 2032
- Table 40: Global Ion Exchange Resin Market Revenue Million Forecast, by Application 2019 & 2032
- Table 41: Global Ion Exchange Resin Market Revenue Million Forecast, by Country 2019 & 2032
- Table 42: United States Ion Exchange Resin Market Revenue (Million) Forecast, by Application 2019 & 2032
- Table 43: Canada Ion Exchange Resin Market Revenue (Million) Forecast, by Application 2019 & 2032
- Table 44: Mexico Ion Exchange Resin Market Revenue (Million) Forecast, by Application 2019 & 2032
- Table 45: Global Ion Exchange Resin Market Revenue Million Forecast, by Type 2019 & 2032
- Table 46: Global Ion Exchange Resin Market Revenue Million Forecast, by Application 2019 & 2032
- Table 47: Global Ion Exchange Resin Market Revenue Million Forecast, by Country 2019 & 2032
- Table 48: Germany Ion Exchange Resin Market Revenue (Million) Forecast, by Application 2019 & 2032
- Table 49: United Kingdom Ion Exchange Resin Market Revenue (Million) Forecast, by Application 2019 & 2032
- Table 50: Italy Ion Exchange Resin Market Revenue (Million) Forecast, by Application 2019 & 2032
- Table 51: France Ion Exchange Resin Market Revenue (Million) Forecast, by Application 2019 & 2032
- Table 52: Rest of Europe Ion Exchange Resin Market Revenue (Million) Forecast, by Application 2019 & 2032
- Table 53: Global Ion Exchange Resin Market Revenue Million Forecast, by Type 2019 & 2032
- Table 54: Global Ion Exchange Resin Market Revenue Million Forecast, by Application 2019 & 2032
- Table 55: Global Ion Exchange Resin Market Revenue Million Forecast, by Country 2019 & 2032
- Table 56: Brazil Ion Exchange Resin Market Revenue (Million) Forecast, by Application 2019 & 2032
- Table 57: Argentina Ion Exchange Resin Market Revenue (Million) Forecast, by Application 2019 & 2032
- Table 58: Rest of South America Ion Exchange Resin Market Revenue (Million) Forecast, by Application 2019 & 2032
- Table 59: Global Ion Exchange Resin Market Revenue Million Forecast, by Type 2019 & 2032
- Table 60: Global Ion Exchange Resin Market Revenue Million Forecast, by Application 2019 & 2032
- Table 61: Global Ion Exchange Resin Market Revenue Million Forecast, by Country 2019 & 2032
- Table 62: Saudi Arabia Ion Exchange Resin Market Revenue (Million) Forecast, by Application 2019 & 2032
- Table 63: South Africa Ion Exchange Resin Market Revenue (Million) Forecast, by Application 2019 & 2032
- Table 64: Rest of Middle East and Africa Ion Exchange Resin Market Revenue (Million) Forecast, by Application 2019 & 2032
Frequently Asked Questions
1. What is the projected Compound Annual Growth Rate (CAGR) of the Ion Exchange Resin Market?
The projected CAGR is approximately 4.62%.
2. Which companies are prominent players in the Ion Exchange Resin Market?
Key companies in the market include Anhui Samsung Resin Co Ltd, Eichrom Technologies Llc, Ecolab, Protech Water India, Mitsubishi Chemical Corporation, Dupont, Resintech Inc, Suqing Group, Bio-rad Laboratories Inc, Evoqua Water Technologies Llc, Samyang Corporation, Pure Resin Co Ltd, Suzhou Bojie Resin Technology Co Ltd, Novasep, Jacobi Carbons Group, Sunresin New Materials Co Ltd, Thermax Limited*List Not Exhaustive, Lanxess, Ion Exchange (India) Ltd, Doshion Polyscience Pvt Ltd.
3. What are the main segments of the Ion Exchange Resin Market?
The market segments include Type, Application.
4. Can you provide details about the market size?
The market size is estimated to be USD XX Million as of 2022.
5. What are some drivers contributing to market growth?
Increasing Demand For Ultra Pure Water From Electronics Or Pharmaceutical Industry; Growing Wastewater Treatment Industry; Other Drivers.
6. What are the notable trends driving market growth?
Water Treatment Segment to Drive the Market.
7. Are there any restraints impacting market growth?
Bacterial Contamination Caused by Ion Exchange Resins; Other Restraints.
8. Can you provide examples of recent developments in the market?
January 2023: Lanxess AG and TotalEnergies formed a partnership in which TotalEnergies will make styrene using tall oil as feedstock. It will account for sustainable manufacturing of respective products and lowering carbon footprint. Through the block, the company strengthens its product portfolio.
9. What pricing options are available for accessing the report?
Pricing options include single-user, multi-user, and enterprise licenses priced at USD 4750, USD 5250, and USD 8750 respectively.
10. Is the market size provided in terms of value or volume?
The market size is provided in terms of value, measured in Million.
11. Are there any specific market keywords associated with the report?
Yes, the market keyword associated with the report is "Ion Exchange Resin Market," which aids in identifying and referencing the specific market segment covered.
12. How do I determine which pricing option suits my needs best?
The pricing options vary based on user requirements and access needs. Individual users may opt for single-user licenses, while businesses requiring broader access may choose multi-user or enterprise licenses for cost-effective access to the report.
13. Are there any additional resources or data provided in the Ion Exchange Resin Market report?
While the report offers comprehensive insights, it's advisable to review the specific contents or supplementary materials provided to ascertain if additional resources or data are available.
14. How can I stay updated on further developments or reports in the Ion Exchange Resin Market?
To stay informed about further developments, trends, and reports in the Ion Exchange Resin Market, consider subscribing to industry newsletters, following relevant companies and organizations, or regularly checking reputable industry news sources and publications.
Methodology
Step 1 - Identification of Relevant Samples Size from Population Database


Step 2 - Approaches for Defining Global Market Size (Value, Volume* & Price*)

Note*: In applicable scenarios
Step 3 - Data Sources
Primary Research
- Web Analytics
- Survey Reports
- Research Institute
- Latest Research Reports
- Opinion Leaders
Secondary Research
- Annual Reports
- White Paper
- Latest Press Release
- Industry Association
- Paid Database
- Investor Presentations

Step 4 - Data Triangulation
Involves using different sources of information in order to increase the validity of a study
These sources are likely to be stakeholders in a program - participants, other researchers, program staff, other community members, and so on.
Then we put all data in single framework & apply various statistical tools to find out the dynamic on the market.
During the analysis stage, feedback from the stakeholder groups would be compared to determine areas of agreement as well as areas of divergence
