

Key Insights
The global Platinum market is projected to experience robust growth, expanding from an estimated market size of $8.51 million in the base year 2025 to reach substantial future valuations. This expansion is driven by a projected Compound Annual Growth Rate (CAGR) of 4.52%. Key growth drivers include sustained demand from the automotive sector for catalytic converters, the enduring appeal of platinum in jewelry manufacturing, and its critical role in industrial chemical catalysts. Emerging applications in electronics and glass production are further contributing to market dynamism. Platinum's intrinsic value, stemming from its exceptional catalytic properties and aesthetic appeal, ensures consistent demand across diverse applications, from luxury goods to essential industrial components, fostering revenue diversification and market resilience.
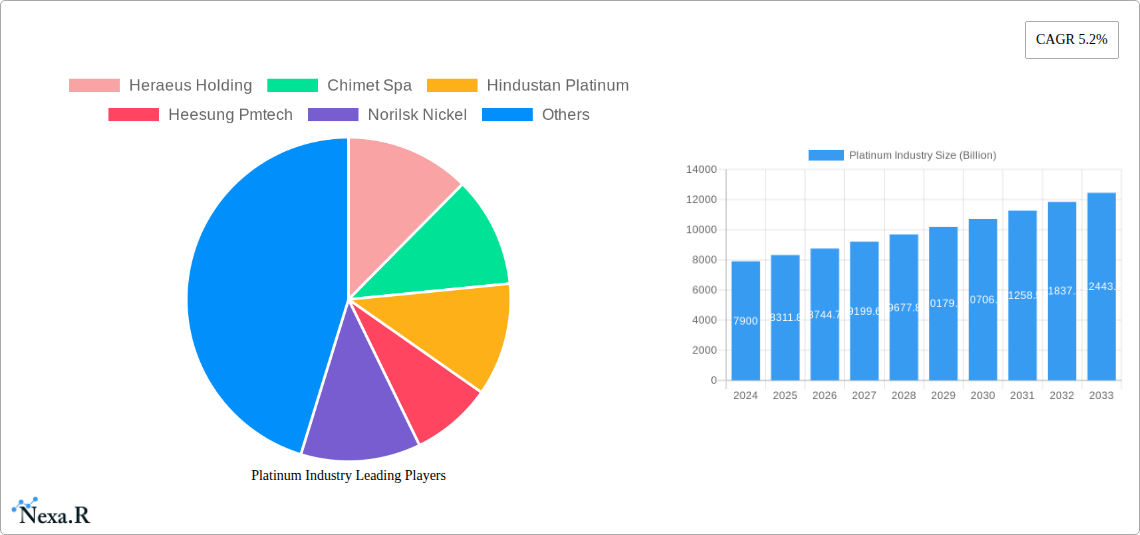
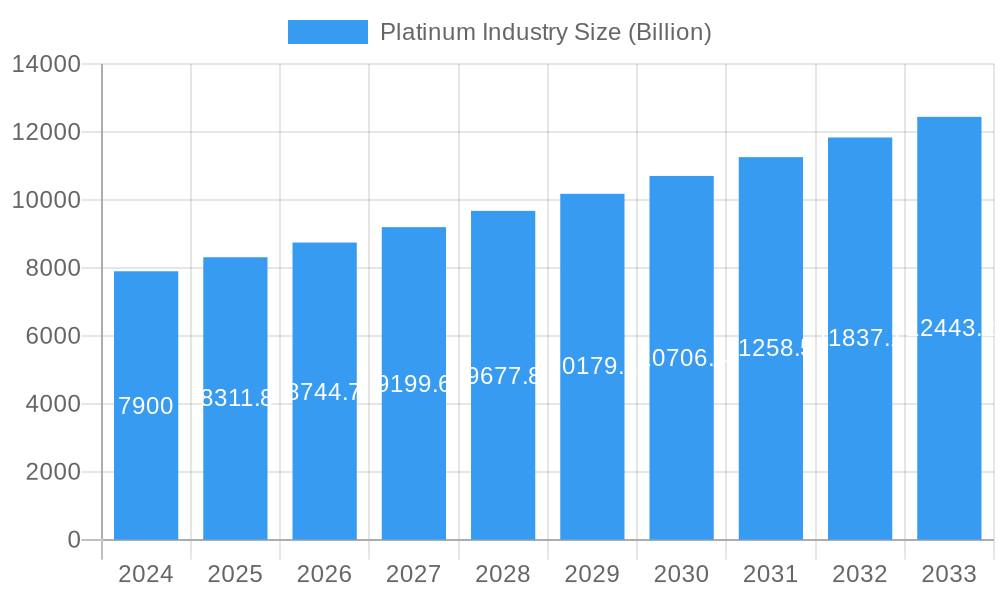
Platinum Industry Market Size (In Million)
While the platinum market demonstrates a positive growth trajectory, potential constraints include price volatility influenced by global supply-demand dynamics and geopolitical factors. The emergence of alternative materials in select applications, particularly catalytic converters, presents a moderate challenge. Nevertheless, platinum's superior performance in core applications, coupled with technological advancements and an increasing focus on sustainable industrial processes, is expected to mitigate these challenges. Market segmentation reveals dominance in Exhaust Systems, Jewelry, and Chemical Catalysts. Geographically, the Asia Pacific region is anticipated to be a primary growth engine due to rapid industrialization and rising consumer incomes, with North America and Europe continuing as significant established markets.
Platinum Industry Company Market Share
Platinum Industry Market Dynamics & Structure
The platinum industry is characterized by a moderately concentrated market structure, driven by the significant capital investment required for mining, refining, and processing. Key players like Impala Platinum Holdings Limited, Anglo American Platinum Limited, and Sibanye-Stillwater dominate upstream production, while companies such as Heraeus Holding, Johnson Matthey, and Umicore lead in downstream applications and recycling. Technological innovation is a critical driver, particularly in catalyst development for automotive and chemical sectors, and in advanced materials for electronics and glass manufacturing. Regulatory frameworks, especially concerning environmental standards and trade policies, significantly influence market accessibility and operational costs.
- Market Concentration: Dominated by a few major mining conglomerates, leading to significant influence over global supply.
- Technological Innovation: Crucial for developing new applications and improving efficiency in existing ones, especially in automotive catalysts.
- Regulatory Frameworks: Environmental regulations (e.g., emissions standards) and trade policies impact production costs and market access.
- Competitive Product Substitutes: While platinum's unique properties are hard to replicate, palladium and rhodium can substitute in some catalytic converter applications, influencing demand.
- End-User Demographics: Automotive industry (catalytic converters) and jewelry sector are major end-users. Growth in emerging economies and stricter emission norms are key demographic influences.
- M&A Trends: Consolidation is a recurring theme, as seen in Impala Platinum's acquisition strategy, aimed at increasing market share and operational synergies.
Platinum Industry Growth Trends & Insights
The global platinum industry is poised for robust growth, projected to reach a market size of approximately $100 billion by 2033, exhibiting a compound annual growth rate (CAGR) of around 4.5% from 2025 to 2033. This expansion is underpinned by a confluence of factors including escalating demand from the automotive sector, driven by increasingly stringent emission control regulations worldwide, and a resurgence in the jewelry market as consumer confidence improves. The base year, 2025, estimates the market at $75 billion, with historical data from 2019-2024 indicating a fluctuating but upward trajectory, influenced by supply-side disruptions and evolving industrial demand.
Technological advancements are playing a pivotal role in shaping market dynamics. The development of more efficient catalytic converters, crucial for reducing harmful emissions from internal combustion engines, continues to be a primary application driving platinum consumption. Furthermore, advancements in fuel cell technology for hydrogen-powered vehicles present a significant future growth avenue for platinum, as it acts as a critical catalyst in these systems. The adoption rates for these technologies are accelerating, particularly in regions with proactive environmental policies and substantial investments in green infrastructure.
Consumer behavior shifts are also contributing to market evolution. While the jewelry sector has historically been a significant demand driver, its growth is increasingly influenced by fashion trends and the ethical sourcing of precious metals. Consumers are becoming more conscious of sustainability and provenance, prompting a greater demand for recycled platinum and ethically mined products. This shift is creating opportunities for companies that can demonstrate transparency and sustainability throughout their supply chains.
Market penetration of platinum in emerging applications, such as advanced chemical processes and specialized electronics, is on an upward trend. The unique catalytic properties of platinum make it indispensable in several chemical synthesis processes, and its use in high-performance electronic components, such as sensors and high-temperature thermocouples, is also growing. The forecast period (2025-2033) anticipates a steady increase in these niche markets, further diversifying the demand base for platinum and mitigating reliance on single-sector fluctuations.
Dominant Regions, Countries, or Segments in Platinum Industry
The dominant region driving growth in the global platinum industry is Asia-Pacific, propelled by its burgeoning automotive manufacturing sector, significant jewelry consumption, and increasing industrial applications. Within this region, China stands out as a pivotal market, not only as a major consumer of platinum for catalytic converters due to its vast vehicle parc and evolving emission standards but also as a growing hub for electronics manufacturing and chemical catalyst production. The parent market, encompassing all platinum applications, sees significant demand here, with child markets such as automotive catalysts and electronics showing particularly strong growth trajectories.
Key Drivers of Dominance in Asia-Pacific:
- Automotive Manufacturing Powerhouse: China, Japan, South Korea, and India are major global automotive producers, directly translating to high demand for platinum-based catalytic converters. Stricter emission regulations, such as China VI, are mandating higher platinum loadings. The market share for automotive exhaust systems in this region is estimated to be over 45% of the global total.
- Expanding Jewelry Market: Asia, particularly China and India, represents a substantial portion of the global jewelry market. Growing disposable incomes, a cultural affinity for precious metals, and evolving fashion trends contribute to sustained demand. The jewelry segment constitutes approximately 25% of the overall platinum market.
- Technological Advancement and Industrialization: The rapid industrialization and technological advancements in Asia-Pacific are fostering growth in other key segments. For instance, the demand for platinum in chemical catalysts for petrochemical refining and other industrial processes is rising. Glass production, utilizing platinum for high-temperature crucibles and bushings, also sees significant demand from the region's expanding manufacturing base.
- Electronics Industry Growth: The robust growth of the electronics sector in countries like China and South Korea drives demand for platinum in specialized components, sputtering targets, and electrodes. This segment, while smaller than automotive, exhibits high growth potential and accounts for roughly 10% of the total market.
- Government Initiatives and Investments: Favorable government policies promoting manufacturing, R&D in clean technologies, and infrastructure development further support the demand for platinum. Investments in hydrogen fuel cell technology in countries like Japan and South Korea also present a future growth catalyst.
The Exhaust Systems application segment is the largest child market within the platinum industry, driven primarily by its critical role in catalytic converters. The global market for exhaust systems is estimated to be worth $35 billion in 2025, with platinum contributing a significant portion due to its superior catalytic properties. The increasing stringency of global emission standards, coupled with the expanding automotive fleet, particularly in emerging economies, ensures a sustained and growing demand for platinum in this segment.
Platinum Industry Product Landscape
The platinum industry's product landscape is defined by its essential role as a catalyst and its inherent value in high-performance applications. Key innovations focus on improving catalyst efficiency and longevity, particularly in automotive exhaust systems where platinum is crucial for converting harmful emissions into less noxious substances. Advancements in refining techniques ensure higher purity, crucial for electronics and glass production. Unique selling propositions include platinum's exceptional resistance to corrosion and high-temperature stability, making it indispensable for specialized chemical processes and advanced materials. Technological progress is also evident in the increasing use of recycled platinum, offering a sustainable and cost-effective alternative for various applications.
Key Drivers, Barriers & Challenges in Platinum Industry
Key Drivers:
- Stringent Environmental Regulations: Global mandates for reduced vehicle emissions are a primary driver, increasing demand for platinum in catalytic converters.
- Growth in Automotive Sector: Expanding vehicle production, especially in emerging economies, directly fuels demand for platinum.
- Technological Advancements: Innovations in fuel cell technology and industrial catalysts create new and expanding applications.
- Jewelry Demand: A consistent, albeit fluctuating, demand from the luxury jewelry sector.
- Recycling Initiatives: Growing emphasis on circular economy principles boosts the supply of recycled platinum.
Key Barriers & Challenges:
- Supply Chain Volatility: Platinum mining is concentrated in a few regions, making it susceptible to geopolitical instability, labor disputes, and operational disruptions.
- Price Volatility: Fluctuations in platinum prices, driven by supply-demand imbalances and speculative trading, can impact investment and end-user purchasing decisions.
- Substitution by Other Precious Metals: In some applications, palladium and rhodium can offer similar catalytic properties, posing a competitive threat.
- High Capital Expenditure: Significant investment is required for exploration, mining, refining, and processing, creating a barrier to entry for new players.
- Environmental and Social Governance (ESG) Concerns: Increasing scrutiny on mining practices and their environmental impact necessitates greater transparency and sustainable operations.
- Economic Downturns: Global economic slowdowns can negatively impact demand from key sectors like automotive and jewelry.
Emerging Opportunities in Platinum Industry
Emerging opportunities lie in the burgeoning hydrogen economy, where platinum is a vital catalyst for both hydrogen production (electrolysis) and its use in fuel cells. Increased government and private sector investment in green hydrogen infrastructure presents a significant growth frontier. Furthermore, advancements in battery technology and sustainable chemical processing offer novel applications for platinum-based catalysts, moving beyond traditional uses. The growing demand for high-purity specialty chemicals and advanced materials in sectors like aerospace and medical devices also presents untapped potential.
Growth Accelerators in the Platinum Industry Industry
The platinum industry's long-term growth is being accelerated by a trifecta of innovation, strategic partnerships, and market expansion. The relentless pursuit of cleaner technologies, particularly in the automotive sector with the advent of hydrogen fuel cells, acts as a significant catalyst. Strategic collaborations between mining companies, refiners, and technology developers are crucial for optimizing supply chains and driving the adoption of new platinum-based solutions. Furthermore, the increasing industrialization and rising disposable incomes in emerging economies are expanding the geographic reach of demand for platinum across all its key applications, from industrial catalysts to high-value jewelry.
Key Players Shaping the Platinum Industry Market
- Heraeus Holding
- Chimet Spa
- Hindustan Platinum
- Heesung Pmtech
- Norilsk Nickel
- Impala Platinum Holdings Limited
- Northam Platinum Holdings Limited
- Nihon Material Co Ltd
- Johnson Matthey
- Sibanye-Stillwater
- Anglo American Platinum Limited
Notable Milestones in Platinum Industry Sector
- April 2022: Impala Platinum Holdings Limited plans to acquire a 100% stake in the South Africa-based platinum manufacturer Royal Bafokeng Platinum, further consolidating its market position.
- February 2022: Heraeus Holding agreed to form a joint venture with BASF SE to recover precious metals, including platinum, from spent automotive catalysts in China, establishing BASF Heraeus Metal Resource Co. Ltd.
In-Depth Platinum Industry Market Outlook
The future outlook for the platinum industry is exceptionally positive, fueled by powerful growth accelerators. The global shift towards sustainable energy solutions, particularly the widespread adoption of hydrogen fuel cell vehicles, promises to be a transformative growth driver, creating substantial demand for platinum catalysts. Strategic partnerships and joint ventures, such as those aimed at enhancing recycling capabilities and developing new applications, will further fortify the market. Moreover, continued industrial expansion and increasing consumer spending power in emerging economies are poised to drive significant market penetration across diverse sectors, including electronics, glass production, and specialized chemicals, solidifying platinum's indispensable role in a greener and technologically advanced future.
Platinum Industry Segmentation
-
1. Application
- 1.1. Exhaust Systems
- 1.2. Jewelry
- 1.3. Chemical Catalysts
- 1.4. Glass Production
- 1.5. Electronics
- 1.6. Other Applications
Platinum Industry Segmentation By Geography
-
1. Asia Pacific
- 1.1. China
- 1.2. India
- 1.3. Japan
- 1.4. South Korea
- 1.5. Rest of Asia Pacific
-
2. North America
- 2.1. United States
- 2.2. Canada
- 2.3. Mexico
-
3. Europe
- 3.1. Germany
- 3.2. United Kingdom
- 3.3. Italy
- 3.4. France
- 3.5. Rest of Europe
-
4. Rest Of The World
- 4.1. South America
- 4.2. Middle East and Africa
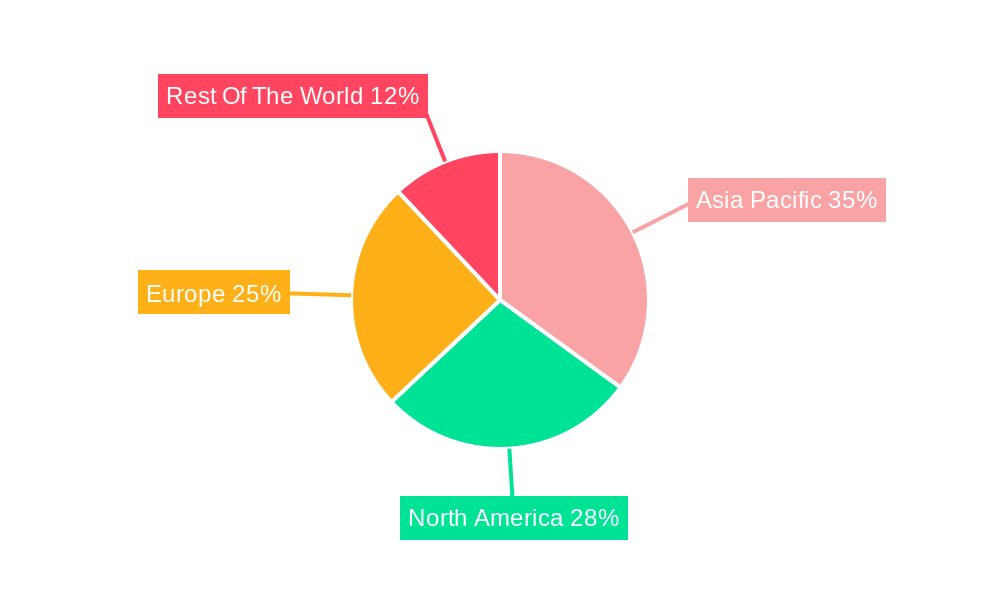
Platinum Industry Regional Market Share
Geographic Coverage of Platinum Industry
Platinum Industry REPORT HIGHLIGHTS
| Aspects | Details |
|---|---|
| Study Period | 2020-2034 |
| Base Year | 2025 |
| Estimated Year | 2026 |
| Forecast Period | 2026-2034 |
| Historical Period | 2020-2025 |
| Growth Rate | CAGR of 4.52% from 2020-2034 |
| Segmentation |
|
Table of Contents
- 1. Introduction
- 1.1. Research Scope
- 1.2. Market Segmentation
- 1.3. Research Objective
- 1.4. Definitions and Assumptions
- 2. Executive Summary
- 2.1. Market Snapshot
- 3. Market Dynamics
- 3.1. Market Drivers
- 3.2. Market Restrains
- 3.3. Market Trends
- 3.4. Market Opportunities
- 4. Market Factor Analysis
- 4.1. Porters Five Forces
- 4.1.1. Bargaining Power of Suppliers
- 4.1.2. Bargaining Power of Buyers
- 4.1.3. Threat of New Entrants
- 4.1.4. Threat of Substitutes
- 4.1.5. Competitive Rivalry
- 4.2. PESTEL analysis
- 4.3. BCG Analysis
- 4.3.1. Stars (High Growth, High Market Share)
- 4.3.2. Cash Cows (Low Growth, High Market Share)
- 4.3.3. Question Mark (High Growth, Low Market Share)
- 4.3.4. Dogs (Low Growth, Low Market Share)
- 4.4. Ansoff Matrix Analysis
- 4.5. Supply Chain Analysis
- 4.6. Regulatory Landscape
- 4.7. Current Market Potential and Opportunity Assessment (TAM–SAM–SOM Framework)
- 4.8. NRP Analyst Note
- 4.1. Porters Five Forces
- 5. Market Analysis, Insights and Forecast 2021-2033
- 5.1. Market Analysis, Insights and Forecast - by Application
- 5.1.1. Exhaust Systems
- 5.1.2. Jewelry
- 5.1.3. Chemical Catalysts
- 5.1.4. Glass Production
- 5.1.5. Electronics
- 5.1.6. Other Applications
- 5.2. Market Analysis, Insights and Forecast - by Region
- 5.2.1. Asia Pacific
- 5.2.2. North America
- 5.2.3. Europe
- 5.2.4. Rest Of The World
- 5.1. Market Analysis, Insights and Forecast - by Application
- 6. Global Platinum Industry Analysis, Insights and Forecast, 2021-2033
- 6.1. Market Analysis, Insights and Forecast - by Application
- 6.1.1. Exhaust Systems
- 6.1.2. Jewelry
- 6.1.3. Chemical Catalysts
- 6.1.4. Glass Production
- 6.1.5. Electronics
- 6.1.6. Other Applications
- 6.1. Market Analysis, Insights and Forecast - by Application
- 7. Asia Pacific Platinum Industry Analysis, Insights and Forecast, 2020-2032
- 7.1. Market Analysis, Insights and Forecast - by Application
- 7.1.1. Exhaust Systems
- 7.1.2. Jewelry
- 7.1.3. Chemical Catalysts
- 7.1.4. Glass Production
- 7.1.5. Electronics
- 7.1.6. Other Applications
- 7.1. Market Analysis, Insights and Forecast - by Application
- 8. North America Platinum Industry Analysis, Insights and Forecast, 2020-2032
- 8.1. Market Analysis, Insights and Forecast - by Application
- 8.1.1. Exhaust Systems
- 8.1.2. Jewelry
- 8.1.3. Chemical Catalysts
- 8.1.4. Glass Production
- 8.1.5. Electronics
- 8.1.6. Other Applications
- 8.1. Market Analysis, Insights and Forecast - by Application
- 9. Europe Platinum Industry Analysis, Insights and Forecast, 2020-2032
- 9.1. Market Analysis, Insights and Forecast - by Application
- 9.1.1. Exhaust Systems
- 9.1.2. Jewelry
- 9.1.3. Chemical Catalysts
- 9.1.4. Glass Production
- 9.1.5. Electronics
- 9.1.6. Other Applications
- 9.1. Market Analysis, Insights and Forecast - by Application
- 10. Rest Of The World Platinum Industry Analysis, Insights and Forecast, 2020-2032
- 10.1. Market Analysis, Insights and Forecast - by Application
- 10.1.1. Exhaust Systems
- 10.1.2. Jewelry
- 10.1.3. Chemical Catalysts
- 10.1.4. Glass Production
- 10.1.5. Electronics
- 10.1.6. Other Applications
- 10.1. Market Analysis, Insights and Forecast - by Application
- 11. Competitive Analysis
- 11.1. Company Profiles
- 11.1.1 Heraeus Holding
- 11.1.1.1. Company Overview
- 11.1.1.2. Products
- 11.1.1.3. Company Financials
- 11.1.1.4. SWOT Analysis
- 11.1.2 Chimet Spa
- 11.1.2.1. Company Overview
- 11.1.2.2. Products
- 11.1.2.3. Company Financials
- 11.1.2.4. SWOT Analysis
- 11.1.3 Hindustan Platinum
- 11.1.3.1. Company Overview
- 11.1.3.2. Products
- 11.1.3.3. Company Financials
- 11.1.3.4. SWOT Analysis
- 11.1.4 Heesung Pmtech
- 11.1.4.1. Company Overview
- 11.1.4.2. Products
- 11.1.4.3. Company Financials
- 11.1.4.4. SWOT Analysis
- 11.1.5 Norilsk Nickel
- 11.1.5.1. Company Overview
- 11.1.5.2. Products
- 11.1.5.3. Company Financials
- 11.1.5.4. SWOT Analysis
- 11.1.6 Impala Platinum Holdings Limited
- 11.1.6.1. Company Overview
- 11.1.6.2. Products
- 11.1.6.3. Company Financials
- 11.1.6.4. SWOT Analysis
- 11.1.7 Northam Platinum Holdings Limited
- 11.1.7.1. Company Overview
- 11.1.7.2. Products
- 11.1.7.3. Company Financials
- 11.1.7.4. SWOT Analysis
- 11.1.8 Nihon Material Co Ltd
- 11.1.8.1. Company Overview
- 11.1.8.2. Products
- 11.1.8.3. Company Financials
- 11.1.8.4. SWOT Analysis
- 11.1.9 Johnson Matthey
- 11.1.9.1. Company Overview
- 11.1.9.2. Products
- 11.1.9.3. Company Financials
- 11.1.9.4. SWOT Analysis
- 11.1.10 Sibanye-stillwater
- 11.1.10.1. Company Overview
- 11.1.10.2. Products
- 11.1.10.3. Company Financials
- 11.1.10.4. SWOT Analysis
- 11.1.11 Anglo American Platinum Limited
- 11.1.11.1. Company Overview
- 11.1.11.2. Products
- 11.1.11.3. Company Financials
- 11.1.11.4. SWOT Analysis
- 11.1.1 Heraeus Holding
- 11.2. Market Entropy
- 11.2.1 Company's Key Areas Served
- 11.2.2 Recent Developments
- 11.3. Company Market Share Analysis 2025
- 11.3.1 Top 5 Companies Market Share Analysis
- 11.3.2 Top 3 Companies Market Share Analysis
- 11.4. List of Potential Customers
- 12. Research Methodology
List of Figures
- Figure 1: Global Platinum Industry Revenue Breakdown (million, %) by Region 2025 & 2033
- Figure 2: Global Platinum Industry Volume Breakdown (K Tons, %) by Region 2025 & 2033
- Figure 3: Asia Pacific Platinum Industry Revenue (million), by Application 2025 & 2033
- Figure 4: Asia Pacific Platinum Industry Volume (K Tons), by Application 2025 & 2033
- Figure 5: Asia Pacific Platinum Industry Revenue Share (%), by Application 2025 & 2033
- Figure 6: Asia Pacific Platinum Industry Volume Share (%), by Application 2025 & 2033
- Figure 7: Asia Pacific Platinum Industry Revenue (million), by Country 2025 & 2033
- Figure 8: Asia Pacific Platinum Industry Volume (K Tons), by Country 2025 & 2033
- Figure 9: Asia Pacific Platinum Industry Revenue Share (%), by Country 2025 & 2033
- Figure 10: Asia Pacific Platinum Industry Volume Share (%), by Country 2025 & 2033
- Figure 11: North America Platinum Industry Revenue (million), by Application 2025 & 2033
- Figure 12: North America Platinum Industry Volume (K Tons), by Application 2025 & 2033
- Figure 13: North America Platinum Industry Revenue Share (%), by Application 2025 & 2033
- Figure 14: North America Platinum Industry Volume Share (%), by Application 2025 & 2033
- Figure 15: North America Platinum Industry Revenue (million), by Country 2025 & 2033
- Figure 16: North America Platinum Industry Volume (K Tons), by Country 2025 & 2033
- Figure 17: North America Platinum Industry Revenue Share (%), by Country 2025 & 2033
- Figure 18: North America Platinum Industry Volume Share (%), by Country 2025 & 2033
- Figure 19: Europe Platinum Industry Revenue (million), by Application 2025 & 2033
- Figure 20: Europe Platinum Industry Volume (K Tons), by Application 2025 & 2033
- Figure 21: Europe Platinum Industry Revenue Share (%), by Application 2025 & 2033
- Figure 22: Europe Platinum Industry Volume Share (%), by Application 2025 & 2033
- Figure 23: Europe Platinum Industry Revenue (million), by Country 2025 & 2033
- Figure 24: Europe Platinum Industry Volume (K Tons), by Country 2025 & 2033
- Figure 25: Europe Platinum Industry Revenue Share (%), by Country 2025 & 2033
- Figure 26: Europe Platinum Industry Volume Share (%), by Country 2025 & 2033
- Figure 27: Rest Of The World Platinum Industry Revenue (million), by Application 2025 & 2033
- Figure 28: Rest Of The World Platinum Industry Volume (K Tons), by Application 2025 & 2033
- Figure 29: Rest Of The World Platinum Industry Revenue Share (%), by Application 2025 & 2033
- Figure 30: Rest Of The World Platinum Industry Volume Share (%), by Application 2025 & 2033
- Figure 31: Rest Of The World Platinum Industry Revenue (million), by Country 2025 & 2033
- Figure 32: Rest Of The World Platinum Industry Volume (K Tons), by Country 2025 & 2033
- Figure 33: Rest Of The World Platinum Industry Revenue Share (%), by Country 2025 & 2033
- Figure 34: Rest Of The World Platinum Industry Volume Share (%), by Country 2025 & 2033
List of Tables
- Table 1: Global Platinum Industry Revenue million Forecast, by Application 2020 & 2033
- Table 2: Global Platinum Industry Volume K Tons Forecast, by Application 2020 & 2033
- Table 3: Global Platinum Industry Revenue million Forecast, by Region 2020 & 2033
- Table 4: Global Platinum Industry Volume K Tons Forecast, by Region 2020 & 2033
- Table 5: Global Platinum Industry Revenue million Forecast, by Application 2020 & 2033
- Table 6: Global Platinum Industry Volume K Tons Forecast, by Application 2020 & 2033
- Table 7: Global Platinum Industry Revenue million Forecast, by Country 2020 & 2033
- Table 8: Global Platinum Industry Volume K Tons Forecast, by Country 2020 & 2033
- Table 9: China Platinum Industry Revenue (million) Forecast, by Application 2020 & 2033
- Table 10: China Platinum Industry Volume (K Tons) Forecast, by Application 2020 & 2033
- Table 11: India Platinum Industry Revenue (million) Forecast, by Application 2020 & 2033
- Table 12: India Platinum Industry Volume (K Tons) Forecast, by Application 2020 & 2033
- Table 13: Japan Platinum Industry Revenue (million) Forecast, by Application 2020 & 2033
- Table 14: Japan Platinum Industry Volume (K Tons) Forecast, by Application 2020 & 2033
- Table 15: South Korea Platinum Industry Revenue (million) Forecast, by Application 2020 & 2033
- Table 16: South Korea Platinum Industry Volume (K Tons) Forecast, by Application 2020 & 2033
- Table 17: Rest of Asia Pacific Platinum Industry Revenue (million) Forecast, by Application 2020 & 2033
- Table 18: Rest of Asia Pacific Platinum Industry Volume (K Tons) Forecast, by Application 2020 & 2033
- Table 19: Global Platinum Industry Revenue million Forecast, by Application 2020 & 2033
- Table 20: Global Platinum Industry Volume K Tons Forecast, by Application 2020 & 2033
- Table 21: Global Platinum Industry Revenue million Forecast, by Country 2020 & 2033
- Table 22: Global Platinum Industry Volume K Tons Forecast, by Country 2020 & 2033
- Table 23: United States Platinum Industry Revenue (million) Forecast, by Application 2020 & 2033
- Table 24: United States Platinum Industry Volume (K Tons) Forecast, by Application 2020 & 2033
- Table 25: Canada Platinum Industry Revenue (million) Forecast, by Application 2020 & 2033
- Table 26: Canada Platinum Industry Volume (K Tons) Forecast, by Application 2020 & 2033
- Table 27: Mexico Platinum Industry Revenue (million) Forecast, by Application 2020 & 2033
- Table 28: Mexico Platinum Industry Volume (K Tons) Forecast, by Application 2020 & 2033
- Table 29: Global Platinum Industry Revenue million Forecast, by Application 2020 & 2033
- Table 30: Global Platinum Industry Volume K Tons Forecast, by Application 2020 & 2033
- Table 31: Global Platinum Industry Revenue million Forecast, by Country 2020 & 2033
- Table 32: Global Platinum Industry Volume K Tons Forecast, by Country 2020 & 2033
- Table 33: Germany Platinum Industry Revenue (million) Forecast, by Application 2020 & 2033
- Table 34: Germany Platinum Industry Volume (K Tons) Forecast, by Application 2020 & 2033
- Table 35: United Kingdom Platinum Industry Revenue (million) Forecast, by Application 2020 & 2033
- Table 36: United Kingdom Platinum Industry Volume (K Tons) Forecast, by Application 2020 & 2033
- Table 37: Italy Platinum Industry Revenue (million) Forecast, by Application 2020 & 2033
- Table 38: Italy Platinum Industry Volume (K Tons) Forecast, by Application 2020 & 2033
- Table 39: France Platinum Industry Revenue (million) Forecast, by Application 2020 & 2033
- Table 40: France Platinum Industry Volume (K Tons) Forecast, by Application 2020 & 2033
- Table 41: Rest of Europe Platinum Industry Revenue (million) Forecast, by Application 2020 & 2033
- Table 42: Rest of Europe Platinum Industry Volume (K Tons) Forecast, by Application 2020 & 2033
- Table 43: Global Platinum Industry Revenue million Forecast, by Application 2020 & 2033
- Table 44: Global Platinum Industry Volume K Tons Forecast, by Application 2020 & 2033
- Table 45: Global Platinum Industry Revenue million Forecast, by Country 2020 & 2033
- Table 46: Global Platinum Industry Volume K Tons Forecast, by Country 2020 & 2033
- Table 47: South America Platinum Industry Revenue (million) Forecast, by Application 2020 & 2033
- Table 48: South America Platinum Industry Volume (K Tons) Forecast, by Application 2020 & 2033
- Table 49: Middle East and Africa Platinum Industry Revenue (million) Forecast, by Application 2020 & 2033
- Table 50: Middle East and Africa Platinum Industry Volume (K Tons) Forecast, by Application 2020 & 2033
Frequently Asked Questions
1. What is the projected Compound Annual Growth Rate (CAGR) of the Platinum Industry?
The projected CAGR is approximately 4.52%.
2. Which companies are prominent players in the Platinum Industry?
Key companies in the market include Heraeus Holding, Chimet Spa, Hindustan Platinum, Heesung Pmtech, Norilsk Nickel, Impala Platinum Holdings Limited, Northam Platinum Holdings Limited, Nihon Material Co Ltd, Johnson Matthey, Sibanye-stillwater, Anglo American Platinum Limited.
3. What are the main segments of the Platinum Industry?
The market segments include Application.
4. Can you provide details about the market size?
The market size is estimated to be USD 8.51 million as of 2022.
5. What are some drivers contributing to market growth?
Increasing Usage in the Industrial Applications; Growing Demand for Applications in the Automotive Industry.
6. What are the notable trends driving market growth?
Growing Demand for Exhaust Systems in Automobile Industry.
7. Are there any restraints impacting market growth?
High Product Prices.
8. Can you provide examples of recent developments in the market?
April 2022: Impala Platinum Holdings Limited plans to acquire a 100% stake in the South Africa-based platinum manufacturer Royal Bafokeng Platinum. It already owns 35.3% of the shares of Royal Bafokeng Platinum. The 100% acquisition will pave the way for creating one of the biggest platinum metal miners worldwide. It will also help Impala consolidate its market position.
9. What pricing options are available for accessing the report?
Pricing options include single-user, multi-user, and enterprise licenses priced at USD 4750, USD 5250, and USD 8750 respectively.
10. Is the market size provided in terms of value or volume?
The market size is provided in terms of value, measured in million and volume, measured in K Tons.
11. Are there any specific market keywords associated with the report?
Yes, the market keyword associated with the report is "Platinum Industry," which aids in identifying and referencing the specific market segment covered.
12. How do I determine which pricing option suits my needs best?
The pricing options vary based on user requirements and access needs. Individual users may opt for single-user licenses, while businesses requiring broader access may choose multi-user or enterprise licenses for cost-effective access to the report.
13. Are there any additional resources or data provided in the Platinum Industry report?
While the report offers comprehensive insights, it's advisable to review the specific contents or supplementary materials provided to ascertain if additional resources or data are available.
14. How can I stay updated on further developments or reports in the Platinum Industry?
To stay informed about further developments, trends, and reports in the Platinum Industry, consider subscribing to industry newsletters, following relevant companies and organizations, or regularly checking reputable industry news sources and publications.
Methodology
Step 1 - Identification of Relevant Samples Size from Population Database


Step 2 - Approaches for Defining Global Market Size (Value, Volume* & Price*)

Note*: In applicable scenarios
Step 3 - Data Sources
Primary Research
- Web Analytics
- Survey Reports
- Research Institute
- Latest Research Reports
- Opinion Leaders
Secondary Research
- Annual Reports
- White Paper
- Latest Press Release
- Industry Association
- Paid Database
- Investor Presentations

Step 4 - Data Triangulation
Involves using different sources of information in order to increase the validity of a study
These sources are likely to be stakeholders in a program - participants, other researchers, program staff, other community members, and so on.
Then we put all data in single framework & apply various statistical tools to find out the dynamic on the market.
During the analysis stage, feedback from the stakeholder groups would be compared to determine areas of agreement as well as areas of divergence