

Key Insights
The global silica sand market is set for substantial growth, projected to reach an estimated size of $25.4 billion by 2025. Driven by a strong Compound Annual Growth Rate (CAGR) of 4.7% from 2025-2033, this expansion is fueled by escalating demand across diverse industries. Key growth drivers include the robust construction sector, propelled by urbanization and infrastructure development, especially in emerging economies. The foundry industry's consistent need for high-purity silica sand for metal casting, alongside the paints and coatings sector's use of silica as a functional filler and extender, are significant contributors. Furthermore, increased utilization in advanced filtration systems and oil and gas hydraulic fracturing operations presents substantial market opportunities.
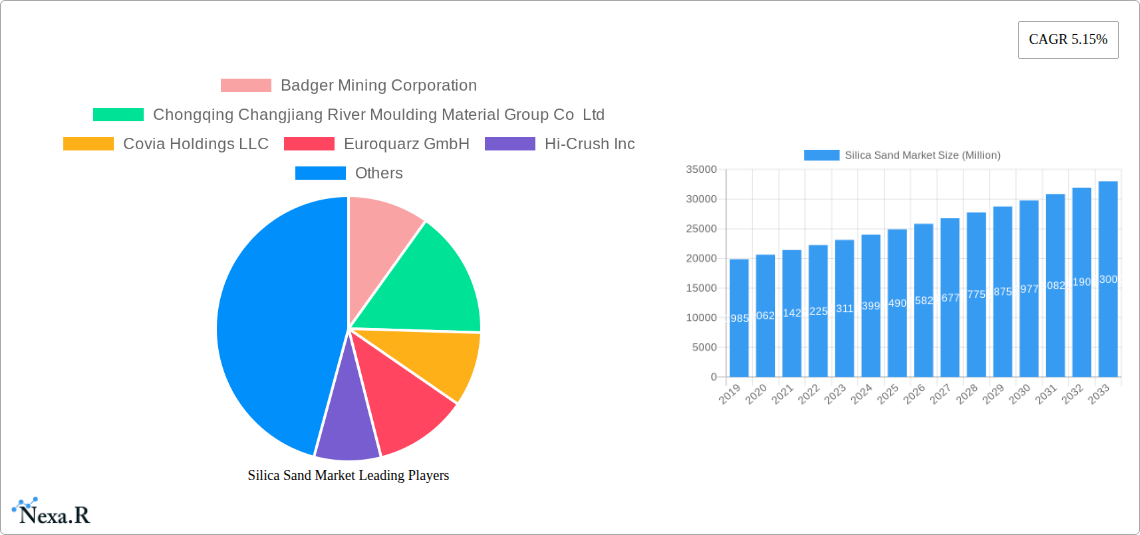
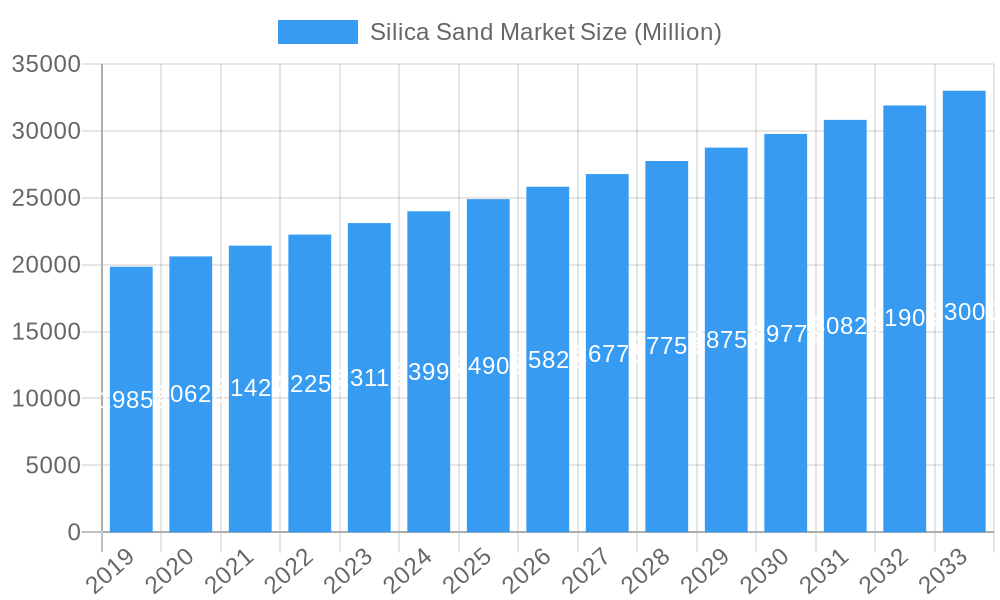
Silica Sand Market Market Size (In Billion)
While the outlook is positive, environmental regulations governing mining and sand extraction may impact supply chains and increase operational costs. Fluctuations in raw material and energy prices, coupled with transportation logistics for bulk silica sand, also pose potential challenges. However, trends such as the growing adoption of sustainable mining practices and the development of innovative silica-based products with enhanced properties are expected to offset these restraints. Technological advancements in sand processing and purification are leading to higher quality silica sand for specialized applications. The Asia Pacific region, particularly China and India, is anticipated to lead the market due to rapid industrialization and infrastructure projects. North America and Europe will remain key markets, supported by established industries and technological innovation.
Silica Sand Market Company Market Share
This comprehensive report offers a detailed analysis of the global silica sand market, examining its dynamics, growth trends, and future potential. Covering the period from 2019 to 2033, with a base year of 2025 and a forecast period of 2025–2033, this report is an essential resource for industry professionals, investors, and strategists. It analyzes the parent and child markets, providing precise insights into market size evolution, segmentation, regional dominance, and competitive landscapes.
Leveraging advanced analytical frameworks and extensive data, this report delivers actionable intelligence on key search terms such as "silica sand applications," "industrial sand market," "frac sand market," "glass manufacturing sand," and "construction silica." It provides quantitative valuations for market size and growth rates, enabling a clear understanding of the present and future economic significance of this vital industrial commodity.
Silica Sand Market Market Dynamics & Structure
The global silica sand market exhibits a moderately concentrated structure, with key players like Sibelco, U S Silica, and Covia Holdings LLC holding significant market shares. Technological innovation remains a crucial driver, particularly in developing high-purity silica sands for advanced applications and optimizing extraction and processing techniques for increased efficiency and reduced environmental impact. Regulatory frameworks, primarily concerning environmental protection, mining practices, and product quality standards, play a pivotal role in shaping market entry and operational strategies. Competitive product substitutes, while limited for specific high-grade applications, include alternative materials in certain construction and industrial processes. End-user demographics are evolving, with increasing demand from burgeoning economies and the growth of sectors like renewable energy (solar panel manufacturing) and advanced electronics. Mergers and acquisitions (M&A) are a notable trend, driven by the pursuit of vertical integration, market consolidation, and access to premium silica deposits. For instance, the acquisition volume in the past two years indicates a strategic consolidation phase, aiming to enhance supply chain control and expand geographical reach. Barriers to innovation include the capital-intensive nature of mining and processing technologies and the geological dependency on high-quality reserves.
Silica Sand Market Growth Trends & Insights
The silica sand market is poised for robust growth, driven by an increasing global demand across diverse end-user industries. The market size is projected to expand significantly, reaching an estimated XX Million units by 2033, with a projected Compound Annual Growth Rate (CAGR) of approximately X.XX% during the forecast period. This expansion is fueled by several factors, including the persistent demand from the glass manufacturing segment, which accounts for a substantial portion of the market due to the ubiquitous use of glass in construction, automotive, and consumer goods. The construction sector also represents a major growth driver, with silica sand being a fundamental component in concrete, mortar, and asphalt. Furthermore, the burgeoning oil and gas industry, particularly the shale gas extraction requiring vast quantities of frac sand, contributes significantly to market expansion.
Technological disruptions are also influencing market dynamics. Advancements in sand processing technologies are enabling the production of higher-purity silica sand, opening up new applications in electronics and advanced materials. The adoption rates for specialized silica sands in high-tech industries are steadily increasing. Consumer behavior shifts, such as a growing preference for sustainable construction materials and energy-efficient products, indirectly boost the demand for high-quality silica sand used in their manufacturing. For example, the development of energy-efficient windows for buildings directly translates into increased demand for specialized silica sand for glass production. Market penetration of advanced silica-based materials is expected to rise, especially in emerging economies undergoing rapid industrialization and infrastructure development.
Dominant Regions, Countries, or Segments in Silica Sand Market
The Glass Manufacturing segment is currently the dominant force driving growth within the global silica sand market. This dominance is underpinned by the insatiable global demand for glass products across various applications, including architectural glass, automotive glass, packaging, and consumer electronics. The sheer volume and consistency of requirement from this sector make it the primary market driver.
- Glass Manufacturing:
- Key Drivers: Growing urbanization and infrastructure development worldwide, leading to increased demand for construction materials like windows and facades. The automotive industry's expansion, necessitating significant glass production for vehicles. Rising consumer demand for electronics and household goods that utilize glass components.
- Market Share: Estimated to hold approximately XX% of the total silica sand market value in the forecast period.
- Growth Potential: Continuous innovation in glass technologies, such as energy-efficient coatings and specialized glass for renewable energy applications (e.g., solar panels), will further fuel demand.
While Glass Manufacturing leads, other segments are crucial contributors:
Construction:
- Key Drivers: Global infrastructure projects, residential and commercial building activities, and the use of silica sand in concrete, asphalt, and flooring solutions.
- Market Share: Expected to hold XX% of the market.
- Growth Potential: Government initiatives for infrastructure development in developing nations will significantly boost this segment.
Oil and Gas:
- Key Drivers: Hydraulic fracturing operations in shale gas reserves, requiring substantial volumes of frac sand.
- Market Share: Significant, especially in regions with active shale gas exploration.
- Growth Potential: Fluctuates with oil and gas prices and regulatory policies.
Foundry:
- Key Drivers: Metal casting processes for automotive, industrial machinery, and aerospace components.
- Market Share: Consistent demand due to industrial manufacturing activities.
- Growth Potential: Tied to the health of manufacturing sectors globally.
Emerging economies in Asia Pacific, particularly China and India, are pivotal in driving the growth of these segments due to rapid industrialization and large-scale infrastructure projects. North America remains a significant consumer, especially driven by the oil and gas sector.
Silica Sand Market Product Landscape
The silica sand market is characterized by a diverse product landscape, catering to a wide array of industrial applications. Key product innovations focus on enhancing purity, optimizing grain size distribution, and improving surface treatments for specialized functionalities. High-purity silica sands, often exceeding 99.5% SiO2, are crucial for advanced applications like solar panel manufacturing, specialty glass, and electronic components. The development of precisely graded silica sands ensures optimal performance in filtration systems and foundry molds. Performance metrics such as chemical inertness, thermal stability, and abrasive resistance are paramount. Unique selling propositions often lie in the ability to supply consistent quality, customized particle sizes, and environmentally responsible processing.
Key Drivers, Barriers & Challenges in Silica Sand Market
Key Drivers: The silica sand market is propelled by several interconnected factors. Robust global demand from the glass manufacturing sector, fueled by construction and automotive industries, is a primary driver. The construction industry's continuous need for aggregates and fillers further bolsters demand. The oil and gas industry's requirement for frac sand in hydraulic fracturing operations remains a significant growth catalyst. Technological advancements in processing that yield higher purity silica sand unlock new, high-value applications in electronics and advanced materials. Economic growth in emerging markets, leading to increased industrialization and infrastructure development, directly translates to higher silica sand consumption.
Barriers & Challenges: Despite strong growth, the market faces several challenges. Supply chain disruptions, including transportation logistics and availability of suitable reserves, can impact market stability. Stringent environmental regulations and permitting processes for mining operations can increase operational costs and limit new project developments. Geographical limitations to high-quality silica sand deposits and the associated extraction costs create regional supply-demand imbalances. Price volatility in commodities, particularly oil and gas, can indirectly affect demand from the frac sand segment. Intense competition among suppliers, especially for standard grades, can put pressure on profit margins.
Emerging Opportunities in Silica Sand Market
Emerging opportunities within the silica sand market lie in several promising avenues. The growing demand for high-purity silica sands in the renewable energy sector, particularly for solar panel manufacturing and battery technologies, presents a significant growth area. Innovations in specialty glass for advanced applications, such as high-performance optics and displays, will also drive demand for tailored silica products. The increasing focus on sustainable construction practices is creating opportunities for silica sand in eco-friendly building materials and composites. Furthermore, the development of advanced filtration technologies for water purification and industrial processes offers a niche but growing market. Untapped geographical markets, especially in developing regions with expanding industrial bases, represent substantial growth potential for silica sand suppliers.
Growth Accelerators in the Silica Sand Market Industry
Several catalysts are accelerating long-term growth in the silica sand market industry. Technological breakthroughs in advanced processing techniques, such as magnetic separation and advanced flotation, are enabling the extraction and purification of higher-grade silica sands, thereby expanding their application scope. Strategic partnerships between mining companies and end-users are fostering innovation and ensuring a stable supply of tailored products. Market expansion strategies, including vertical integration and global outreach, are enabling key players to secure new reserves and serve a broader customer base. The increasing global emphasis on infrastructure development and urbanization, particularly in emerging economies, serves as a consistent and powerful growth accelerator, driving demand across construction, glass, and other industrial applications.
Key Players Shaping the Silica Sand Market Market
- Badger Mining Corporation
- Chongqing Changjiang River Moulding Material Group Co Ltd
- Covia Holdings LLC
- Euroquarz GmbH
- Hi-Crush Inc
- JFE Mineral & Alloy Company Ltd
- Mitsubishi Corporation
- PUM GROUP
- Sibelco
- Sil Industrial Minerals
- Source Energy Services
- Superior Silica Sands
- Tochu Corporation
- U S Silica
Notable Milestones in Silica Sand Market Sector
- July 2022: Sibelco acquired EchasaSA, a mining company that mines silica sand from the Laminoria quarry near Vitoria in the Basque Country in northern Spain, 160 kilometers from Sibelco's nearest silica sand quarry in Ariya. This acquisition strengthened Sibelco's European supply chain and expanded its operational footprint.
- April 2022: Source Energy Services entered into an agreement with Canadian Silica Industries Inc. and Contractor's Leasing Corp. This led to the conclusion of operations at its Peace River frac sand facility and an increase in frac sand production by an additional 400,000 metric tons, significantly boosting the company's business and market presence.
In-Depth Silica Sand Market Market Outlook
The future outlook for the silica sand market is exceptionally promising, driven by a confluence of sustained demand and emerging opportunities. The continuous growth in the glass manufacturing and construction sectors, propelled by global urbanization and infrastructure development, will remain a cornerstone of market expansion. The increasing adoption of silica sand in renewable energy applications, such as solar panels, and in advanced electronics, signals a shift towards higher-value markets. Strategic investments in advanced processing technologies are expected to unlock new applications and improve the efficiency of existing ones. The focus on sustainable sourcing and responsible mining practices will also shape the market, favoring companies with strong environmental, social, and governance (ESG) credentials. Overall, the market is poised for robust, long-term growth, offering significant opportunities for innovation and strategic expansion.
Silica Sand Market Segmentation
-
1. End-user Industry
- 1.1. Glass Manufacturing
- 1.2. Foundry
- 1.3. Chemical Production
- 1.4. Construction
- 1.5. Paints and Coatings
- 1.6. Ceramics and Refractories
- 1.7. Filtration
- 1.8. Oil and Gas
- 1.9. Other End-user Industries
Silica Sand Market Segmentation By Geography
-
1. Asia Pacific
- 1.1. China
- 1.2. India
- 1.3. Japan
- 1.4. South Korea
- 1.5. Rest of Asia Pacific
-
2. North America
- 2.1. United States
- 2.2. Canada
- 2.3. Mexico
-
3. Europe
- 3.1. Germany
- 3.2. United Kingdom
- 3.3. Italy
- 3.4. France
- 3.5. Rest of Europe
-
4. South America
- 4.1. Brazil
- 4.2. Argentina
- 4.3. Rest of South America
-
5. Middle East and Africa
- 5.1. Saudi Arabia
- 5.2. South Africa
- 5.3. Rest of Middle East and Africa
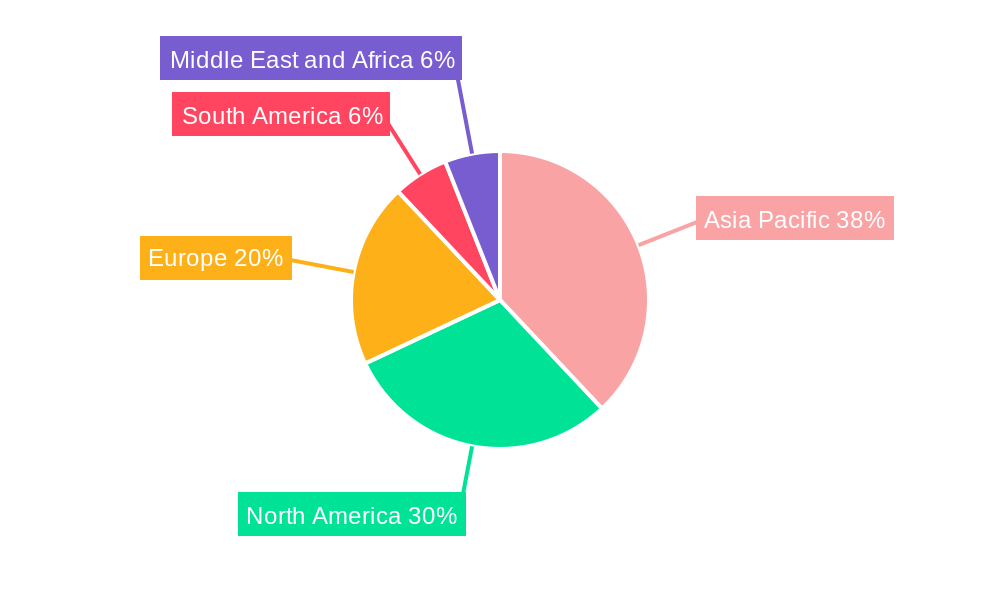
Silica Sand Market Regional Market Share
Geographic Coverage of Silica Sand Market
Silica Sand Market REPORT HIGHLIGHTS
| Aspects | Details |
|---|---|
| Study Period | 2020-2034 |
| Base Year | 2025 |
| Estimated Year | 2026 |
| Forecast Period | 2026-2034 |
| Historical Period | 2020-2025 |
| Growth Rate | CAGR of 4.7% from 2020-2034 |
| Segmentation |
|
Table of Contents
- 1. Introduction
- 1.1. Research Scope
- 1.2. Market Segmentation
- 1.3. Research Objective
- 1.4. Definitions and Assumptions
- 2. Executive Summary
- 2.1. Market Snapshot
- 3. Market Dynamics
- 3.1. Market Drivers
- 3.2. Market Restrains
- 3.3. Market Trends
- 3.4. Market Opportunities
- 4. Market Factor Analysis
- 4.1. Porters Five Forces
- 4.1.1. Bargaining Power of Suppliers
- 4.1.2. Bargaining Power of Buyers
- 4.1.3. Threat of New Entrants
- 4.1.4. Threat of Substitutes
- 4.1.5. Competitive Rivalry
- 4.2. PESTEL analysis
- 4.3. BCG Analysis
- 4.3.1. Stars (High Growth, High Market Share)
- 4.3.2. Cash Cows (Low Growth, High Market Share)
- 4.3.3. Question Mark (High Growth, Low Market Share)
- 4.3.4. Dogs (Low Growth, Low Market Share)
- 4.4. Ansoff Matrix Analysis
- 4.5. Supply Chain Analysis
- 4.6. Regulatory Landscape
- 4.7. Current Market Potential and Opportunity Assessment (TAM–SAM–SOM Framework)
- 4.8. NRP Analyst Note
- 4.1. Porters Five Forces
- 5. Market Analysis, Insights and Forecast 2021-2033
- 5.1. Market Analysis, Insights and Forecast - by End-user Industry
- 5.1.1. Glass Manufacturing
- 5.1.2. Foundry
- 5.1.3. Chemical Production
- 5.1.4. Construction
- 5.1.5. Paints and Coatings
- 5.1.6. Ceramics and Refractories
- 5.1.7. Filtration
- 5.1.8. Oil and Gas
- 5.1.9. Other End-user Industries
- 5.2. Market Analysis, Insights and Forecast - by Region
- 5.2.1. Asia Pacific
- 5.2.2. North America
- 5.2.3. Europe
- 5.2.4. South America
- 5.2.5. Middle East and Africa
- 5.1. Market Analysis, Insights and Forecast - by End-user Industry
- 6. Global Silica Sand Market Analysis, Insights and Forecast, 2021-2033
- 6.1. Market Analysis, Insights and Forecast - by End-user Industry
- 6.1.1. Glass Manufacturing
- 6.1.2. Foundry
- 6.1.3. Chemical Production
- 6.1.4. Construction
- 6.1.5. Paints and Coatings
- 6.1.6. Ceramics and Refractories
- 6.1.7. Filtration
- 6.1.8. Oil and Gas
- 6.1.9. Other End-user Industries
- 6.1. Market Analysis, Insights and Forecast - by End-user Industry
- 7. Asia Pacific Silica Sand Market Analysis, Insights and Forecast, 2020-2032
- 7.1. Market Analysis, Insights and Forecast - by End-user Industry
- 7.1.1. Glass Manufacturing
- 7.1.2. Foundry
- 7.1.3. Chemical Production
- 7.1.4. Construction
- 7.1.5. Paints and Coatings
- 7.1.6. Ceramics and Refractories
- 7.1.7. Filtration
- 7.1.8. Oil and Gas
- 7.1.9. Other End-user Industries
- 7.1. Market Analysis, Insights and Forecast - by End-user Industry
- 8. North America Silica Sand Market Analysis, Insights and Forecast, 2020-2032
- 8.1. Market Analysis, Insights and Forecast - by End-user Industry
- 8.1.1. Glass Manufacturing
- 8.1.2. Foundry
- 8.1.3. Chemical Production
- 8.1.4. Construction
- 8.1.5. Paints and Coatings
- 8.1.6. Ceramics and Refractories
- 8.1.7. Filtration
- 8.1.8. Oil and Gas
- 8.1.9. Other End-user Industries
- 8.1. Market Analysis, Insights and Forecast - by End-user Industry
- 9. Europe Silica Sand Market Analysis, Insights and Forecast, 2020-2032
- 9.1. Market Analysis, Insights and Forecast - by End-user Industry
- 9.1.1. Glass Manufacturing
- 9.1.2. Foundry
- 9.1.3. Chemical Production
- 9.1.4. Construction
- 9.1.5. Paints and Coatings
- 9.1.6. Ceramics and Refractories
- 9.1.7. Filtration
- 9.1.8. Oil and Gas
- 9.1.9. Other End-user Industries
- 9.1. Market Analysis, Insights and Forecast - by End-user Industry
- 10. South America Silica Sand Market Analysis, Insights and Forecast, 2020-2032
- 10.1. Market Analysis, Insights and Forecast - by End-user Industry
- 10.1.1. Glass Manufacturing
- 10.1.2. Foundry
- 10.1.3. Chemical Production
- 10.1.4. Construction
- 10.1.5. Paints and Coatings
- 10.1.6. Ceramics and Refractories
- 10.1.7. Filtration
- 10.1.8. Oil and Gas
- 10.1.9. Other End-user Industries
- 10.1. Market Analysis, Insights and Forecast - by End-user Industry
- 11. Middle East and Africa Silica Sand Market Analysis, Insights and Forecast, 2020-2032
- 11.1. Market Analysis, Insights and Forecast - by End-user Industry
- 11.1.1. Glass Manufacturing
- 11.1.2. Foundry
- 11.1.3. Chemical Production
- 11.1.4. Construction
- 11.1.5. Paints and Coatings
- 11.1.6. Ceramics and Refractories
- 11.1.7. Filtration
- 11.1.8. Oil and Gas
- 11.1.9. Other End-user Industries
- 11.1. Market Analysis, Insights and Forecast - by End-user Industry
- 12. Competitive Analysis
- 12.1. Company Profiles
- 12.1.1 Badger Mining Corporation
- 12.1.1.1. Company Overview
- 12.1.1.2. Products
- 12.1.1.3. Company Financials
- 12.1.1.4. SWOT Analysis
- 12.1.2 Chongqing Changjiang River Moulding Material Group Co Ltd
- 12.1.2.1. Company Overview
- 12.1.2.2. Products
- 12.1.2.3. Company Financials
- 12.1.2.4. SWOT Analysis
- 12.1.3 Covia Holdings LLC
- 12.1.3.1. Company Overview
- 12.1.3.2. Products
- 12.1.3.3. Company Financials
- 12.1.3.4. SWOT Analysis
- 12.1.4 Euroquarz GmbH
- 12.1.4.1. Company Overview
- 12.1.4.2. Products
- 12.1.4.3. Company Financials
- 12.1.4.4. SWOT Analysis
- 12.1.5 Hi-Crush Inc
- 12.1.5.1. Company Overview
- 12.1.5.2. Products
- 12.1.5.3. Company Financials
- 12.1.5.4. SWOT Analysis
- 12.1.6 JFE Mineral & Alloy Company Ltd
- 12.1.6.1. Company Overview
- 12.1.6.2. Products
- 12.1.6.3. Company Financials
- 12.1.6.4. SWOT Analysis
- 12.1.7 Mitsubishi Corporation
- 12.1.7.1. Company Overview
- 12.1.7.2. Products
- 12.1.7.3. Company Financials
- 12.1.7.4. SWOT Analysis
- 12.1.8 PUM GROUP
- 12.1.8.1. Company Overview
- 12.1.8.2. Products
- 12.1.8.3. Company Financials
- 12.1.8.4. SWOT Analysis
- 12.1.9 Sibelco
- 12.1.9.1. Company Overview
- 12.1.9.2. Products
- 12.1.9.3. Company Financials
- 12.1.9.4. SWOT Analysis
- 12.1.10 Sil Industrial Minerals
- 12.1.10.1. Company Overview
- 12.1.10.2. Products
- 12.1.10.3. Company Financials
- 12.1.10.4. SWOT Analysis
- 12.1.11 Source Energy Services
- 12.1.11.1. Company Overview
- 12.1.11.2. Products
- 12.1.11.3. Company Financials
- 12.1.11.4. SWOT Analysis
- 12.1.12 Superior Silica Sands
- 12.1.12.1. Company Overview
- 12.1.12.2. Products
- 12.1.12.3. Company Financials
- 12.1.12.4. SWOT Analysis
- 12.1.13 Tochu Corporation
- 12.1.13.1. Company Overview
- 12.1.13.2. Products
- 12.1.13.3. Company Financials
- 12.1.13.4. SWOT Analysis
- 12.1.14 U S Silica*List Not Exhaustive
- 12.1.14.1. Company Overview
- 12.1.14.2. Products
- 12.1.14.3. Company Financials
- 12.1.14.4. SWOT Analysis
- 12.1.1 Badger Mining Corporation
- 12.2. Market Entropy
- 12.2.1 Company's Key Areas Served
- 12.2.2 Recent Developments
- 12.3. Company Market Share Analysis 2025
- 12.3.1 Top 5 Companies Market Share Analysis
- 12.3.2 Top 3 Companies Market Share Analysis
- 12.4. List of Potential Customers
- 13. Research Methodology
List of Figures
- Figure 1: Global Silica Sand Market Revenue Breakdown (billion, %) by Region 2025 & 2033
- Figure 2: Asia Pacific Silica Sand Market Revenue (billion), by End-user Industry 2025 & 2033
- Figure 3: Asia Pacific Silica Sand Market Revenue Share (%), by End-user Industry 2025 & 2033
- Figure 4: Asia Pacific Silica Sand Market Revenue (billion), by Country 2025 & 2033
- Figure 5: Asia Pacific Silica Sand Market Revenue Share (%), by Country 2025 & 2033
- Figure 6: North America Silica Sand Market Revenue (billion), by End-user Industry 2025 & 2033
- Figure 7: North America Silica Sand Market Revenue Share (%), by End-user Industry 2025 & 2033
- Figure 8: North America Silica Sand Market Revenue (billion), by Country 2025 & 2033
- Figure 9: North America Silica Sand Market Revenue Share (%), by Country 2025 & 2033
- Figure 10: Europe Silica Sand Market Revenue (billion), by End-user Industry 2025 & 2033
- Figure 11: Europe Silica Sand Market Revenue Share (%), by End-user Industry 2025 & 2033
- Figure 12: Europe Silica Sand Market Revenue (billion), by Country 2025 & 2033
- Figure 13: Europe Silica Sand Market Revenue Share (%), by Country 2025 & 2033
- Figure 14: South America Silica Sand Market Revenue (billion), by End-user Industry 2025 & 2033
- Figure 15: South America Silica Sand Market Revenue Share (%), by End-user Industry 2025 & 2033
- Figure 16: South America Silica Sand Market Revenue (billion), by Country 2025 & 2033
- Figure 17: South America Silica Sand Market Revenue Share (%), by Country 2025 & 2033
- Figure 18: Middle East and Africa Silica Sand Market Revenue (billion), by End-user Industry 2025 & 2033
- Figure 19: Middle East and Africa Silica Sand Market Revenue Share (%), by End-user Industry 2025 & 2033
- Figure 20: Middle East and Africa Silica Sand Market Revenue (billion), by Country 2025 & 2033
- Figure 21: Middle East and Africa Silica Sand Market Revenue Share (%), by Country 2025 & 2033
List of Tables
- Table 1: Global Silica Sand Market Revenue billion Forecast, by End-user Industry 2020 & 2033
- Table 2: Global Silica Sand Market Revenue billion Forecast, by Region 2020 & 2033
- Table 3: Global Silica Sand Market Revenue billion Forecast, by End-user Industry 2020 & 2033
- Table 4: Global Silica Sand Market Revenue billion Forecast, by Country 2020 & 2033
- Table 5: China Silica Sand Market Revenue (billion) Forecast, by Application 2020 & 2033
- Table 6: India Silica Sand Market Revenue (billion) Forecast, by Application 2020 & 2033
- Table 7: Japan Silica Sand Market Revenue (billion) Forecast, by Application 2020 & 2033
- Table 8: South Korea Silica Sand Market Revenue (billion) Forecast, by Application 2020 & 2033
- Table 9: Rest of Asia Pacific Silica Sand Market Revenue (billion) Forecast, by Application 2020 & 2033
- Table 10: Global Silica Sand Market Revenue billion Forecast, by End-user Industry 2020 & 2033
- Table 11: Global Silica Sand Market Revenue billion Forecast, by Country 2020 & 2033
- Table 12: United States Silica Sand Market Revenue (billion) Forecast, by Application 2020 & 2033
- Table 13: Canada Silica Sand Market Revenue (billion) Forecast, by Application 2020 & 2033
- Table 14: Mexico Silica Sand Market Revenue (billion) Forecast, by Application 2020 & 2033
- Table 15: Global Silica Sand Market Revenue billion Forecast, by End-user Industry 2020 & 2033
- Table 16: Global Silica Sand Market Revenue billion Forecast, by Country 2020 & 2033
- Table 17: Germany Silica Sand Market Revenue (billion) Forecast, by Application 2020 & 2033
- Table 18: United Kingdom Silica Sand Market Revenue (billion) Forecast, by Application 2020 & 2033
- Table 19: Italy Silica Sand Market Revenue (billion) Forecast, by Application 2020 & 2033
- Table 20: France Silica Sand Market Revenue (billion) Forecast, by Application 2020 & 2033
- Table 21: Rest of Europe Silica Sand Market Revenue (billion) Forecast, by Application 2020 & 2033
- Table 22: Global Silica Sand Market Revenue billion Forecast, by End-user Industry 2020 & 2033
- Table 23: Global Silica Sand Market Revenue billion Forecast, by Country 2020 & 2033
- Table 24: Brazil Silica Sand Market Revenue (billion) Forecast, by Application 2020 & 2033
- Table 25: Argentina Silica Sand Market Revenue (billion) Forecast, by Application 2020 & 2033
- Table 26: Rest of South America Silica Sand Market Revenue (billion) Forecast, by Application 2020 & 2033
- Table 27: Global Silica Sand Market Revenue billion Forecast, by End-user Industry 2020 & 2033
- Table 28: Global Silica Sand Market Revenue billion Forecast, by Country 2020 & 2033
- Table 29: Saudi Arabia Silica Sand Market Revenue (billion) Forecast, by Application 2020 & 2033
- Table 30: South Africa Silica Sand Market Revenue (billion) Forecast, by Application 2020 & 2033
- Table 31: Rest of Middle East and Africa Silica Sand Market Revenue (billion) Forecast, by Application 2020 & 2033
Frequently Asked Questions
1. What is the projected Compound Annual Growth Rate (CAGR) of the Silica Sand Market?
The projected CAGR is approximately 4.7%.
2. Which companies are prominent players in the Silica Sand Market?
Key companies in the market include Badger Mining Corporation, Chongqing Changjiang River Moulding Material Group Co Ltd, Covia Holdings LLC, Euroquarz GmbH, Hi-Crush Inc, JFE Mineral & Alloy Company Ltd, Mitsubishi Corporation, PUM GROUP, Sibelco, Sil Industrial Minerals, Source Energy Services, Superior Silica Sands, Tochu Corporation, U S Silica*List Not Exhaustive.
3. What are the main segments of the Silica Sand Market?
The market segments include End-user Industry.
4. Can you provide details about the market size?
The market size is estimated to be USD 25.4 billion as of 2022.
5. What are some drivers contributing to market growth?
Increasing Demand from the Foundry Industry; Growing Demand from the Glass Industry.
6. What are the notable trends driving market growth?
Oil and Gas Industry to Dominate the Market.
7. Are there any restraints impacting market growth?
Increasing Demand from the Foundry Industry; Growing Demand from the Glass Industry.
8. Can you provide examples of recent developments in the market?
July 2022: Sibelco acquired EchasaSA, a mining company that mines silica sand from the Laminoriaquarry near Vitoria in the Basque Country in northern Spain, 160 kilometers from Sibelco's nearest silica sand quarry in Ariya.
9. What pricing options are available for accessing the report?
Pricing options include single-user, multi-user, and enterprise licenses priced at USD 4750, USD 5250, and USD 8750 respectively.
10. Is the market size provided in terms of value or volume?
The market size is provided in terms of value, measured in billion.
11. Are there any specific market keywords associated with the report?
Yes, the market keyword associated with the report is "Silica Sand Market," which aids in identifying and referencing the specific market segment covered.
12. How do I determine which pricing option suits my needs best?
The pricing options vary based on user requirements and access needs. Individual users may opt for single-user licenses, while businesses requiring broader access may choose multi-user or enterprise licenses for cost-effective access to the report.
13. Are there any additional resources or data provided in the Silica Sand Market report?
While the report offers comprehensive insights, it's advisable to review the specific contents or supplementary materials provided to ascertain if additional resources or data are available.
14. How can I stay updated on further developments or reports in the Silica Sand Market?
To stay informed about further developments, trends, and reports in the Silica Sand Market, consider subscribing to industry newsletters, following relevant companies and organizations, or regularly checking reputable industry news sources and publications.
Methodology
Step 1 - Identification of Relevant Samples Size from Population Database


Step 2 - Approaches for Defining Global Market Size (Value, Volume* & Price*)

Note*: In applicable scenarios
Step 3 - Data Sources
Primary Research
- Web Analytics
- Survey Reports
- Research Institute
- Latest Research Reports
- Opinion Leaders
Secondary Research
- Annual Reports
- White Paper
- Latest Press Release
- Industry Association
- Paid Database
- Investor Presentations

Step 4 - Data Triangulation
Involves using different sources of information in order to increase the validity of a study
These sources are likely to be stakeholders in a program - participants, other researchers, program staff, other community members, and so on.
Then we put all data in single framework & apply various statistical tools to find out the dynamic on the market.
During the analysis stage, feedback from the stakeholder groups would be compared to determine areas of agreement as well as areas of divergence