

Key Insights
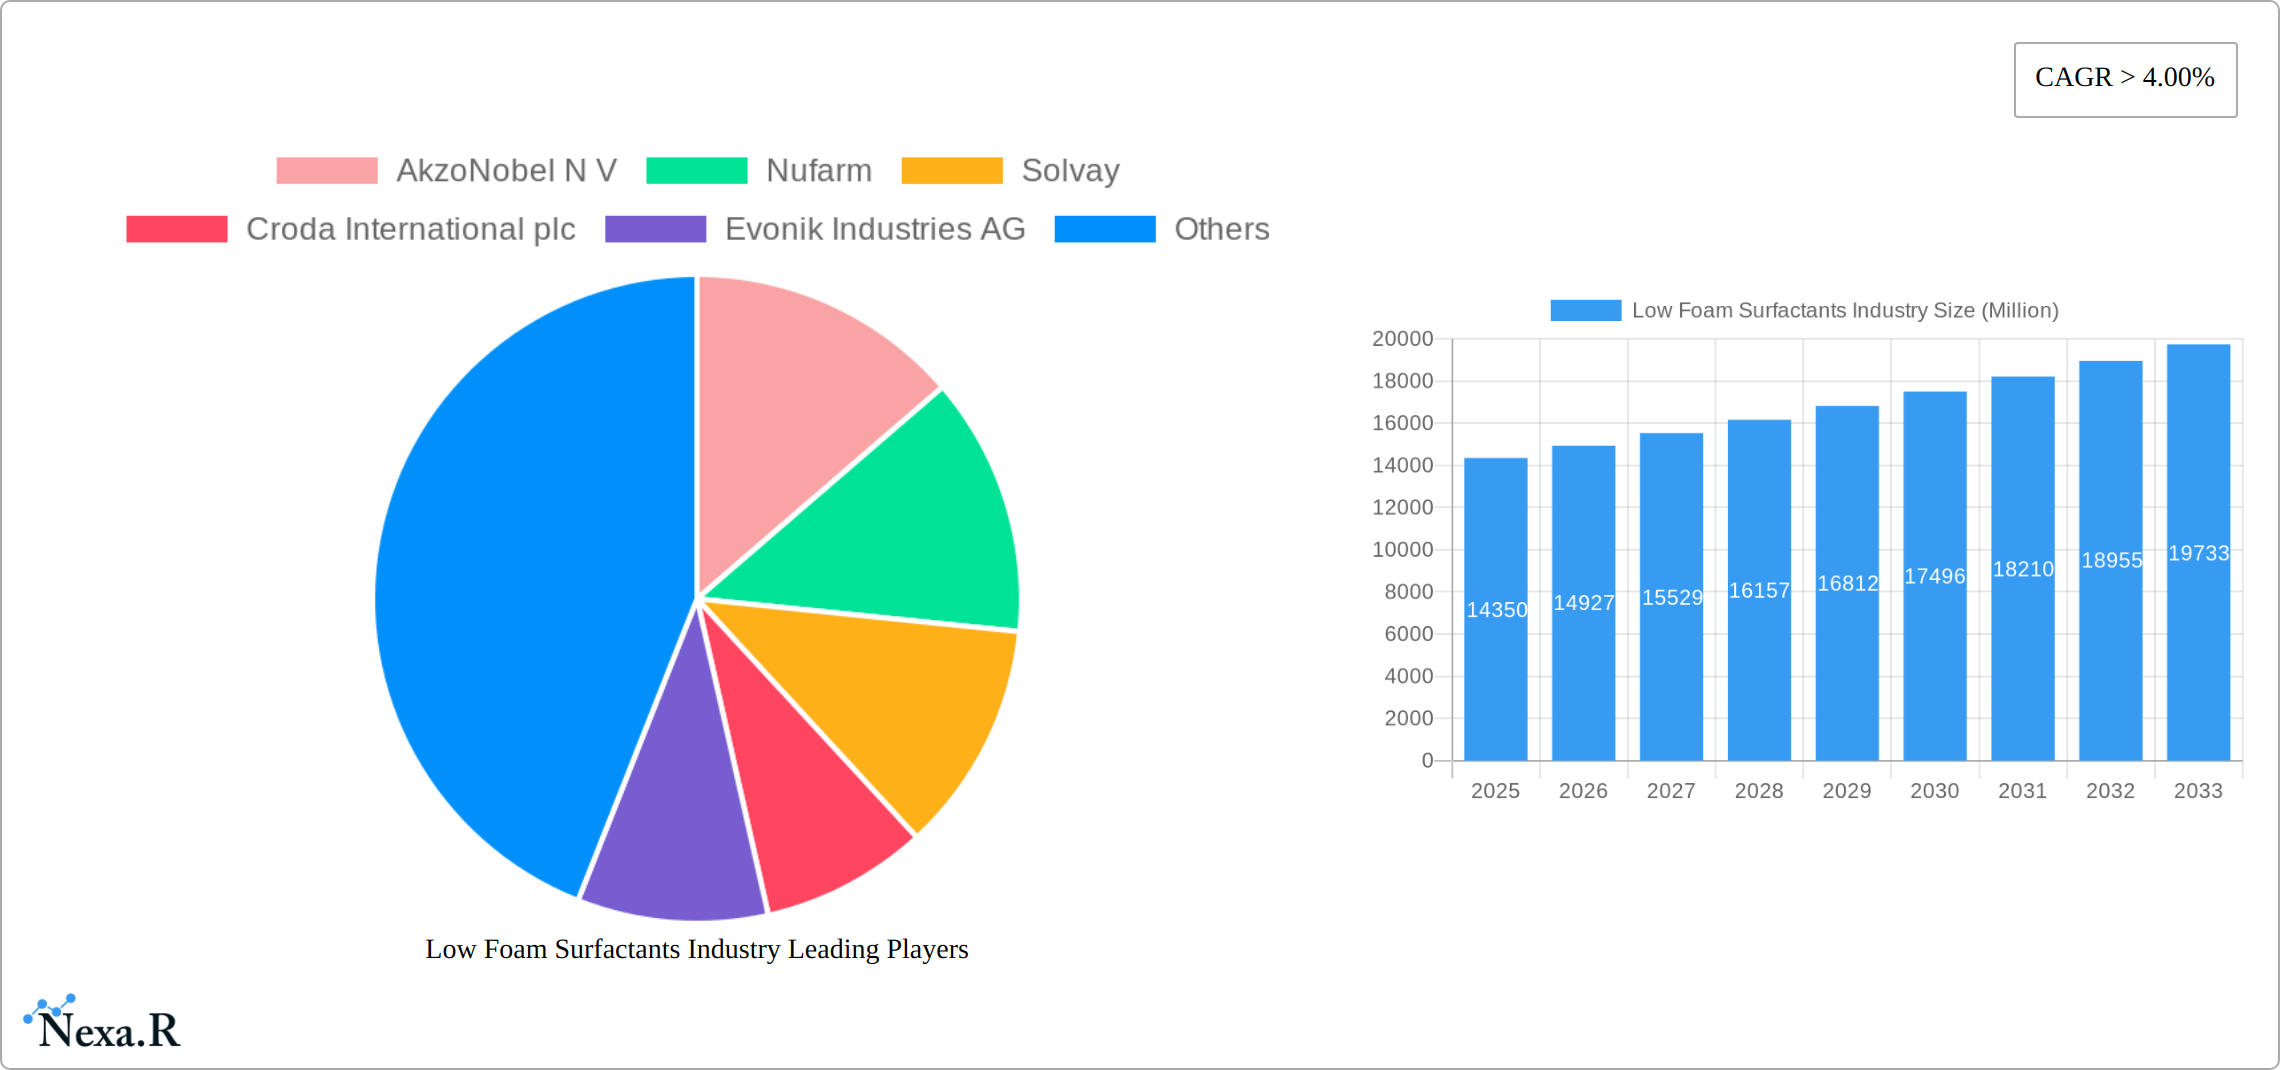
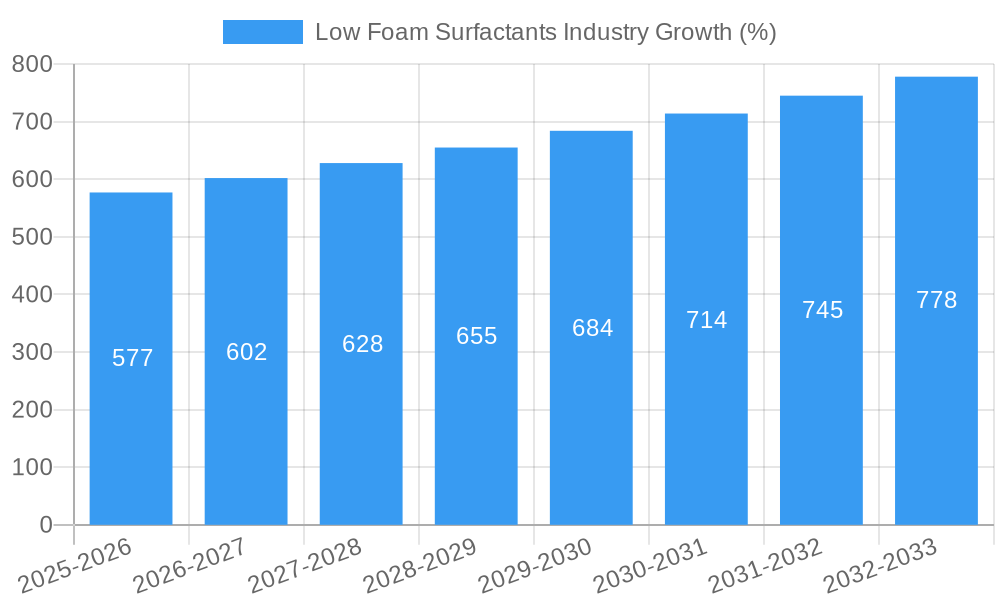
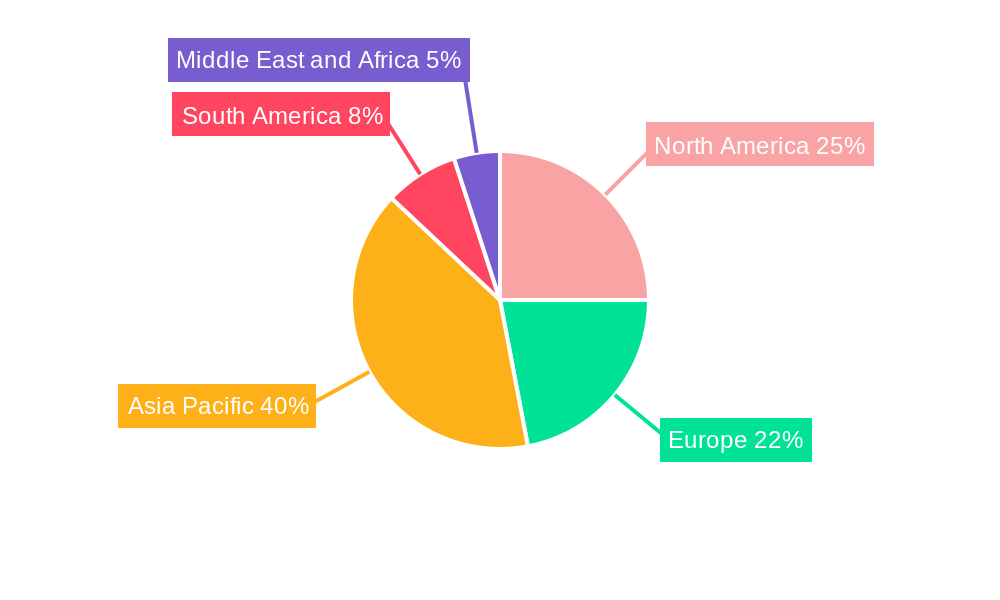
The global low foam surfactants market, valued at $14.35 billion in 2025, is projected to experience robust growth, exceeding a 4% CAGR from 2025 to 2033. This expansion is driven by increasing demand across diverse end-use industries, particularly in detergents and cleaning agents, agrochemicals, and food and dairy processing. The rising need for efficient and environmentally friendly cleaning solutions, coupled with stringent regulations concerning foam formation in various applications, fuels market growth. The amphoteric and non-ionic surfactant segments are anticipated to dominate due to their versatile properties and compatibility with various formulations. Geographically, the Asia-Pacific region, driven by strong economic growth and industrialization in countries like China and India, is expected to hold a significant market share. However, North America and Europe also represent substantial markets, characterized by technological advancements and a high adoption rate of eco-friendly cleaning technologies. Key players like AkzoNobel, Solvay, BASF, and Evonik are investing heavily in R&D to develop innovative low-foam surfactant solutions with enhanced performance characteristics and reduced environmental impact. Competition is intense, with companies focusing on product diversification, strategic partnerships, and mergers and acquisitions to expand their market footprint. The market faces challenges such as fluctuating raw material prices and evolving environmental regulations, which require continuous adaptation and innovation.
The future growth trajectory of the low foam surfactants market will be shaped by several factors. Increased adoption of sustainable and biodegradable surfactants, driven by growing environmental concerns, will be a key driver. Technological advancements focusing on improving surfactant performance, reducing foam formation, and enhancing biodegradability will create further market opportunities. Expanding applications in niche sectors like personal care and textiles, alongside continued growth in established sectors, will contribute significantly to market expansion. However, economic fluctuations and potential supply chain disruptions pose significant risks. Companies are likely to leverage digital technologies to optimize their supply chains and improve efficiency, enabling better response to market dynamics and stronger customer relationships. A strong emphasis on research and development will remain crucial to stay ahead of competition and maintain a competitive edge in this dynamic market.
Low Foam Surfactants Industry Market Report: 2019-2033
This comprehensive report provides a detailed analysis of the low foam surfactants market, encompassing market dynamics, growth trends, regional segmentation, product landscape, key players, and future outlook. The report covers the period from 2019 to 2033, with 2025 serving as the base and estimated year. The historical period analyzed is 2019-2024, while the forecast period stretches from 2025 to 2033. The market is segmented by type (Amphoteric, Cationic, Non-ionic) and end-user industry (Agrochemicals, Food and Dairy Process Cleaners, Detergents and Cleaning Agents, Pulp and Paper, Metal Cleaning and Metal Working Fluids, Oilfield Chemicals, Others). Key players analyzed include AkzoNobel N.V., Nufarm, Solvay, Croda International plc, Evonik Industries AG, BASF SE, Huntsman International LLC, Dow, KAO CORPORATION, Oxiteno SA, Stepan Company, Clariant AG, and others.
Low Foam Surfactants Industry Market Dynamics & Structure
The low foam surfactants market is characterized by moderate concentration, with several major players holding significant market share. Technological innovation, driven by the demand for sustainable and high-performance products, is a key driver. Stringent environmental regulations are shaping product development and manufacturing processes. Competitive pressures from substitute products, particularly in specific applications, are also influencing market dynamics. End-user demographics, especially the growth of specific industries like agrochemicals and cleaning agents, significantly impact market demand. M&A activity has been moderate in recent years, with a focus on expanding product portfolios and geographic reach.
- Market Concentration: Moderately concentrated, with top 10 players holding approximately xx% of the market share in 2024.
- Technological Innovation: Focus on bio-based surfactants, improved cleaning efficacy, and reduced environmental impact.
- Regulatory Framework: Stringent regulations concerning environmental impact and safety are driving the demand for eco-friendly solutions.
- Competitive Substitutes: Alternative cleaning agents and formulations pose a competitive threat in certain segments.
- End-User Demographics: Growth in agrochemicals, detergents, and industrial cleaning sectors fuels market expansion.
- M&A Trends: Moderate activity, primarily focused on strategic acquisitions to broaden product lines and market presence. Estimated xx M&A deals occurred between 2019 and 2024.
Low Foam Surfactants Industry Growth Trends & Insights
The global low foam surfactants market is experiencing steady growth, driven by rising demand across diverse end-use industries. The market size is projected to reach xx Million by 2025 and further expand to xx Million by 2033, exhibiting a CAGR of xx% during the forecast period. Increased adoption rates in emerging economies, technological advancements leading to superior product performance, and a shift towards sustainable and eco-friendly solutions are significant factors influencing market expansion. Consumer preference for effective, yet environmentally conscious cleaning products is another key driver. The penetration rate for low foam surfactants in key end-use sectors such as detergents and cleaning agents is expected to increase from xx% in 2024 to xx% by 2033. Technological disruptions, such as the introduction of bio-based surfactants, are accelerating market growth.
Dominant Regions, Countries, or Segments in Low Foam Surfactants Industry
North America and Europe currently dominate the low foam surfactants market, owing to established industrial bases and high demand from various end-use sectors. However, Asia-Pacific is expected to witness significant growth in the coming years due to rapid industrialization and increasing disposable incomes. Within the segments, the non-ionic type holds the largest market share due to its versatility and cost-effectiveness. The detergents and cleaning agents segment represents the largest end-user application, driven by the growing global demand for household and industrial cleaning products.
- Key Drivers:
- North America: Strong demand from various industrial sectors, robust R&D activities.
- Europe: Stringent environmental regulations promoting sustainable products.
- Asia-Pacific: Rapid industrialization, increasing urbanization, and rising disposable incomes.
- Dominant Segments:
- Type: Non-ionic surfactants account for xx% of the market, followed by anionic at xx% and cationic at xx%.
- End-user: Detergents and cleaning agents constitute the largest segment, with a market share of xx% in 2024, followed by Agrochemicals at xx%.
Low Foam Surfactants Industry Product Landscape
The low foam surfactants market is a dynamic landscape featuring a diverse array of products meticulously engineered for specific applications. Innovation is a driving force, continuously pushing boundaries to enhance performance, bolster biodegradability, and minimize environmental impact. Product differentiation is keenly pursued through unique formulations, superior cleaning efficacy, and optimized compatibility with various substrates. Technological advancements are particularly notable in the development of bio-based surfactants, paving the way for sustainable and environmentally responsible solutions. This dedication to innovation directly addresses the escalating consumer and regulatory demands for eco-conscious products, creating a market driven by sustainability and performance.
Key Drivers, Barriers & Challenges in Low Foam Surfactants Industry
Key Drivers:
The market is primarily driven by the growing demand for effective and environmentally friendly cleaning solutions across various industries. Stringent environmental regulations are pushing manufacturers towards developing bio-based and sustainable alternatives. Technological advancements in surfactant chemistry are continuously leading to improved product performance and cost-effectiveness. The rising demand for hygiene and sanitation across sectors is another major factor.
Key Challenges:
Fluctuations in raw material prices pose a significant challenge to profitability. Stringent regulatory requirements and compliance costs add to the operational burden. Intense competition from existing players and new entrants necessitates continuous innovation and product differentiation. Supply chain disruptions caused by geopolitical instability can impact the availability of raw materials.
Emerging Opportunities in Low Foam Surfactants Industry
Significant untapped potential exists within emerging economies experiencing rapid industrial growth. These regions represent a fertile ground for expansion. The demand for specialized low-foam surfactants tailored to niche applications, such as in personal care, textiles, and industrial cleaning, is fueling new avenues for growth. Furthermore, the global emphasis on sustainability and the concurrent development of bio-based alternatives present compelling opportunities for environmentally conscious manufacturers to capture significant market share. This trend towards eco-friendly solutions is a key driver of market expansion.
Growth Accelerators in the Low Foam Surfactants Industry
Technological breakthroughs, such as the development of high-performance bio-based surfactants, are key growth catalysts. Strategic partnerships and collaborations between manufacturers and end-users foster innovation and market expansion. Government initiatives promoting sustainable solutions are creating a favorable environment for the industry's growth. Expansion into new geographical markets and the exploration of niche applications are driving long-term growth.
Key Players Shaping the Low Foam Surfactants Industry Market
- AkzoNobel N.V.
- Nufarm
- Solvay
- Croda International plc
- Evonik Industries AG
- BASF SE
- Huntsman International LLC
- Dow
- KAO CORPORATION
- Oxiteno SA
- Stepan Company
- Clariant AG
Notable Milestones in Low Foam Surfactants Industry Sector
- February 2022: Clariant's launch of a 100% bio-based surfactant range marked a significant stride towards sustainable product development and substantially broadened their portfolio of eco-friendly offerings. This highlights the industry's commitment to sustainability.
- April 2022: BASF SE enhanced its product line with Dehypound M and Dehypound HDG, high-performance nonionic surfactant blends designed for multi-soil and multi-application cleaning and degreasing. This exemplifies innovation in developing high-performance, versatile cleaning solutions.
- [Add more recent milestones here, with dates and brief descriptions. Include details of new product launches, partnerships, acquisitions, or significant regulatory changes.]
In-Depth Low Foam Surfactants Industry Market Outlook
The low foam surfactants market is projected to experience sustained growth, propelled by continuous technological advancements, increasing demand across diverse sectors, and a robust commitment to sustainability. Strategic partnerships, market expansion into developing economies, and the development of specialized products for niche applications will collectively contribute to the market's long-term potential. The market offers exceptional opportunities for companies adept at innovation and those capable of effectively addressing the evolving needs of end-users while diligently adhering to stringent environmental regulations. The future success in this market hinges on a combination of technological advancement, sustainable practices, and a deep understanding of consumer needs.
Low Foam Surfactants Industry Segmentation
-
1. Type
- 1.1. Amphoteric
- 1.2. Cationic
- 1.3. Non-ionic
-
2. End-user Industry
- 2.1. Agrochemicals
- 2.2. Food and Dairy Process Cleaners
- 2.3. Detergents and Cleaning Agents
- 2.4. Pulp and Paper
- 2.5. Metal Cleaning and Metal Working Fluids
- 2.6. Oilfield Chemicals
- 2.7. Others (Textiles, Personal care, etc.)
Low Foam Surfactants Industry Segmentation By Geography
-
1. Asia Pacific
- 1.1. China
- 1.2. India
- 1.3. Japan
- 1.4. South Korea
- 1.5. Rest of Asia Pacific
-
2. North America
- 2.1. United States
- 2.2. Canada
- 2.3. Mexico
-
3. Europe
- 3.1. Germany
- 3.2. United Kingdom
- 3.3. Italy
- 3.4. France
- 3.5. Rest of Europe
-
4. South America
- 4.1. Brazil
- 4.2. Argentina
- 4.3. Rest of South America
-
5. Middle East and Africa
- 5.1. Saudi Arabia
- 5.2. South Africa
- 5.3. Rest of Middle East and Africa
Low Foam Surfactants Industry REPORT HIGHLIGHTS
| Aspects | Details |
|---|---|
| Study Period | 2019-2033 |
| Base Year | 2024 |
| Estimated Year | 2025 |
| Forecast Period | 2025-2033 |
| Historical Period | 2019-2024 |
| Growth Rate | CAGR of > 4.00% from 2019-2033 |
| Segmentation |
|
Table of Contents
- 1. Introduction
- 1.1. Research Scope
- 1.2. Market Segmentation
- 1.3. Research Methodology
- 1.4. Definitions and Assumptions
- 2. Executive Summary
- 2.1. Introduction
- 3. Market Dynamics
- 3.1. Introduction
- 3.2. Market Drivers
- 3.2.1. Significant Growth in Detergents and Cleaning Agents; Increased Demand for Sustainable Surfactants; The rising demand for personal care products
- 3.3. Market Restrains
- 3.3.1. The Stringent Enviornmental Regulations; The Availability of Other Substitutes
- 3.4. Market Trends
- 3.4.1. Detergents and Cleaning Agents End-user Industry Segment to Dominate the Market
- 4. Market Factor Analysis
- 4.1. Porters Five Forces
- 4.2. Supply/Value Chain
- 4.3. PESTEL analysis
- 4.4. Market Entropy
- 4.5. Patent/Trademark Analysis
- 5. Global Low Foam Surfactants Industry Analysis, Insights and Forecast, 2019-2031
- 5.1. Market Analysis, Insights and Forecast - by Type
- 5.1.1. Amphoteric
- 5.1.2. Cationic
- 5.1.3. Non-ionic
- 5.2. Market Analysis, Insights and Forecast - by End-user Industry
- 5.2.1. Agrochemicals
- 5.2.2. Food and Dairy Process Cleaners
- 5.2.3. Detergents and Cleaning Agents
- 5.2.4. Pulp and Paper
- 5.2.5. Metal Cleaning and Metal Working Fluids
- 5.2.6. Oilfield Chemicals
- 5.2.7. Others (Textiles, Personal care, etc.)
- 5.3. Market Analysis, Insights and Forecast - by Region
- 5.3.1. Asia Pacific
- 5.3.2. North America
- 5.3.3. Europe
- 5.3.4. South America
- 5.3.5. Middle East and Africa
- 5.1. Market Analysis, Insights and Forecast - by Type
- 6. Asia Pacific Low Foam Surfactants Industry Analysis, Insights and Forecast, 2019-2031
- 6.1. Market Analysis, Insights and Forecast - by Type
- 6.1.1. Amphoteric
- 6.1.2. Cationic
- 6.1.3. Non-ionic
- 6.2. Market Analysis, Insights and Forecast - by End-user Industry
- 6.2.1. Agrochemicals
- 6.2.2. Food and Dairy Process Cleaners
- 6.2.3. Detergents and Cleaning Agents
- 6.2.4. Pulp and Paper
- 6.2.5. Metal Cleaning and Metal Working Fluids
- 6.2.6. Oilfield Chemicals
- 6.2.7. Others (Textiles, Personal care, etc.)
- 6.1. Market Analysis, Insights and Forecast - by Type
- 7. North America Low Foam Surfactants Industry Analysis, Insights and Forecast, 2019-2031
- 7.1. Market Analysis, Insights and Forecast - by Type
- 7.1.1. Amphoteric
- 7.1.2. Cationic
- 7.1.3. Non-ionic
- 7.2. Market Analysis, Insights and Forecast - by End-user Industry
- 7.2.1. Agrochemicals
- 7.2.2. Food and Dairy Process Cleaners
- 7.2.3. Detergents and Cleaning Agents
- 7.2.4. Pulp and Paper
- 7.2.5. Metal Cleaning and Metal Working Fluids
- 7.2.6. Oilfield Chemicals
- 7.2.7. Others (Textiles, Personal care, etc.)
- 7.1. Market Analysis, Insights and Forecast - by Type
- 8. Europe Low Foam Surfactants Industry Analysis, Insights and Forecast, 2019-2031
- 8.1. Market Analysis, Insights and Forecast - by Type
- 8.1.1. Amphoteric
- 8.1.2. Cationic
- 8.1.3. Non-ionic
- 8.2. Market Analysis, Insights and Forecast - by End-user Industry
- 8.2.1. Agrochemicals
- 8.2.2. Food and Dairy Process Cleaners
- 8.2.3. Detergents and Cleaning Agents
- 8.2.4. Pulp and Paper
- 8.2.5. Metal Cleaning and Metal Working Fluids
- 8.2.6. Oilfield Chemicals
- 8.2.7. Others (Textiles, Personal care, etc.)
- 8.1. Market Analysis, Insights and Forecast - by Type
- 9. South America Low Foam Surfactants Industry Analysis, Insights and Forecast, 2019-2031
- 9.1. Market Analysis, Insights and Forecast - by Type
- 9.1.1. Amphoteric
- 9.1.2. Cationic
- 9.1.3. Non-ionic
- 9.2. Market Analysis, Insights and Forecast - by End-user Industry
- 9.2.1. Agrochemicals
- 9.2.2. Food and Dairy Process Cleaners
- 9.2.3. Detergents and Cleaning Agents
- 9.2.4. Pulp and Paper
- 9.2.5. Metal Cleaning and Metal Working Fluids
- 9.2.6. Oilfield Chemicals
- 9.2.7. Others (Textiles, Personal care, etc.)
- 9.1. Market Analysis, Insights and Forecast - by Type
- 10. Middle East and Africa Low Foam Surfactants Industry Analysis, Insights and Forecast, 2019-2031
- 10.1. Market Analysis, Insights and Forecast - by Type
- 10.1.1. Amphoteric
- 10.1.2. Cationic
- 10.1.3. Non-ionic
- 10.2. Market Analysis, Insights and Forecast - by End-user Industry
- 10.2.1. Agrochemicals
- 10.2.2. Food and Dairy Process Cleaners
- 10.2.3. Detergents and Cleaning Agents
- 10.2.4. Pulp and Paper
- 10.2.5. Metal Cleaning and Metal Working Fluids
- 10.2.6. Oilfield Chemicals
- 10.2.7. Others (Textiles, Personal care, etc.)
- 10.1. Market Analysis, Insights and Forecast - by Type
- 11. Asia Pacific Low Foam Surfactants Industry Analysis, Insights and Forecast, 2019-2031
- 11.1. Market Analysis, Insights and Forecast - By Country/Sub-region
- 11.1.1 China
- 11.1.2 India
- 11.1.3 Japan
- 11.1.4 South Korea
- 11.1.5 Rest of Asia Pacific
- 12. North America Low Foam Surfactants Industry Analysis, Insights and Forecast, 2019-2031
- 12.1. Market Analysis, Insights and Forecast - By Country/Sub-region
- 12.1.1 United States
- 12.1.2 Canada
- 12.1.3 Mexico
- 13. Europe Low Foam Surfactants Industry Analysis, Insights and Forecast, 2019-2031
- 13.1. Market Analysis, Insights and Forecast - By Country/Sub-region
- 13.1.1 Germany
- 13.1.2 United Kingdom
- 13.1.3 Italy
- 13.1.4 France
- 13.1.5 Rest of Europe
- 14. South America Low Foam Surfactants Industry Analysis, Insights and Forecast, 2019-2031
- 14.1. Market Analysis, Insights and Forecast - By Country/Sub-region
- 14.1.1 Brazil
- 14.1.2 Argentina
- 14.1.3 Rest of South America
- 15. Middle East and Africa Low Foam Surfactants Industry Analysis, Insights and Forecast, 2019-2031
- 15.1. Market Analysis, Insights and Forecast - By Country/Sub-region
- 15.1.1 Saudi Arabia
- 15.1.2 South Africa
- 15.1.3 Rest of Middle East and Africa
- 16. Competitive Analysis
- 16.1. Global Market Share Analysis 2024
- 16.2. Company Profiles
- 16.2.1 AkzoNobel N V
- 16.2.1.1. Overview
- 16.2.1.2. Products
- 16.2.1.3. SWOT Analysis
- 16.2.1.4. Recent Developments
- 16.2.1.5. Financials (Based on Availability)
- 16.2.2 Nufarm
- 16.2.2.1. Overview
- 16.2.2.2. Products
- 16.2.2.3. SWOT Analysis
- 16.2.2.4. Recent Developments
- 16.2.2.5. Financials (Based on Availability)
- 16.2.3 Solvay
- 16.2.3.1. Overview
- 16.2.3.2. Products
- 16.2.3.3. SWOT Analysis
- 16.2.3.4. Recent Developments
- 16.2.3.5. Financials (Based on Availability)
- 16.2.4 Croda International plc
- 16.2.4.1. Overview
- 16.2.4.2. Products
- 16.2.4.3. SWOT Analysis
- 16.2.4.4. Recent Developments
- 16.2.4.5. Financials (Based on Availability)
- 16.2.5 Evonik Industries AG
- 16.2.5.1. Overview
- 16.2.5.2. Products
- 16.2.5.3. SWOT Analysis
- 16.2.5.4. Recent Developments
- 16.2.5.5. Financials (Based on Availability)
- 16.2.6 BASF SE
- 16.2.6.1. Overview
- 16.2.6.2. Products
- 16.2.6.3. SWOT Analysis
- 16.2.6.4. Recent Developments
- 16.2.6.5. Financials (Based on Availability)
- 16.2.7 Huntsman International LLC
- 16.2.7.1. Overview
- 16.2.7.2. Products
- 16.2.7.3. SWOT Analysis
- 16.2.7.4. Recent Developments
- 16.2.7.5. Financials (Based on Availability)
- 16.2.8 Dow
- 16.2.8.1. Overview
- 16.2.8.2. Products
- 16.2.8.3. SWOT Analysis
- 16.2.8.4. Recent Developments
- 16.2.8.5. Financials (Based on Availability)
- 16.2.9 KAO CORPORATION
- 16.2.9.1. Overview
- 16.2.9.2. Products
- 16.2.9.3. SWOT Analysis
- 16.2.9.4. Recent Developments
- 16.2.9.5. Financials (Based on Availability)
- 16.2.10 Oxiteno SA
- 16.2.10.1. Overview
- 16.2.10.2. Products
- 16.2.10.3. SWOT Analysis
- 16.2.10.4. Recent Developments
- 16.2.10.5. Financials (Based on Availability)
- 16.2.11 Stepan Company*List Not Exhaustive
- 16.2.11.1. Overview
- 16.2.11.2. Products
- 16.2.11.3. SWOT Analysis
- 16.2.11.4. Recent Developments
- 16.2.11.5. Financials (Based on Availability)
- 16.2.12 Clariant AG
- 16.2.12.1. Overview
- 16.2.12.2. Products
- 16.2.12.3. SWOT Analysis
- 16.2.12.4. Recent Developments
- 16.2.12.5. Financials (Based on Availability)
- 16.2.1 AkzoNobel N V
List of Figures
- Figure 1: Global Low Foam Surfactants Industry Revenue Breakdown (Million, %) by Region 2024 & 2032
- Figure 2: Global Low Foam Surfactants Industry Volume Breakdown (liter , %) by Region 2024 & 2032
- Figure 3: Asia Pacific Low Foam Surfactants Industry Revenue (Million), by Country 2024 & 2032
- Figure 4: Asia Pacific Low Foam Surfactants Industry Volume (liter ), by Country 2024 & 2032
- Figure 5: Asia Pacific Low Foam Surfactants Industry Revenue Share (%), by Country 2024 & 2032
- Figure 6: Asia Pacific Low Foam Surfactants Industry Volume Share (%), by Country 2024 & 2032
- Figure 7: North America Low Foam Surfactants Industry Revenue (Million), by Country 2024 & 2032
- Figure 8: North America Low Foam Surfactants Industry Volume (liter ), by Country 2024 & 2032
- Figure 9: North America Low Foam Surfactants Industry Revenue Share (%), by Country 2024 & 2032
- Figure 10: North America Low Foam Surfactants Industry Volume Share (%), by Country 2024 & 2032
- Figure 11: Europe Low Foam Surfactants Industry Revenue (Million), by Country 2024 & 2032
- Figure 12: Europe Low Foam Surfactants Industry Volume (liter ), by Country 2024 & 2032
- Figure 13: Europe Low Foam Surfactants Industry Revenue Share (%), by Country 2024 & 2032
- Figure 14: Europe Low Foam Surfactants Industry Volume Share (%), by Country 2024 & 2032
- Figure 15: South America Low Foam Surfactants Industry Revenue (Million), by Country 2024 & 2032
- Figure 16: South America Low Foam Surfactants Industry Volume (liter ), by Country 2024 & 2032
- Figure 17: South America Low Foam Surfactants Industry Revenue Share (%), by Country 2024 & 2032
- Figure 18: South America Low Foam Surfactants Industry Volume Share (%), by Country 2024 & 2032
- Figure 19: Middle East and Africa Low Foam Surfactants Industry Revenue (Million), by Country 2024 & 2032
- Figure 20: Middle East and Africa Low Foam Surfactants Industry Volume (liter ), by Country 2024 & 2032
- Figure 21: Middle East and Africa Low Foam Surfactants Industry Revenue Share (%), by Country 2024 & 2032
- Figure 22: Middle East and Africa Low Foam Surfactants Industry Volume Share (%), by Country 2024 & 2032
- Figure 23: Asia Pacific Low Foam Surfactants Industry Revenue (Million), by Type 2024 & 2032
- Figure 24: Asia Pacific Low Foam Surfactants Industry Volume (liter ), by Type 2024 & 2032
- Figure 25: Asia Pacific Low Foam Surfactants Industry Revenue Share (%), by Type 2024 & 2032
- Figure 26: Asia Pacific Low Foam Surfactants Industry Volume Share (%), by Type 2024 & 2032
- Figure 27: Asia Pacific Low Foam Surfactants Industry Revenue (Million), by End-user Industry 2024 & 2032
- Figure 28: Asia Pacific Low Foam Surfactants Industry Volume (liter ), by End-user Industry 2024 & 2032
- Figure 29: Asia Pacific Low Foam Surfactants Industry Revenue Share (%), by End-user Industry 2024 & 2032
- Figure 30: Asia Pacific Low Foam Surfactants Industry Volume Share (%), by End-user Industry 2024 & 2032
- Figure 31: Asia Pacific Low Foam Surfactants Industry Revenue (Million), by Country 2024 & 2032
- Figure 32: Asia Pacific Low Foam Surfactants Industry Volume (liter ), by Country 2024 & 2032
- Figure 33: Asia Pacific Low Foam Surfactants Industry Revenue Share (%), by Country 2024 & 2032
- Figure 34: Asia Pacific Low Foam Surfactants Industry Volume Share (%), by Country 2024 & 2032
- Figure 35: North America Low Foam Surfactants Industry Revenue (Million), by Type 2024 & 2032
- Figure 36: North America Low Foam Surfactants Industry Volume (liter ), by Type 2024 & 2032
- Figure 37: North America Low Foam Surfactants Industry Revenue Share (%), by Type 2024 & 2032
- Figure 38: North America Low Foam Surfactants Industry Volume Share (%), by Type 2024 & 2032
- Figure 39: North America Low Foam Surfactants Industry Revenue (Million), by End-user Industry 2024 & 2032
- Figure 40: North America Low Foam Surfactants Industry Volume (liter ), by End-user Industry 2024 & 2032
- Figure 41: North America Low Foam Surfactants Industry Revenue Share (%), by End-user Industry 2024 & 2032
- Figure 42: North America Low Foam Surfactants Industry Volume Share (%), by End-user Industry 2024 & 2032
- Figure 43: North America Low Foam Surfactants Industry Revenue (Million), by Country 2024 & 2032
- Figure 44: North America Low Foam Surfactants Industry Volume (liter ), by Country 2024 & 2032
- Figure 45: North America Low Foam Surfactants Industry Revenue Share (%), by Country 2024 & 2032
- Figure 46: North America Low Foam Surfactants Industry Volume Share (%), by Country 2024 & 2032
- Figure 47: Europe Low Foam Surfactants Industry Revenue (Million), by Type 2024 & 2032
- Figure 48: Europe Low Foam Surfactants Industry Volume (liter ), by Type 2024 & 2032
- Figure 49: Europe Low Foam Surfactants Industry Revenue Share (%), by Type 2024 & 2032
- Figure 50: Europe Low Foam Surfactants Industry Volume Share (%), by Type 2024 & 2032
- Figure 51: Europe Low Foam Surfactants Industry Revenue (Million), by End-user Industry 2024 & 2032
- Figure 52: Europe Low Foam Surfactants Industry Volume (liter ), by End-user Industry 2024 & 2032
- Figure 53: Europe Low Foam Surfactants Industry Revenue Share (%), by End-user Industry 2024 & 2032
- Figure 54: Europe Low Foam Surfactants Industry Volume Share (%), by End-user Industry 2024 & 2032
- Figure 55: Europe Low Foam Surfactants Industry Revenue (Million), by Country 2024 & 2032
- Figure 56: Europe Low Foam Surfactants Industry Volume (liter ), by Country 2024 & 2032
- Figure 57: Europe Low Foam Surfactants Industry Revenue Share (%), by Country 2024 & 2032
- Figure 58: Europe Low Foam Surfactants Industry Volume Share (%), by Country 2024 & 2032
- Figure 59: South America Low Foam Surfactants Industry Revenue (Million), by Type 2024 & 2032
- Figure 60: South America Low Foam Surfactants Industry Volume (liter ), by Type 2024 & 2032
- Figure 61: South America Low Foam Surfactants Industry Revenue Share (%), by Type 2024 & 2032
- Figure 62: South America Low Foam Surfactants Industry Volume Share (%), by Type 2024 & 2032
- Figure 63: South America Low Foam Surfactants Industry Revenue (Million), by End-user Industry 2024 & 2032
- Figure 64: South America Low Foam Surfactants Industry Volume (liter ), by End-user Industry 2024 & 2032
- Figure 65: South America Low Foam Surfactants Industry Revenue Share (%), by End-user Industry 2024 & 2032
- Figure 66: South America Low Foam Surfactants Industry Volume Share (%), by End-user Industry 2024 & 2032
- Figure 67: South America Low Foam Surfactants Industry Revenue (Million), by Country 2024 & 2032
- Figure 68: South America Low Foam Surfactants Industry Volume (liter ), by Country 2024 & 2032
- Figure 69: South America Low Foam Surfactants Industry Revenue Share (%), by Country 2024 & 2032
- Figure 70: South America Low Foam Surfactants Industry Volume Share (%), by Country 2024 & 2032
- Figure 71: Middle East and Africa Low Foam Surfactants Industry Revenue (Million), by Type 2024 & 2032
- Figure 72: Middle East and Africa Low Foam Surfactants Industry Volume (liter ), by Type 2024 & 2032
- Figure 73: Middle East and Africa Low Foam Surfactants Industry Revenue Share (%), by Type 2024 & 2032
- Figure 74: Middle East and Africa Low Foam Surfactants Industry Volume Share (%), by Type 2024 & 2032
- Figure 75: Middle East and Africa Low Foam Surfactants Industry Revenue (Million), by End-user Industry 2024 & 2032
- Figure 76: Middle East and Africa Low Foam Surfactants Industry Volume (liter ), by End-user Industry 2024 & 2032
- Figure 77: Middle East and Africa Low Foam Surfactants Industry Revenue Share (%), by End-user Industry 2024 & 2032
- Figure 78: Middle East and Africa Low Foam Surfactants Industry Volume Share (%), by End-user Industry 2024 & 2032
- Figure 79: Middle East and Africa Low Foam Surfactants Industry Revenue (Million), by Country 2024 & 2032
- Figure 80: Middle East and Africa Low Foam Surfactants Industry Volume (liter ), by Country 2024 & 2032
- Figure 81: Middle East and Africa Low Foam Surfactants Industry Revenue Share (%), by Country 2024 & 2032
- Figure 82: Middle East and Africa Low Foam Surfactants Industry Volume Share (%), by Country 2024 & 2032
List of Tables
- Table 1: Global Low Foam Surfactants Industry Revenue Million Forecast, by Region 2019 & 2032
- Table 2: Global Low Foam Surfactants Industry Volume liter Forecast, by Region 2019 & 2032
- Table 3: Global Low Foam Surfactants Industry Revenue Million Forecast, by Type 2019 & 2032
- Table 4: Global Low Foam Surfactants Industry Volume liter Forecast, by Type 2019 & 2032
- Table 5: Global Low Foam Surfactants Industry Revenue Million Forecast, by End-user Industry 2019 & 2032
- Table 6: Global Low Foam Surfactants Industry Volume liter Forecast, by End-user Industry 2019 & 2032
- Table 7: Global Low Foam Surfactants Industry Revenue Million Forecast, by Region 2019 & 2032
- Table 8: Global Low Foam Surfactants Industry Volume liter Forecast, by Region 2019 & 2032
- Table 9: Global Low Foam Surfactants Industry Revenue Million Forecast, by Country 2019 & 2032
- Table 10: Global Low Foam Surfactants Industry Volume liter Forecast, by Country 2019 & 2032
- Table 11: China Low Foam Surfactants Industry Revenue (Million) Forecast, by Application 2019 & 2032
- Table 12: China Low Foam Surfactants Industry Volume (liter ) Forecast, by Application 2019 & 2032
- Table 13: India Low Foam Surfactants Industry Revenue (Million) Forecast, by Application 2019 & 2032
- Table 14: India Low Foam Surfactants Industry Volume (liter ) Forecast, by Application 2019 & 2032
- Table 15: Japan Low Foam Surfactants Industry Revenue (Million) Forecast, by Application 2019 & 2032
- Table 16: Japan Low Foam Surfactants Industry Volume (liter ) Forecast, by Application 2019 & 2032
- Table 17: South Korea Low Foam Surfactants Industry Revenue (Million) Forecast, by Application 2019 & 2032
- Table 18: South Korea Low Foam Surfactants Industry Volume (liter ) Forecast, by Application 2019 & 2032
- Table 19: Rest of Asia Pacific Low Foam Surfactants Industry Revenue (Million) Forecast, by Application 2019 & 2032
- Table 20: Rest of Asia Pacific Low Foam Surfactants Industry Volume (liter ) Forecast, by Application 2019 & 2032
- Table 21: Global Low Foam Surfactants Industry Revenue Million Forecast, by Country 2019 & 2032
- Table 22: Global Low Foam Surfactants Industry Volume liter Forecast, by Country 2019 & 2032
- Table 23: United States Low Foam Surfactants Industry Revenue (Million) Forecast, by Application 2019 & 2032
- Table 24: United States Low Foam Surfactants Industry Volume (liter ) Forecast, by Application 2019 & 2032
- Table 25: Canada Low Foam Surfactants Industry Revenue (Million) Forecast, by Application 2019 & 2032
- Table 26: Canada Low Foam Surfactants Industry Volume (liter ) Forecast, by Application 2019 & 2032
- Table 27: Mexico Low Foam Surfactants Industry Revenue (Million) Forecast, by Application 2019 & 2032
- Table 28: Mexico Low Foam Surfactants Industry Volume (liter ) Forecast, by Application 2019 & 2032
- Table 29: Global Low Foam Surfactants Industry Revenue Million Forecast, by Country 2019 & 2032
- Table 30: Global Low Foam Surfactants Industry Volume liter Forecast, by Country 2019 & 2032
- Table 31: Germany Low Foam Surfactants Industry Revenue (Million) Forecast, by Application 2019 & 2032
- Table 32: Germany Low Foam Surfactants Industry Volume (liter ) Forecast, by Application 2019 & 2032
- Table 33: United Kingdom Low Foam Surfactants Industry Revenue (Million) Forecast, by Application 2019 & 2032
- Table 34: United Kingdom Low Foam Surfactants Industry Volume (liter ) Forecast, by Application 2019 & 2032
- Table 35: Italy Low Foam Surfactants Industry Revenue (Million) Forecast, by Application 2019 & 2032
- Table 36: Italy Low Foam Surfactants Industry Volume (liter ) Forecast, by Application 2019 & 2032
- Table 37: France Low Foam Surfactants Industry Revenue (Million) Forecast, by Application 2019 & 2032
- Table 38: France Low Foam Surfactants Industry Volume (liter ) Forecast, by Application 2019 & 2032
- Table 39: Rest of Europe Low Foam Surfactants Industry Revenue (Million) Forecast, by Application 2019 & 2032
- Table 40: Rest of Europe Low Foam Surfactants Industry Volume (liter ) Forecast, by Application 2019 & 2032
- Table 41: Global Low Foam Surfactants Industry Revenue Million Forecast, by Country 2019 & 2032
- Table 42: Global Low Foam Surfactants Industry Volume liter Forecast, by Country 2019 & 2032
- Table 43: Brazil Low Foam Surfactants Industry Revenue (Million) Forecast, by Application 2019 & 2032
- Table 44: Brazil Low Foam Surfactants Industry Volume (liter ) Forecast, by Application 2019 & 2032
- Table 45: Argentina Low Foam Surfactants Industry Revenue (Million) Forecast, by Application 2019 & 2032
- Table 46: Argentina Low Foam Surfactants Industry Volume (liter ) Forecast, by Application 2019 & 2032
- Table 47: Rest of South America Low Foam Surfactants Industry Revenue (Million) Forecast, by Application 2019 & 2032
- Table 48: Rest of South America Low Foam Surfactants Industry Volume (liter ) Forecast, by Application 2019 & 2032
- Table 49: Global Low Foam Surfactants Industry Revenue Million Forecast, by Country 2019 & 2032
- Table 50: Global Low Foam Surfactants Industry Volume liter Forecast, by Country 2019 & 2032
- Table 51: Saudi Arabia Low Foam Surfactants Industry Revenue (Million) Forecast, by Application 2019 & 2032
- Table 52: Saudi Arabia Low Foam Surfactants Industry Volume (liter ) Forecast, by Application 2019 & 2032
- Table 53: South Africa Low Foam Surfactants Industry Revenue (Million) Forecast, by Application 2019 & 2032
- Table 54: South Africa Low Foam Surfactants Industry Volume (liter ) Forecast, by Application 2019 & 2032
- Table 55: Rest of Middle East and Africa Low Foam Surfactants Industry Revenue (Million) Forecast, by Application 2019 & 2032
- Table 56: Rest of Middle East and Africa Low Foam Surfactants Industry Volume (liter ) Forecast, by Application 2019 & 2032
- Table 57: Global Low Foam Surfactants Industry Revenue Million Forecast, by Type 2019 & 2032
- Table 58: Global Low Foam Surfactants Industry Volume liter Forecast, by Type 2019 & 2032
- Table 59: Global Low Foam Surfactants Industry Revenue Million Forecast, by End-user Industry 2019 & 2032
- Table 60: Global Low Foam Surfactants Industry Volume liter Forecast, by End-user Industry 2019 & 2032
- Table 61: Global Low Foam Surfactants Industry Revenue Million Forecast, by Country 2019 & 2032
- Table 62: Global Low Foam Surfactants Industry Volume liter Forecast, by Country 2019 & 2032
- Table 63: China Low Foam Surfactants Industry Revenue (Million) Forecast, by Application 2019 & 2032
- Table 64: China Low Foam Surfactants Industry Volume (liter ) Forecast, by Application 2019 & 2032
- Table 65: India Low Foam Surfactants Industry Revenue (Million) Forecast, by Application 2019 & 2032
- Table 66: India Low Foam Surfactants Industry Volume (liter ) Forecast, by Application 2019 & 2032
- Table 67: Japan Low Foam Surfactants Industry Revenue (Million) Forecast, by Application 2019 & 2032
- Table 68: Japan Low Foam Surfactants Industry Volume (liter ) Forecast, by Application 2019 & 2032
- Table 69: South Korea Low Foam Surfactants Industry Revenue (Million) Forecast, by Application 2019 & 2032
- Table 70: South Korea Low Foam Surfactants Industry Volume (liter ) Forecast, by Application 2019 & 2032
- Table 71: Rest of Asia Pacific Low Foam Surfactants Industry Revenue (Million) Forecast, by Application 2019 & 2032
- Table 72: Rest of Asia Pacific Low Foam Surfactants Industry Volume (liter ) Forecast, by Application 2019 & 2032
- Table 73: Global Low Foam Surfactants Industry Revenue Million Forecast, by Type 2019 & 2032
- Table 74: Global Low Foam Surfactants Industry Volume liter Forecast, by Type 2019 & 2032
- Table 75: Global Low Foam Surfactants Industry Revenue Million Forecast, by End-user Industry 2019 & 2032
- Table 76: Global Low Foam Surfactants Industry Volume liter Forecast, by End-user Industry 2019 & 2032
- Table 77: Global Low Foam Surfactants Industry Revenue Million Forecast, by Country 2019 & 2032
- Table 78: Global Low Foam Surfactants Industry Volume liter Forecast, by Country 2019 & 2032
- Table 79: United States Low Foam Surfactants Industry Revenue (Million) Forecast, by Application 2019 & 2032
- Table 80: United States Low Foam Surfactants Industry Volume (liter ) Forecast, by Application 2019 & 2032
- Table 81: Canada Low Foam Surfactants Industry Revenue (Million) Forecast, by Application 2019 & 2032
- Table 82: Canada Low Foam Surfactants Industry Volume (liter ) Forecast, by Application 2019 & 2032
- Table 83: Mexico Low Foam Surfactants Industry Revenue (Million) Forecast, by Application 2019 & 2032
- Table 84: Mexico Low Foam Surfactants Industry Volume (liter ) Forecast, by Application 2019 & 2032
- Table 85: Global Low Foam Surfactants Industry Revenue Million Forecast, by Type 2019 & 2032
- Table 86: Global Low Foam Surfactants Industry Volume liter Forecast, by Type 2019 & 2032
- Table 87: Global Low Foam Surfactants Industry Revenue Million Forecast, by End-user Industry 2019 & 2032
- Table 88: Global Low Foam Surfactants Industry Volume liter Forecast, by End-user Industry 2019 & 2032
- Table 89: Global Low Foam Surfactants Industry Revenue Million Forecast, by Country 2019 & 2032
- Table 90: Global Low Foam Surfactants Industry Volume liter Forecast, by Country 2019 & 2032
- Table 91: Germany Low Foam Surfactants Industry Revenue (Million) Forecast, by Application 2019 & 2032
- Table 92: Germany Low Foam Surfactants Industry Volume (liter ) Forecast, by Application 2019 & 2032
- Table 93: United Kingdom Low Foam Surfactants Industry Revenue (Million) Forecast, by Application 2019 & 2032
- Table 94: United Kingdom Low Foam Surfactants Industry Volume (liter ) Forecast, by Application 2019 & 2032
- Table 95: Italy Low Foam Surfactants Industry Revenue (Million) Forecast, by Application 2019 & 2032
- Table 96: Italy Low Foam Surfactants Industry Volume (liter ) Forecast, by Application 2019 & 2032
- Table 97: France Low Foam Surfactants Industry Revenue (Million) Forecast, by Application 2019 & 2032
- Table 98: France Low Foam Surfactants Industry Volume (liter ) Forecast, by Application 2019 & 2032
- Table 99: Rest of Europe Low Foam Surfactants Industry Revenue (Million) Forecast, by Application 2019 & 2032
- Table 100: Rest of Europe Low Foam Surfactants Industry Volume (liter ) Forecast, by Application 2019 & 2032
- Table 101: Global Low Foam Surfactants Industry Revenue Million Forecast, by Type 2019 & 2032
- Table 102: Global Low Foam Surfactants Industry Volume liter Forecast, by Type 2019 & 2032
- Table 103: Global Low Foam Surfactants Industry Revenue Million Forecast, by End-user Industry 2019 & 2032
- Table 104: Global Low Foam Surfactants Industry Volume liter Forecast, by End-user Industry 2019 & 2032
- Table 105: Global Low Foam Surfactants Industry Revenue Million Forecast, by Country 2019 & 2032
- Table 106: Global Low Foam Surfactants Industry Volume liter Forecast, by Country 2019 & 2032
- Table 107: Brazil Low Foam Surfactants Industry Revenue (Million) Forecast, by Application 2019 & 2032
- Table 108: Brazil Low Foam Surfactants Industry Volume (liter ) Forecast, by Application 2019 & 2032
- Table 109: Argentina Low Foam Surfactants Industry Revenue (Million) Forecast, by Application 2019 & 2032
- Table 110: Argentina Low Foam Surfactants Industry Volume (liter ) Forecast, by Application 2019 & 2032
- Table 111: Rest of South America Low Foam Surfactants Industry Revenue (Million) Forecast, by Application 2019 & 2032
- Table 112: Rest of South America Low Foam Surfactants Industry Volume (liter ) Forecast, by Application 2019 & 2032
- Table 113: Global Low Foam Surfactants Industry Revenue Million Forecast, by Type 2019 & 2032
- Table 114: Global Low Foam Surfactants Industry Volume liter Forecast, by Type 2019 & 2032
- Table 115: Global Low Foam Surfactants Industry Revenue Million Forecast, by End-user Industry 2019 & 2032
- Table 116: Global Low Foam Surfactants Industry Volume liter Forecast, by End-user Industry 2019 & 2032
- Table 117: Global Low Foam Surfactants Industry Revenue Million Forecast, by Country 2019 & 2032
- Table 118: Global Low Foam Surfactants Industry Volume liter Forecast, by Country 2019 & 2032
- Table 119: Saudi Arabia Low Foam Surfactants Industry Revenue (Million) Forecast, by Application 2019 & 2032
- Table 120: Saudi Arabia Low Foam Surfactants Industry Volume (liter ) Forecast, by Application 2019 & 2032
- Table 121: South Africa Low Foam Surfactants Industry Revenue (Million) Forecast, by Application 2019 & 2032
- Table 122: South Africa Low Foam Surfactants Industry Volume (liter ) Forecast, by Application 2019 & 2032
- Table 123: Rest of Middle East and Africa Low Foam Surfactants Industry Revenue (Million) Forecast, by Application 2019 & 2032
- Table 124: Rest of Middle East and Africa Low Foam Surfactants Industry Volume (liter ) Forecast, by Application 2019 & 2032
Frequently Asked Questions
1. What is the projected Compound Annual Growth Rate (CAGR) of the Low Foam Surfactants Industry?
The projected CAGR is approximately > 4.00%.
2. Which companies are prominent players in the Low Foam Surfactants Industry?
Key companies in the market include AkzoNobel N V, Nufarm, Solvay, Croda International plc, Evonik Industries AG, BASF SE, Huntsman International LLC, Dow, KAO CORPORATION, Oxiteno SA, Stepan Company*List Not Exhaustive, Clariant AG.
3. What are the main segments of the Low Foam Surfactants Industry?
The market segments include Type, End-user Industry.
4. Can you provide details about the market size?
The market size is estimated to be USD 14.35 Million as of 2022.
5. What are some drivers contributing to market growth?
Significant Growth in Detergents and Cleaning Agents; Increased Demand for Sustainable Surfactants; The rising demand for personal care products.
6. What are the notable trends driving market growth?
Detergents and Cleaning Agents End-user Industry Segment to Dominate the Market.
7. Are there any restraints impacting market growth?
The Stringent Enviornmental Regulations; The Availability of Other Substitutes.
8. Can you provide examples of recent developments in the market?
April 2022: BASF SE announced the expansion of a new line of products, such as Dehypound M and Dehypound HDG. These high-performance nonionic surfactant blends are used for multi-soil, multi-application cleaning, and degreasing.
9. What pricing options are available for accessing the report?
Pricing options include single-user, multi-user, and enterprise licenses priced at USD 4750, USD 5250, and USD 8750 respectively.
10. Is the market size provided in terms of value or volume?
The market size is provided in terms of value, measured in Million and volume, measured in liter .
11. Are there any specific market keywords associated with the report?
Yes, the market keyword associated with the report is "Low Foam Surfactants Industry," which aids in identifying and referencing the specific market segment covered.
12. How do I determine which pricing option suits my needs best?
The pricing options vary based on user requirements and access needs. Individual users may opt for single-user licenses, while businesses requiring broader access may choose multi-user or enterprise licenses for cost-effective access to the report.
13. Are there any additional resources or data provided in the Low Foam Surfactants Industry report?
While the report offers comprehensive insights, it's advisable to review the specific contents or supplementary materials provided to ascertain if additional resources or data are available.
14. How can I stay updated on further developments or reports in the Low Foam Surfactants Industry?
To stay informed about further developments, trends, and reports in the Low Foam Surfactants Industry, consider subscribing to industry newsletters, following relevant companies and organizations, or regularly checking reputable industry news sources and publications.
Methodology
Step 1 - Identification of Relevant Samples Size from Population Database


Step 2 - Approaches for Defining Global Market Size (Value, Volume* & Price*)

Note*: In applicable scenarios
Step 3 - Data Sources
Primary Research
- Web Analytics
- Survey Reports
- Research Institute
- Latest Research Reports
- Opinion Leaders
Secondary Research
- Annual Reports
- White Paper
- Latest Press Release
- Industry Association
- Paid Database
- Investor Presentations

Step 4 - Data Triangulation
Involves using different sources of information in order to increase the validity of a study
These sources are likely to be stakeholders in a program - participants, other researchers, program staff, other community members, and so on.
Then we put all data in single framework & apply various statistical tools to find out the dynamic on the market.
During the analysis stage, feedback from the stakeholder groups would be compared to determine areas of agreement as well as areas of divergence
