

Key Insights
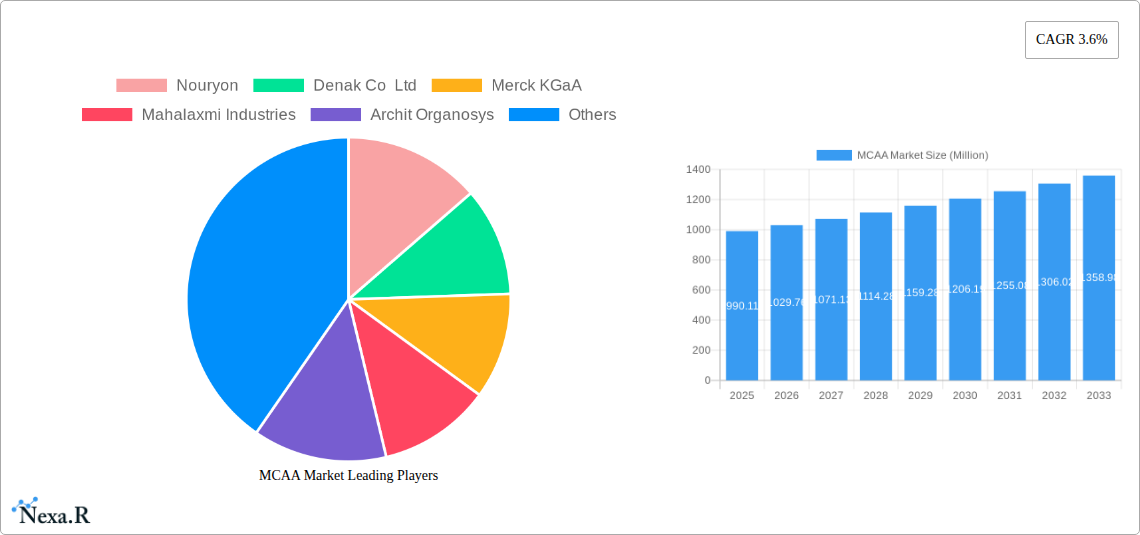
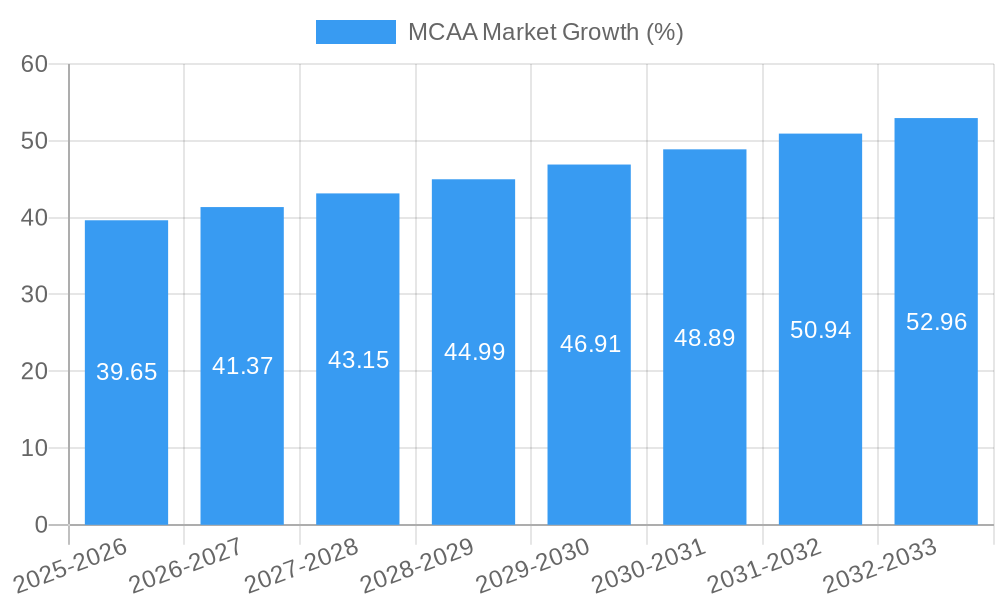
The Mono Chloro Acetic Acid (MCAA) market, valued at $990.11 million in 2025, is projected to experience steady growth, driven by its diverse applications across various industries. A compound annual growth rate (CAGR) of 3.6% from 2025 to 2033 indicates a consistent market expansion. Key drivers include the increasing demand for MCAA in the personal care and pharmaceutical sectors, where it serves as a crucial intermediate in the synthesis of various compounds. The agrochemical industry also significantly contributes to MCAA consumption, owing to its use in herbicides and pesticides. Growth in the geological drilling segment, utilizing MCAA for enhanced oil recovery and well stimulation, further fuels market expansion. While challenges such as stringent environmental regulations and the availability of substitute chemicals exist, the overall market outlook remains positive. The market is segmented by chemical application (Glycine, Carboxymethylcellulose (CMC), Surfactants, 2,4-Dichloro Phenoxy Acetic Acid, Thioglycolic Acid, and Others) and end-user industry (Personal Care & Pharmaceuticals, Agrochemicals, Geological Drillings, Dyes & Detergents, and Others). Leading players such as Nouryon, Merck KGaA, and others compete through innovation and strategic partnerships to capture market share. Geographic expansion, particularly in the Asia-Pacific region driven by rising industrialization and economic growth, presents significant opportunities for market growth in the coming years.
The competitive landscape is characterized by a mix of established multinational corporations and regional players. These companies are focusing on research and development to develop more efficient and sustainable MCAA production processes. Furthermore, strategic collaborations and acquisitions are becoming increasingly prevalent as companies seek to expand their product portfolios and geographic reach. The increasing awareness of the environmental impact of chemical production is driving the adoption of sustainable practices within the MCAA industry. Companies are investing in green technologies and sustainable sourcing of raw materials to minimize their environmental footprint and comply with stricter regulations. This trend is expected to further shape the market dynamics in the years to come, promoting both responsible growth and innovation within the MCAA sector.
MCAA Market: A Comprehensive Market Report (2019-2033)
This in-depth report provides a comprehensive analysis of the Monochloroacetic Acid (MCAA) market, offering valuable insights for industry professionals, investors, and strategic decision-makers. With a focus on market dynamics, growth trends, and competitive landscape, this report covers the period from 2019 to 2033, with a base year of 2025 and a forecast period from 2025 to 2033. The report utilizes data from the historical period (2019-2024) to provide a robust foundation for future projections. The MCAA market is segmented by chemical application (Glycine, Carboxymethylcellulose (CMC), Surfactants, 2,4-Dichloro Phenoxy Acetic Acid, Thioglycol Acid, Other Applications) and end-user industry (Personal Care and Pharmaceuticals, Agrochemicals, Geological Drillings, Dyes and Detergents, Other End-user Industries). Key players analyzed include Nouryon, Denak Co Ltd, Merck KGaA, Mahalaxmi Industries, Archit Organosys, Jiangxi Biochem Co Ltd, Alfa Aesar Thermo Fisher Scientific, Meridian Chem Bond Pvt Ltd, TerraTech, PCC Group, Henan HDF Chemical Company Ltd, ITALMAR (THAILAND) CO LTD, and Shandong Minji New Material Technology Co Ltd. The report projects a total market value of xx Million by 2033.
MCAA Market Dynamics & Structure
The MCAA market is characterized by moderate concentration, with a few major players holding significant market share. Technological innovation is a key driver, with companies investing in more efficient and sustainable production methods. Stringent regulatory frameworks concerning chemical handling and environmental impact influence market operations. Competitive substitutes exist, posing challenges for MCAA producers. End-user demographics and preferences significantly impact demand across different segments. M&A activity has been moderate, with strategic partnerships and joint ventures driving consolidation.
- Market Concentration: The top 5 players account for approximately xx% of the global market share in 2025.
- Technological Innovation: Focus on improving production efficiency, reducing waste, and developing environmentally friendly alternatives.
- Regulatory Landscape: Stringent environmental regulations and safety standards are impacting production methods and costs.
- Competitive Substitutes: The availability of alternative chemicals limits MCAA's market penetration in certain applications.
- M&A Activity: A moderate number of mergers and acquisitions have been observed in the recent past, driven by strategic expansion and technology integration.
MCAA Market Growth Trends & Insights
The MCAA market experienced a CAGR of xx% during the historical period (2019-2024) and is projected to maintain a CAGR of xx% during the forecast period (2025-2033), reaching a market value of xx Million by 2033. Growth is driven by increasing demand from key end-user industries, particularly in agrochemicals and personal care. Technological advancements are leading to the development of more efficient and sustainable MCAA production processes. Consumer preferences for natural and eco-friendly products are influencing demand in specific application segments.
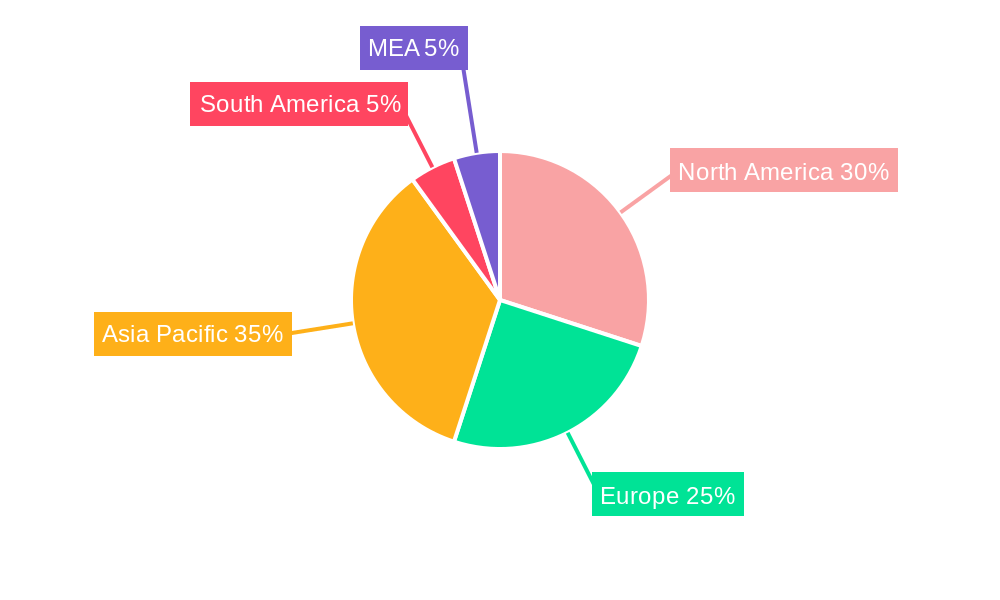
Dominant Regions, Countries, or Segments in MCAA Market
The Asia-Pacific region is expected to dominate the MCAA market throughout the forecast period, driven by strong growth in India and China. Within chemical applications, the personal care and pharmaceutical segments are the largest contributors to market growth.
- Key Drivers in Asia-Pacific: Rapid industrialization, rising disposable incomes, and increasing demand from the agrochemical sector.
- Dominant Chemical Application: Personal care and pharmaceutical applications are the largest consumers of MCAA due to its use in various formulations and active ingredients.
- Growth Potential: Emerging economies in Southeast Asia and other regions present significant opportunities for market expansion.
MCAA Market Product Landscape
MCAA is primarily produced through chlorination of acetic acid. Recent innovations focus on improving yield, purity, and reducing environmental impact. The market offers various grades of MCAA catering to specific applications. Unique selling propositions include purity, consistency, and customized solutions for specific customer needs. Technological advancements emphasize continuous process optimization and integration of sustainable practices.
Key Drivers, Barriers & Challenges in MCAA Market
Key Drivers: Growing demand from the agrochemical and personal care industries, coupled with technological advancements in production processes and increasing awareness of MCAA's applications.
Key Challenges: Fluctuations in raw material prices, stringent environmental regulations, and intense competition from substitute chemicals. These factors impose significant cost pressure and limit profitability.
Emerging Opportunities in MCAA Market
Untapped markets in developing economies, innovative applications in specialty chemicals, and growing consumer preference for sustainable products offer significant opportunities for market expansion. Development of novel MCAA-based products and expansion into new application areas hold significant potential.
Growth Accelerators in the MCAA Market Industry
Technological breakthroughs in production efficiency, coupled with strategic partnerships and collaborations among key players, are crucial growth catalysts. Market expansion strategies focused on developing and emerging economies will further accelerate market growth.
Key Players Shaping the MCAA Market Market
- Nouryon
- Denak Co Ltd
- Merck KGaA
- Mahalaxmi Industries
- Archit Organosys
- Jiangxi Biochem Co Ltd
- Alfa Aesar Thermo Fisher Scientific
- Meridian Chem Bond Pvt Ltd
- TerraTech
- PCC Group
- Henan HDF Chemical Company Ltd
- ITALMAR (THAILAND) CO LTD
- Shandong Minji New Material Technology Co Ltd
Notable Milestones in MCAA Market Sector
- September 2021: Archit Organosys announced a capacity expansion of 12,000 tpa at its Bhavnagar plant, indicating increasing demand.
- April 2021: Atul Limited and Nouryon launched a joint venture with a 32,000-ton annual production capacity, addressing the growing Indian market demand.
In-Depth MCAA Market Market Outlook
The MCAA market is poised for substantial growth driven by technological innovation, strategic partnerships, and increasing demand from various end-user industries. Strategic market expansion into untapped markets and development of innovative applications will further contribute to long-term market growth and profitability. The potential for new product development and improvement of existing processes offers considerable scope for future advancement in this sector.
MCAA Market Segmentation
-
1. Chemical Application
- 1.1. Glycine
- 1.2. Carboxymethylcellulose (CMC)
- 1.3. Surfactants
- 1.4. 2,4-Dichloro Phenoxy Acetic Acid
- 1.5. Thioglycol Acid
- 1.6. Other Applications
-
2. End-user Industry
- 2.1. Personal Care and Pharmaceuticals
- 2.2. Agrochemicals
- 2.3. Geological Drillings
- 2.4. Dyes and Detergents
- 2.5. Other End-user Industries
MCAA Market Segmentation By Geography
-
1. Asia Pacific
- 1.1. China
- 1.2. India
- 1.3. Japan
- 1.4. South Korea
- 1.5. Malaysia
- 1.6. Thailand
- 1.7. Indonesia
- 1.8. Vietnam
- 1.9. Rest of Asia Pacific
-
2. North America
- 2.1. United States
- 2.2. Canada
- 2.3. Mexico
-
3. Europe
- 3.1. Germany
- 3.2. United Kingdom
- 3.3. Italy
- 3.4. France
- 3.5. Spain
- 3.6. Nordic Countries
- 3.7. Turkey
- 3.8. Russia
- 3.9. Rest of Europe
-
4. South America
- 4.1. Brazil
- 4.2. Argentina
- 4.3. Colombia
- 4.4. Rest of South America
-
5. Middle East and Africa
- 5.1. Saudi Arabia
- 5.2. Qatar
- 5.3. United Arab Emirates
- 5.4. Nigeria
- 5.5. Egypt
- 5.6. South Africa
- 5.7. Rest of Middle East and Africa
MCAA Market REPORT HIGHLIGHTS
| Aspects | Details |
|---|---|
| Study Period | 2019-2033 |
| Base Year | 2024 |
| Estimated Year | 2025 |
| Forecast Period | 2025-2033 |
| Historical Period | 2019-2024 |
| Growth Rate | CAGR of 3.6% from 2019-2033 |
| Segmentation |
|
Table of Contents
- 1. Introduction
- 1.1. Research Scope
- 1.2. Market Segmentation
- 1.3. Research Methodology
- 1.4. Definitions and Assumptions
- 2. Executive Summary
- 2.1. Introduction
- 3. Market Dynamics
- 3.1. Introduction
- 3.2. Market Drivers
- 3.2.1. Growing consumption from the pharmaceutical Industry; Growing production of agrochemical in the country
- 3.3. Market Restrains
- 3.3.1. Decline in detergent consumption
- 3.4. Market Trends
- 3.4.1. Increasing Demand from Personal Care and Pharmaceuticals Industries
- 4. Market Factor Analysis
- 4.1. Porters Five Forces
- 4.2. Supply/Value Chain
- 4.3. PESTEL analysis
- 4.4. Market Entropy
- 4.5. Patent/Trademark Analysis
- 5. Global MCAA Market Analysis, Insights and Forecast, 2019-2031
- 5.1. Market Analysis, Insights and Forecast - by Chemical Application
- 5.1.1. Glycine
- 5.1.2. Carboxymethylcellulose (CMC)
- 5.1.3. Surfactants
- 5.1.4. 2,4-Dichloro Phenoxy Acetic Acid
- 5.1.5. Thioglycol Acid
- 5.1.6. Other Applications
- 5.2. Market Analysis, Insights and Forecast - by End-user Industry
- 5.2.1. Personal Care and Pharmaceuticals
- 5.2.2. Agrochemicals
- 5.2.3. Geological Drillings
- 5.2.4. Dyes and Detergents
- 5.2.5. Other End-user Industries
- 5.3. Market Analysis, Insights and Forecast - by Region
- 5.3.1. Asia Pacific
- 5.3.2. North America
- 5.3.3. Europe
- 5.3.4. South America
- 5.3.5. Middle East and Africa
- 5.1. Market Analysis, Insights and Forecast - by Chemical Application
- 6. Asia Pacific MCAA Market Analysis, Insights and Forecast, 2019-2031
- 6.1. Market Analysis, Insights and Forecast - by Chemical Application
- 6.1.1. Glycine
- 6.1.2. Carboxymethylcellulose (CMC)
- 6.1.3. Surfactants
- 6.1.4. 2,4-Dichloro Phenoxy Acetic Acid
- 6.1.5. Thioglycol Acid
- 6.1.6. Other Applications
- 6.2. Market Analysis, Insights and Forecast - by End-user Industry
- 6.2.1. Personal Care and Pharmaceuticals
- 6.2.2. Agrochemicals
- 6.2.3. Geological Drillings
- 6.2.4. Dyes and Detergents
- 6.2.5. Other End-user Industries
- 6.1. Market Analysis, Insights and Forecast - by Chemical Application
- 7. North America MCAA Market Analysis, Insights and Forecast, 2019-2031
- 7.1. Market Analysis, Insights and Forecast - by Chemical Application
- 7.1.1. Glycine
- 7.1.2. Carboxymethylcellulose (CMC)
- 7.1.3. Surfactants
- 7.1.4. 2,4-Dichloro Phenoxy Acetic Acid
- 7.1.5. Thioglycol Acid
- 7.1.6. Other Applications
- 7.2. Market Analysis, Insights and Forecast - by End-user Industry
- 7.2.1. Personal Care and Pharmaceuticals
- 7.2.2. Agrochemicals
- 7.2.3. Geological Drillings
- 7.2.4. Dyes and Detergents
- 7.2.5. Other End-user Industries
- 7.1. Market Analysis, Insights and Forecast - by Chemical Application
- 8. Europe MCAA Market Analysis, Insights and Forecast, 2019-2031
- 8.1. Market Analysis, Insights and Forecast - by Chemical Application
- 8.1.1. Glycine
- 8.1.2. Carboxymethylcellulose (CMC)
- 8.1.3. Surfactants
- 8.1.4. 2,4-Dichloro Phenoxy Acetic Acid
- 8.1.5. Thioglycol Acid
- 8.1.6. Other Applications
- 8.2. Market Analysis, Insights and Forecast - by End-user Industry
- 8.2.1. Personal Care and Pharmaceuticals
- 8.2.2. Agrochemicals
- 8.2.3. Geological Drillings
- 8.2.4. Dyes and Detergents
- 8.2.5. Other End-user Industries
- 8.1. Market Analysis, Insights and Forecast - by Chemical Application
- 9. South America MCAA Market Analysis, Insights and Forecast, 2019-2031
- 9.1. Market Analysis, Insights and Forecast - by Chemical Application
- 9.1.1. Glycine
- 9.1.2. Carboxymethylcellulose (CMC)
- 9.1.3. Surfactants
- 9.1.4. 2,4-Dichloro Phenoxy Acetic Acid
- 9.1.5. Thioglycol Acid
- 9.1.6. Other Applications
- 9.2. Market Analysis, Insights and Forecast - by End-user Industry
- 9.2.1. Personal Care and Pharmaceuticals
- 9.2.2. Agrochemicals
- 9.2.3. Geological Drillings
- 9.2.4. Dyes and Detergents
- 9.2.5. Other End-user Industries
- 9.1. Market Analysis, Insights and Forecast - by Chemical Application
- 10. Middle East and Africa MCAA Market Analysis, Insights and Forecast, 2019-2031
- 10.1. Market Analysis, Insights and Forecast - by Chemical Application
- 10.1.1. Glycine
- 10.1.2. Carboxymethylcellulose (CMC)
- 10.1.3. Surfactants
- 10.1.4. 2,4-Dichloro Phenoxy Acetic Acid
- 10.1.5. Thioglycol Acid
- 10.1.6. Other Applications
- 10.2. Market Analysis, Insights and Forecast - by End-user Industry
- 10.2.1. Personal Care and Pharmaceuticals
- 10.2.2. Agrochemicals
- 10.2.3. Geological Drillings
- 10.2.4. Dyes and Detergents
- 10.2.5. Other End-user Industries
- 10.1. Market Analysis, Insights and Forecast - by Chemical Application
- 11. North America MCAA Market Analysis, Insights and Forecast, 2019-2031
- 11.1. Market Analysis, Insights and Forecast - By Country/Sub-region
- 11.1.1 United States
- 11.1.2 Canada
- 11.1.3 Mexico
- 12. Europe MCAA Market Analysis, Insights and Forecast, 2019-2031
- 12.1. Market Analysis, Insights and Forecast - By Country/Sub-region
- 12.1.1 Germany
- 12.1.2 France
- 12.1.3 Italy
- 12.1.4 United Kingdom
- 12.1.5 Netherlands
- 12.1.6 Rest of Europe
- 13. Asia Pacific MCAA Market Analysis, Insights and Forecast, 2019-2031
- 13.1. Market Analysis, Insights and Forecast - By Country/Sub-region
- 13.1.1 China
- 13.1.2 Japan
- 13.1.3 India
- 13.1.4 South Korea
- 13.1.5 Taiwan
- 13.1.6 Australia
- 13.1.7 Rest of Asia-Pacific
- 14. South America MCAA Market Analysis, Insights and Forecast, 2019-2031
- 14.1. Market Analysis, Insights and Forecast - By Country/Sub-region
- 14.1.1 Brazil
- 14.1.2 Argentina
- 14.1.3 Rest of South America
- 15. MEA MCAA Market Analysis, Insights and Forecast, 2019-2031
- 15.1. Market Analysis, Insights and Forecast - By Country/Sub-region
- 15.1.1 Middle East
- 15.1.2 Africa
- 16. Competitive Analysis
- 16.1. Global Market Share Analysis 2024
- 16.2. Company Profiles
- 16.2.1 Nouryon
- 16.2.1.1. Overview
- 16.2.1.2. Products
- 16.2.1.3. SWOT Analysis
- 16.2.1.4. Recent Developments
- 16.2.1.5. Financials (Based on Availability)
- 16.2.2 Denak Co Ltd
- 16.2.2.1. Overview
- 16.2.2.2. Products
- 16.2.2.3. SWOT Analysis
- 16.2.2.4. Recent Developments
- 16.2.2.5. Financials (Based on Availability)
- 16.2.3 Merck KGaA
- 16.2.3.1. Overview
- 16.2.3.2. Products
- 16.2.3.3. SWOT Analysis
- 16.2.3.4. Recent Developments
- 16.2.3.5. Financials (Based on Availability)
- 16.2.4 Mahalaxmi Industries
- 16.2.4.1. Overview
- 16.2.4.2. Products
- 16.2.4.3. SWOT Analysis
- 16.2.4.4. Recent Developments
- 16.2.4.5. Financials (Based on Availability)
- 16.2.5 Archit Organosys
- 16.2.5.1. Overview
- 16.2.5.2. Products
- 16.2.5.3. SWOT Analysis
- 16.2.5.4. Recent Developments
- 16.2.5.5. Financials (Based on Availability)
- 16.2.6 Jiangxi Biochem Co Ltd
- 16.2.6.1. Overview
- 16.2.6.2. Products
- 16.2.6.3. SWOT Analysis
- 16.2.6.4. Recent Developments
- 16.2.6.5. Financials (Based on Availability)
- 16.2.7 Alfa Aesar Thermo Fisher Scientific
- 16.2.7.1. Overview
- 16.2.7.2. Products
- 16.2.7.3. SWOT Analysis
- 16.2.7.4. Recent Developments
- 16.2.7.5. Financials (Based on Availability)
- 16.2.8 Meridian Chem Bond Pvt Ltd
- 16.2.8.1. Overview
- 16.2.8.2. Products
- 16.2.8.3. SWOT Analysis
- 16.2.8.4. Recent Developments
- 16.2.8.5. Financials (Based on Availability)
- 16.2.9 TerraTech
- 16.2.9.1. Overview
- 16.2.9.2. Products
- 16.2.9.3. SWOT Analysis
- 16.2.9.4. Recent Developments
- 16.2.9.5. Financials (Based on Availability)
- 16.2.10 PCC Group
- 16.2.10.1. Overview
- 16.2.10.2. Products
- 16.2.10.3. SWOT Analysis
- 16.2.10.4. Recent Developments
- 16.2.10.5. Financials (Based on Availability)
- 16.2.11 Henan HDF Chemical CompanyLtd
- 16.2.11.1. Overview
- 16.2.11.2. Products
- 16.2.11.3. SWOT Analysis
- 16.2.11.4. Recent Developments
- 16.2.11.5. Financials (Based on Availability)
- 16.2.12 ITALMAR (THAILAND) CO LTD
- 16.2.12.1. Overview
- 16.2.12.2. Products
- 16.2.12.3. SWOT Analysis
- 16.2.12.4. Recent Developments
- 16.2.12.5. Financials (Based on Availability)
- 16.2.13 Shandong Minji New Material Technology Co Ltd
- 16.2.13.1. Overview
- 16.2.13.2. Products
- 16.2.13.3. SWOT Analysis
- 16.2.13.4. Recent Developments
- 16.2.13.5. Financials (Based on Availability)
- 16.2.1 Nouryon
List of Figures
- Figure 1: Global MCAA Market Revenue Breakdown (Million, %) by Region 2024 & 2032
- Figure 2: Global MCAA Market Volume Breakdown (K Tons, %) by Region 2024 & 2032
- Figure 3: North America MCAA Market Revenue (Million), by Country 2024 & 2032
- Figure 4: North America MCAA Market Volume (K Tons), by Country 2024 & 2032
- Figure 5: North America MCAA Market Revenue Share (%), by Country 2024 & 2032
- Figure 6: North America MCAA Market Volume Share (%), by Country 2024 & 2032
- Figure 7: Europe MCAA Market Revenue (Million), by Country 2024 & 2032
- Figure 8: Europe MCAA Market Volume (K Tons), by Country 2024 & 2032
- Figure 9: Europe MCAA Market Revenue Share (%), by Country 2024 & 2032
- Figure 10: Europe MCAA Market Volume Share (%), by Country 2024 & 2032
- Figure 11: Asia Pacific MCAA Market Revenue (Million), by Country 2024 & 2032
- Figure 12: Asia Pacific MCAA Market Volume (K Tons), by Country 2024 & 2032
- Figure 13: Asia Pacific MCAA Market Revenue Share (%), by Country 2024 & 2032
- Figure 14: Asia Pacific MCAA Market Volume Share (%), by Country 2024 & 2032
- Figure 15: South America MCAA Market Revenue (Million), by Country 2024 & 2032
- Figure 16: South America MCAA Market Volume (K Tons), by Country 2024 & 2032
- Figure 17: South America MCAA Market Revenue Share (%), by Country 2024 & 2032
- Figure 18: South America MCAA Market Volume Share (%), by Country 2024 & 2032
- Figure 19: MEA MCAA Market Revenue (Million), by Country 2024 & 2032
- Figure 20: MEA MCAA Market Volume (K Tons), by Country 2024 & 2032
- Figure 21: MEA MCAA Market Revenue Share (%), by Country 2024 & 2032
- Figure 22: MEA MCAA Market Volume Share (%), by Country 2024 & 2032
- Figure 23: Asia Pacific MCAA Market Revenue (Million), by Chemical Application 2024 & 2032
- Figure 24: Asia Pacific MCAA Market Volume (K Tons), by Chemical Application 2024 & 2032
- Figure 25: Asia Pacific MCAA Market Revenue Share (%), by Chemical Application 2024 & 2032
- Figure 26: Asia Pacific MCAA Market Volume Share (%), by Chemical Application 2024 & 2032
- Figure 27: Asia Pacific MCAA Market Revenue (Million), by End-user Industry 2024 & 2032
- Figure 28: Asia Pacific MCAA Market Volume (K Tons), by End-user Industry 2024 & 2032
- Figure 29: Asia Pacific MCAA Market Revenue Share (%), by End-user Industry 2024 & 2032
- Figure 30: Asia Pacific MCAA Market Volume Share (%), by End-user Industry 2024 & 2032
- Figure 31: Asia Pacific MCAA Market Revenue (Million), by Country 2024 & 2032
- Figure 32: Asia Pacific MCAA Market Volume (K Tons), by Country 2024 & 2032
- Figure 33: Asia Pacific MCAA Market Revenue Share (%), by Country 2024 & 2032
- Figure 34: Asia Pacific MCAA Market Volume Share (%), by Country 2024 & 2032
- Figure 35: North America MCAA Market Revenue (Million), by Chemical Application 2024 & 2032
- Figure 36: North America MCAA Market Volume (K Tons), by Chemical Application 2024 & 2032
- Figure 37: North America MCAA Market Revenue Share (%), by Chemical Application 2024 & 2032
- Figure 38: North America MCAA Market Volume Share (%), by Chemical Application 2024 & 2032
- Figure 39: North America MCAA Market Revenue (Million), by End-user Industry 2024 & 2032
- Figure 40: North America MCAA Market Volume (K Tons), by End-user Industry 2024 & 2032
- Figure 41: North America MCAA Market Revenue Share (%), by End-user Industry 2024 & 2032
- Figure 42: North America MCAA Market Volume Share (%), by End-user Industry 2024 & 2032
- Figure 43: North America MCAA Market Revenue (Million), by Country 2024 & 2032
- Figure 44: North America MCAA Market Volume (K Tons), by Country 2024 & 2032
- Figure 45: North America MCAA Market Revenue Share (%), by Country 2024 & 2032
- Figure 46: North America MCAA Market Volume Share (%), by Country 2024 & 2032
- Figure 47: Europe MCAA Market Revenue (Million), by Chemical Application 2024 & 2032
- Figure 48: Europe MCAA Market Volume (K Tons), by Chemical Application 2024 & 2032
- Figure 49: Europe MCAA Market Revenue Share (%), by Chemical Application 2024 & 2032
- Figure 50: Europe MCAA Market Volume Share (%), by Chemical Application 2024 & 2032
- Figure 51: Europe MCAA Market Revenue (Million), by End-user Industry 2024 & 2032
- Figure 52: Europe MCAA Market Volume (K Tons), by End-user Industry 2024 & 2032
- Figure 53: Europe MCAA Market Revenue Share (%), by End-user Industry 2024 & 2032
- Figure 54: Europe MCAA Market Volume Share (%), by End-user Industry 2024 & 2032
- Figure 55: Europe MCAA Market Revenue (Million), by Country 2024 & 2032
- Figure 56: Europe MCAA Market Volume (K Tons), by Country 2024 & 2032
- Figure 57: Europe MCAA Market Revenue Share (%), by Country 2024 & 2032
- Figure 58: Europe MCAA Market Volume Share (%), by Country 2024 & 2032
- Figure 59: South America MCAA Market Revenue (Million), by Chemical Application 2024 & 2032
- Figure 60: South America MCAA Market Volume (K Tons), by Chemical Application 2024 & 2032
- Figure 61: South America MCAA Market Revenue Share (%), by Chemical Application 2024 & 2032
- Figure 62: South America MCAA Market Volume Share (%), by Chemical Application 2024 & 2032
- Figure 63: South America MCAA Market Revenue (Million), by End-user Industry 2024 & 2032
- Figure 64: South America MCAA Market Volume (K Tons), by End-user Industry 2024 & 2032
- Figure 65: South America MCAA Market Revenue Share (%), by End-user Industry 2024 & 2032
- Figure 66: South America MCAA Market Volume Share (%), by End-user Industry 2024 & 2032
- Figure 67: South America MCAA Market Revenue (Million), by Country 2024 & 2032
- Figure 68: South America MCAA Market Volume (K Tons), by Country 2024 & 2032
- Figure 69: South America MCAA Market Revenue Share (%), by Country 2024 & 2032
- Figure 70: South America MCAA Market Volume Share (%), by Country 2024 & 2032
- Figure 71: Middle East and Africa MCAA Market Revenue (Million), by Chemical Application 2024 & 2032
- Figure 72: Middle East and Africa MCAA Market Volume (K Tons), by Chemical Application 2024 & 2032
- Figure 73: Middle East and Africa MCAA Market Revenue Share (%), by Chemical Application 2024 & 2032
- Figure 74: Middle East and Africa MCAA Market Volume Share (%), by Chemical Application 2024 & 2032
- Figure 75: Middle East and Africa MCAA Market Revenue (Million), by End-user Industry 2024 & 2032
- Figure 76: Middle East and Africa MCAA Market Volume (K Tons), by End-user Industry 2024 & 2032
- Figure 77: Middle East and Africa MCAA Market Revenue Share (%), by End-user Industry 2024 & 2032
- Figure 78: Middle East and Africa MCAA Market Volume Share (%), by End-user Industry 2024 & 2032
- Figure 79: Middle East and Africa MCAA Market Revenue (Million), by Country 2024 & 2032
- Figure 80: Middle East and Africa MCAA Market Volume (K Tons), by Country 2024 & 2032
- Figure 81: Middle East and Africa MCAA Market Revenue Share (%), by Country 2024 & 2032
- Figure 82: Middle East and Africa MCAA Market Volume Share (%), by Country 2024 & 2032
List of Tables
- Table 1: Global MCAA Market Revenue Million Forecast, by Region 2019 & 2032
- Table 2: Global MCAA Market Volume K Tons Forecast, by Region 2019 & 2032
- Table 3: Global MCAA Market Revenue Million Forecast, by Chemical Application 2019 & 2032
- Table 4: Global MCAA Market Volume K Tons Forecast, by Chemical Application 2019 & 2032
- Table 5: Global MCAA Market Revenue Million Forecast, by End-user Industry 2019 & 2032
- Table 6: Global MCAA Market Volume K Tons Forecast, by End-user Industry 2019 & 2032
- Table 7: Global MCAA Market Revenue Million Forecast, by Region 2019 & 2032
- Table 8: Global MCAA Market Volume K Tons Forecast, by Region 2019 & 2032
- Table 9: Global MCAA Market Revenue Million Forecast, by Country 2019 & 2032
- Table 10: Global MCAA Market Volume K Tons Forecast, by Country 2019 & 2032
- Table 11: United States MCAA Market Revenue (Million) Forecast, by Application 2019 & 2032
- Table 12: United States MCAA Market Volume (K Tons) Forecast, by Application 2019 & 2032
- Table 13: Canada MCAA Market Revenue (Million) Forecast, by Application 2019 & 2032
- Table 14: Canada MCAA Market Volume (K Tons) Forecast, by Application 2019 & 2032
- Table 15: Mexico MCAA Market Revenue (Million) Forecast, by Application 2019 & 2032
- Table 16: Mexico MCAA Market Volume (K Tons) Forecast, by Application 2019 & 2032
- Table 17: Global MCAA Market Revenue Million Forecast, by Country 2019 & 2032
- Table 18: Global MCAA Market Volume K Tons Forecast, by Country 2019 & 2032
- Table 19: Germany MCAA Market Revenue (Million) Forecast, by Application 2019 & 2032
- Table 20: Germany MCAA Market Volume (K Tons) Forecast, by Application 2019 & 2032
- Table 21: France MCAA Market Revenue (Million) Forecast, by Application 2019 & 2032
- Table 22: France MCAA Market Volume (K Tons) Forecast, by Application 2019 & 2032
- Table 23: Italy MCAA Market Revenue (Million) Forecast, by Application 2019 & 2032
- Table 24: Italy MCAA Market Volume (K Tons) Forecast, by Application 2019 & 2032
- Table 25: United Kingdom MCAA Market Revenue (Million) Forecast, by Application 2019 & 2032
- Table 26: United Kingdom MCAA Market Volume (K Tons) Forecast, by Application 2019 & 2032
- Table 27: Netherlands MCAA Market Revenue (Million) Forecast, by Application 2019 & 2032
- Table 28: Netherlands MCAA Market Volume (K Tons) Forecast, by Application 2019 & 2032
- Table 29: Rest of Europe MCAA Market Revenue (Million) Forecast, by Application 2019 & 2032
- Table 30: Rest of Europe MCAA Market Volume (K Tons) Forecast, by Application 2019 & 2032
- Table 31: Global MCAA Market Revenue Million Forecast, by Country 2019 & 2032
- Table 32: Global MCAA Market Volume K Tons Forecast, by Country 2019 & 2032
- Table 33: China MCAA Market Revenue (Million) Forecast, by Application 2019 & 2032
- Table 34: China MCAA Market Volume (K Tons) Forecast, by Application 2019 & 2032
- Table 35: Japan MCAA Market Revenue (Million) Forecast, by Application 2019 & 2032
- Table 36: Japan MCAA Market Volume (K Tons) Forecast, by Application 2019 & 2032
- Table 37: India MCAA Market Revenue (Million) Forecast, by Application 2019 & 2032
- Table 38: India MCAA Market Volume (K Tons) Forecast, by Application 2019 & 2032
- Table 39: South Korea MCAA Market Revenue (Million) Forecast, by Application 2019 & 2032
- Table 40: South Korea MCAA Market Volume (K Tons) Forecast, by Application 2019 & 2032
- Table 41: Taiwan MCAA Market Revenue (Million) Forecast, by Application 2019 & 2032
- Table 42: Taiwan MCAA Market Volume (K Tons) Forecast, by Application 2019 & 2032
- Table 43: Australia MCAA Market Revenue (Million) Forecast, by Application 2019 & 2032
- Table 44: Australia MCAA Market Volume (K Tons) Forecast, by Application 2019 & 2032
- Table 45: Rest of Asia-Pacific MCAA Market Revenue (Million) Forecast, by Application 2019 & 2032
- Table 46: Rest of Asia-Pacific MCAA Market Volume (K Tons) Forecast, by Application 2019 & 2032
- Table 47: Global MCAA Market Revenue Million Forecast, by Country 2019 & 2032
- Table 48: Global MCAA Market Volume K Tons Forecast, by Country 2019 & 2032
- Table 49: Brazil MCAA Market Revenue (Million) Forecast, by Application 2019 & 2032
- Table 50: Brazil MCAA Market Volume (K Tons) Forecast, by Application 2019 & 2032
- Table 51: Argentina MCAA Market Revenue (Million) Forecast, by Application 2019 & 2032
- Table 52: Argentina MCAA Market Volume (K Tons) Forecast, by Application 2019 & 2032
- Table 53: Rest of South America MCAA Market Revenue (Million) Forecast, by Application 2019 & 2032
- Table 54: Rest of South America MCAA Market Volume (K Tons) Forecast, by Application 2019 & 2032
- Table 55: Global MCAA Market Revenue Million Forecast, by Country 2019 & 2032
- Table 56: Global MCAA Market Volume K Tons Forecast, by Country 2019 & 2032
- Table 57: Middle East MCAA Market Revenue (Million) Forecast, by Application 2019 & 2032
- Table 58: Middle East MCAA Market Volume (K Tons) Forecast, by Application 2019 & 2032
- Table 59: Africa MCAA Market Revenue (Million) Forecast, by Application 2019 & 2032
- Table 60: Africa MCAA Market Volume (K Tons) Forecast, by Application 2019 & 2032
- Table 61: Global MCAA Market Revenue Million Forecast, by Chemical Application 2019 & 2032
- Table 62: Global MCAA Market Volume K Tons Forecast, by Chemical Application 2019 & 2032
- Table 63: Global MCAA Market Revenue Million Forecast, by End-user Industry 2019 & 2032
- Table 64: Global MCAA Market Volume K Tons Forecast, by End-user Industry 2019 & 2032
- Table 65: Global MCAA Market Revenue Million Forecast, by Country 2019 & 2032
- Table 66: Global MCAA Market Volume K Tons Forecast, by Country 2019 & 2032
- Table 67: China MCAA Market Revenue (Million) Forecast, by Application 2019 & 2032
- Table 68: China MCAA Market Volume (K Tons) Forecast, by Application 2019 & 2032
- Table 69: India MCAA Market Revenue (Million) Forecast, by Application 2019 & 2032
- Table 70: India MCAA Market Volume (K Tons) Forecast, by Application 2019 & 2032
- Table 71: Japan MCAA Market Revenue (Million) Forecast, by Application 2019 & 2032
- Table 72: Japan MCAA Market Volume (K Tons) Forecast, by Application 2019 & 2032
- Table 73: South Korea MCAA Market Revenue (Million) Forecast, by Application 2019 & 2032
- Table 74: South Korea MCAA Market Volume (K Tons) Forecast, by Application 2019 & 2032
- Table 75: Malaysia MCAA Market Revenue (Million) Forecast, by Application 2019 & 2032
- Table 76: Malaysia MCAA Market Volume (K Tons) Forecast, by Application 2019 & 2032
- Table 77: Thailand MCAA Market Revenue (Million) Forecast, by Application 2019 & 2032
- Table 78: Thailand MCAA Market Volume (K Tons) Forecast, by Application 2019 & 2032
- Table 79: Indonesia MCAA Market Revenue (Million) Forecast, by Application 2019 & 2032
- Table 80: Indonesia MCAA Market Volume (K Tons) Forecast, by Application 2019 & 2032
- Table 81: Vietnam MCAA Market Revenue (Million) Forecast, by Application 2019 & 2032
- Table 82: Vietnam MCAA Market Volume (K Tons) Forecast, by Application 2019 & 2032
- Table 83: Rest of Asia Pacific MCAA Market Revenue (Million) Forecast, by Application 2019 & 2032
- Table 84: Rest of Asia Pacific MCAA Market Volume (K Tons) Forecast, by Application 2019 & 2032
- Table 85: Global MCAA Market Revenue Million Forecast, by Chemical Application 2019 & 2032
- Table 86: Global MCAA Market Volume K Tons Forecast, by Chemical Application 2019 & 2032
- Table 87: Global MCAA Market Revenue Million Forecast, by End-user Industry 2019 & 2032
- Table 88: Global MCAA Market Volume K Tons Forecast, by End-user Industry 2019 & 2032
- Table 89: Global MCAA Market Revenue Million Forecast, by Country 2019 & 2032
- Table 90: Global MCAA Market Volume K Tons Forecast, by Country 2019 & 2032
- Table 91: United States MCAA Market Revenue (Million) Forecast, by Application 2019 & 2032
- Table 92: United States MCAA Market Volume (K Tons) Forecast, by Application 2019 & 2032
- Table 93: Canada MCAA Market Revenue (Million) Forecast, by Application 2019 & 2032
- Table 94: Canada MCAA Market Volume (K Tons) Forecast, by Application 2019 & 2032
- Table 95: Mexico MCAA Market Revenue (Million) Forecast, by Application 2019 & 2032
- Table 96: Mexico MCAA Market Volume (K Tons) Forecast, by Application 2019 & 2032
- Table 97: Global MCAA Market Revenue Million Forecast, by Chemical Application 2019 & 2032
- Table 98: Global MCAA Market Volume K Tons Forecast, by Chemical Application 2019 & 2032
- Table 99: Global MCAA Market Revenue Million Forecast, by End-user Industry 2019 & 2032
- Table 100: Global MCAA Market Volume K Tons Forecast, by End-user Industry 2019 & 2032
- Table 101: Global MCAA Market Revenue Million Forecast, by Country 2019 & 2032
- Table 102: Global MCAA Market Volume K Tons Forecast, by Country 2019 & 2032
- Table 103: Germany MCAA Market Revenue (Million) Forecast, by Application 2019 & 2032
- Table 104: Germany MCAA Market Volume (K Tons) Forecast, by Application 2019 & 2032
- Table 105: United Kingdom MCAA Market Revenue (Million) Forecast, by Application 2019 & 2032
- Table 106: United Kingdom MCAA Market Volume (K Tons) Forecast, by Application 2019 & 2032
- Table 107: Italy MCAA Market Revenue (Million) Forecast, by Application 2019 & 2032
- Table 108: Italy MCAA Market Volume (K Tons) Forecast, by Application 2019 & 2032
- Table 109: France MCAA Market Revenue (Million) Forecast, by Application 2019 & 2032
- Table 110: France MCAA Market Volume (K Tons) Forecast, by Application 2019 & 2032
- Table 111: Spain MCAA Market Revenue (Million) Forecast, by Application 2019 & 2032
- Table 112: Spain MCAA Market Volume (K Tons) Forecast, by Application 2019 & 2032
- Table 113: Nordic Countries MCAA Market Revenue (Million) Forecast, by Application 2019 & 2032
- Table 114: Nordic Countries MCAA Market Volume (K Tons) Forecast, by Application 2019 & 2032
- Table 115: Turkey MCAA Market Revenue (Million) Forecast, by Application 2019 & 2032
- Table 116: Turkey MCAA Market Volume (K Tons) Forecast, by Application 2019 & 2032
- Table 117: Russia MCAA Market Revenue (Million) Forecast, by Application 2019 & 2032
- Table 118: Russia MCAA Market Volume (K Tons) Forecast, by Application 2019 & 2032
- Table 119: Rest of Europe MCAA Market Revenue (Million) Forecast, by Application 2019 & 2032
- Table 120: Rest of Europe MCAA Market Volume (K Tons) Forecast, by Application 2019 & 2032
- Table 121: Global MCAA Market Revenue Million Forecast, by Chemical Application 2019 & 2032
- Table 122: Global MCAA Market Volume K Tons Forecast, by Chemical Application 2019 & 2032
- Table 123: Global MCAA Market Revenue Million Forecast, by End-user Industry 2019 & 2032
- Table 124: Global MCAA Market Volume K Tons Forecast, by End-user Industry 2019 & 2032
- Table 125: Global MCAA Market Revenue Million Forecast, by Country 2019 & 2032
- Table 126: Global MCAA Market Volume K Tons Forecast, by Country 2019 & 2032
- Table 127: Brazil MCAA Market Revenue (Million) Forecast, by Application 2019 & 2032
- Table 128: Brazil MCAA Market Volume (K Tons) Forecast, by Application 2019 & 2032
- Table 129: Argentina MCAA Market Revenue (Million) Forecast, by Application 2019 & 2032
- Table 130: Argentina MCAA Market Volume (K Tons) Forecast, by Application 2019 & 2032
- Table 131: Colombia MCAA Market Revenue (Million) Forecast, by Application 2019 & 2032
- Table 132: Colombia MCAA Market Volume (K Tons) Forecast, by Application 2019 & 2032
- Table 133: Rest of South America MCAA Market Revenue (Million) Forecast, by Application 2019 & 2032
- Table 134: Rest of South America MCAA Market Volume (K Tons) Forecast, by Application 2019 & 2032
- Table 135: Global MCAA Market Revenue Million Forecast, by Chemical Application 2019 & 2032
- Table 136: Global MCAA Market Volume K Tons Forecast, by Chemical Application 2019 & 2032
- Table 137: Global MCAA Market Revenue Million Forecast, by End-user Industry 2019 & 2032
- Table 138: Global MCAA Market Volume K Tons Forecast, by End-user Industry 2019 & 2032
- Table 139: Global MCAA Market Revenue Million Forecast, by Country 2019 & 2032
- Table 140: Global MCAA Market Volume K Tons Forecast, by Country 2019 & 2032
- Table 141: Saudi Arabia MCAA Market Revenue (Million) Forecast, by Application 2019 & 2032
- Table 142: Saudi Arabia MCAA Market Volume (K Tons) Forecast, by Application 2019 & 2032
- Table 143: Qatar MCAA Market Revenue (Million) Forecast, by Application 2019 & 2032
- Table 144: Qatar MCAA Market Volume (K Tons) Forecast, by Application 2019 & 2032
- Table 145: United Arab Emirates MCAA Market Revenue (Million) Forecast, by Application 2019 & 2032
- Table 146: United Arab Emirates MCAA Market Volume (K Tons) Forecast, by Application 2019 & 2032
- Table 147: Nigeria MCAA Market Revenue (Million) Forecast, by Application 2019 & 2032
- Table 148: Nigeria MCAA Market Volume (K Tons) Forecast, by Application 2019 & 2032
- Table 149: Egypt MCAA Market Revenue (Million) Forecast, by Application 2019 & 2032
- Table 150: Egypt MCAA Market Volume (K Tons) Forecast, by Application 2019 & 2032
- Table 151: South Africa MCAA Market Revenue (Million) Forecast, by Application 2019 & 2032
- Table 152: South Africa MCAA Market Volume (K Tons) Forecast, by Application 2019 & 2032
- Table 153: Rest of Middle East and Africa MCAA Market Revenue (Million) Forecast, by Application 2019 & 2032
- Table 154: Rest of Middle East and Africa MCAA Market Volume (K Tons) Forecast, by Application 2019 & 2032
Frequently Asked Questions
1. What is the projected Compound Annual Growth Rate (CAGR) of the MCAA Market?
The projected CAGR is approximately 3.6%.
2. Which companies are prominent players in the MCAA Market?
Key companies in the market include Nouryon, Denak Co Ltd, Merck KGaA, Mahalaxmi Industries, Archit Organosys, Jiangxi Biochem Co Ltd, Alfa Aesar Thermo Fisher Scientific, Meridian Chem Bond Pvt Ltd, TerraTech, PCC Group, Henan HDF Chemical CompanyLtd, ITALMAR (THAILAND) CO LTD, Shandong Minji New Material Technology Co Ltd.
3. What are the main segments of the MCAA Market?
The market segments include Chemical Application, End-user Industry.
4. Can you provide details about the market size?
The market size is estimated to be USD 990.11 Million as of 2022.
5. What are some drivers contributing to market growth?
Growing consumption from the pharmaceutical Industry; Growing production of agrochemical in the country.
6. What are the notable trends driving market growth?
Increasing Demand from Personal Care and Pharmaceuticals Industries.
7. Are there any restraints impacting market growth?
Decline in detergent consumption.
8. Can you provide examples of recent developments in the market?
September 2021: The Board of Directors of Archit Organosys approved the proposal to increase the production capacity by 12,000 tpa at the existing Bhavnagar plant in Gujarat. The project will entail an investment of Rs five crore which will be financed through internal accruals. There is an increase in demand for Monochloro Acetic Acid (MCA) both at the domestic and export level, as witnessed by the company.
9. What pricing options are available for accessing the report?
Pricing options include single-user, multi-user, and enterprise licenses priced at USD 4750, USD 5250, and USD 8750 respectively.
10. Is the market size provided in terms of value or volume?
The market size is provided in terms of value, measured in Million and volume, measured in K Tons.
11. Are there any specific market keywords associated with the report?
Yes, the market keyword associated with the report is "MCAA Market," which aids in identifying and referencing the specific market segment covered.
12. How do I determine which pricing option suits my needs best?
The pricing options vary based on user requirements and access needs. Individual users may opt for single-user licenses, while businesses requiring broader access may choose multi-user or enterprise licenses for cost-effective access to the report.
13. Are there any additional resources or data provided in the MCAA Market report?
While the report offers comprehensive insights, it's advisable to review the specific contents or supplementary materials provided to ascertain if additional resources or data are available.
14. How can I stay updated on further developments or reports in the MCAA Market?
To stay informed about further developments, trends, and reports in the MCAA Market, consider subscribing to industry newsletters, following relevant companies and organizations, or regularly checking reputable industry news sources and publications.
Methodology
Step 1 - Identification of Relevant Samples Size from Population Database


Step 2 - Approaches for Defining Global Market Size (Value, Volume* & Price*)

Note*: In applicable scenarios
Step 3 - Data Sources
Primary Research
- Web Analytics
- Survey Reports
- Research Institute
- Latest Research Reports
- Opinion Leaders
Secondary Research
- Annual Reports
- White Paper
- Latest Press Release
- Industry Association
- Paid Database
- Investor Presentations

Step 4 - Data Triangulation
Involves using different sources of information in order to increase the validity of a study
These sources are likely to be stakeholders in a program - participants, other researchers, program staff, other community members, and so on.
Then we put all data in single framework & apply various statistical tools to find out the dynamic on the market.
During the analysis stage, feedback from the stakeholder groups would be compared to determine areas of agreement as well as areas of divergence
