

Key Insights
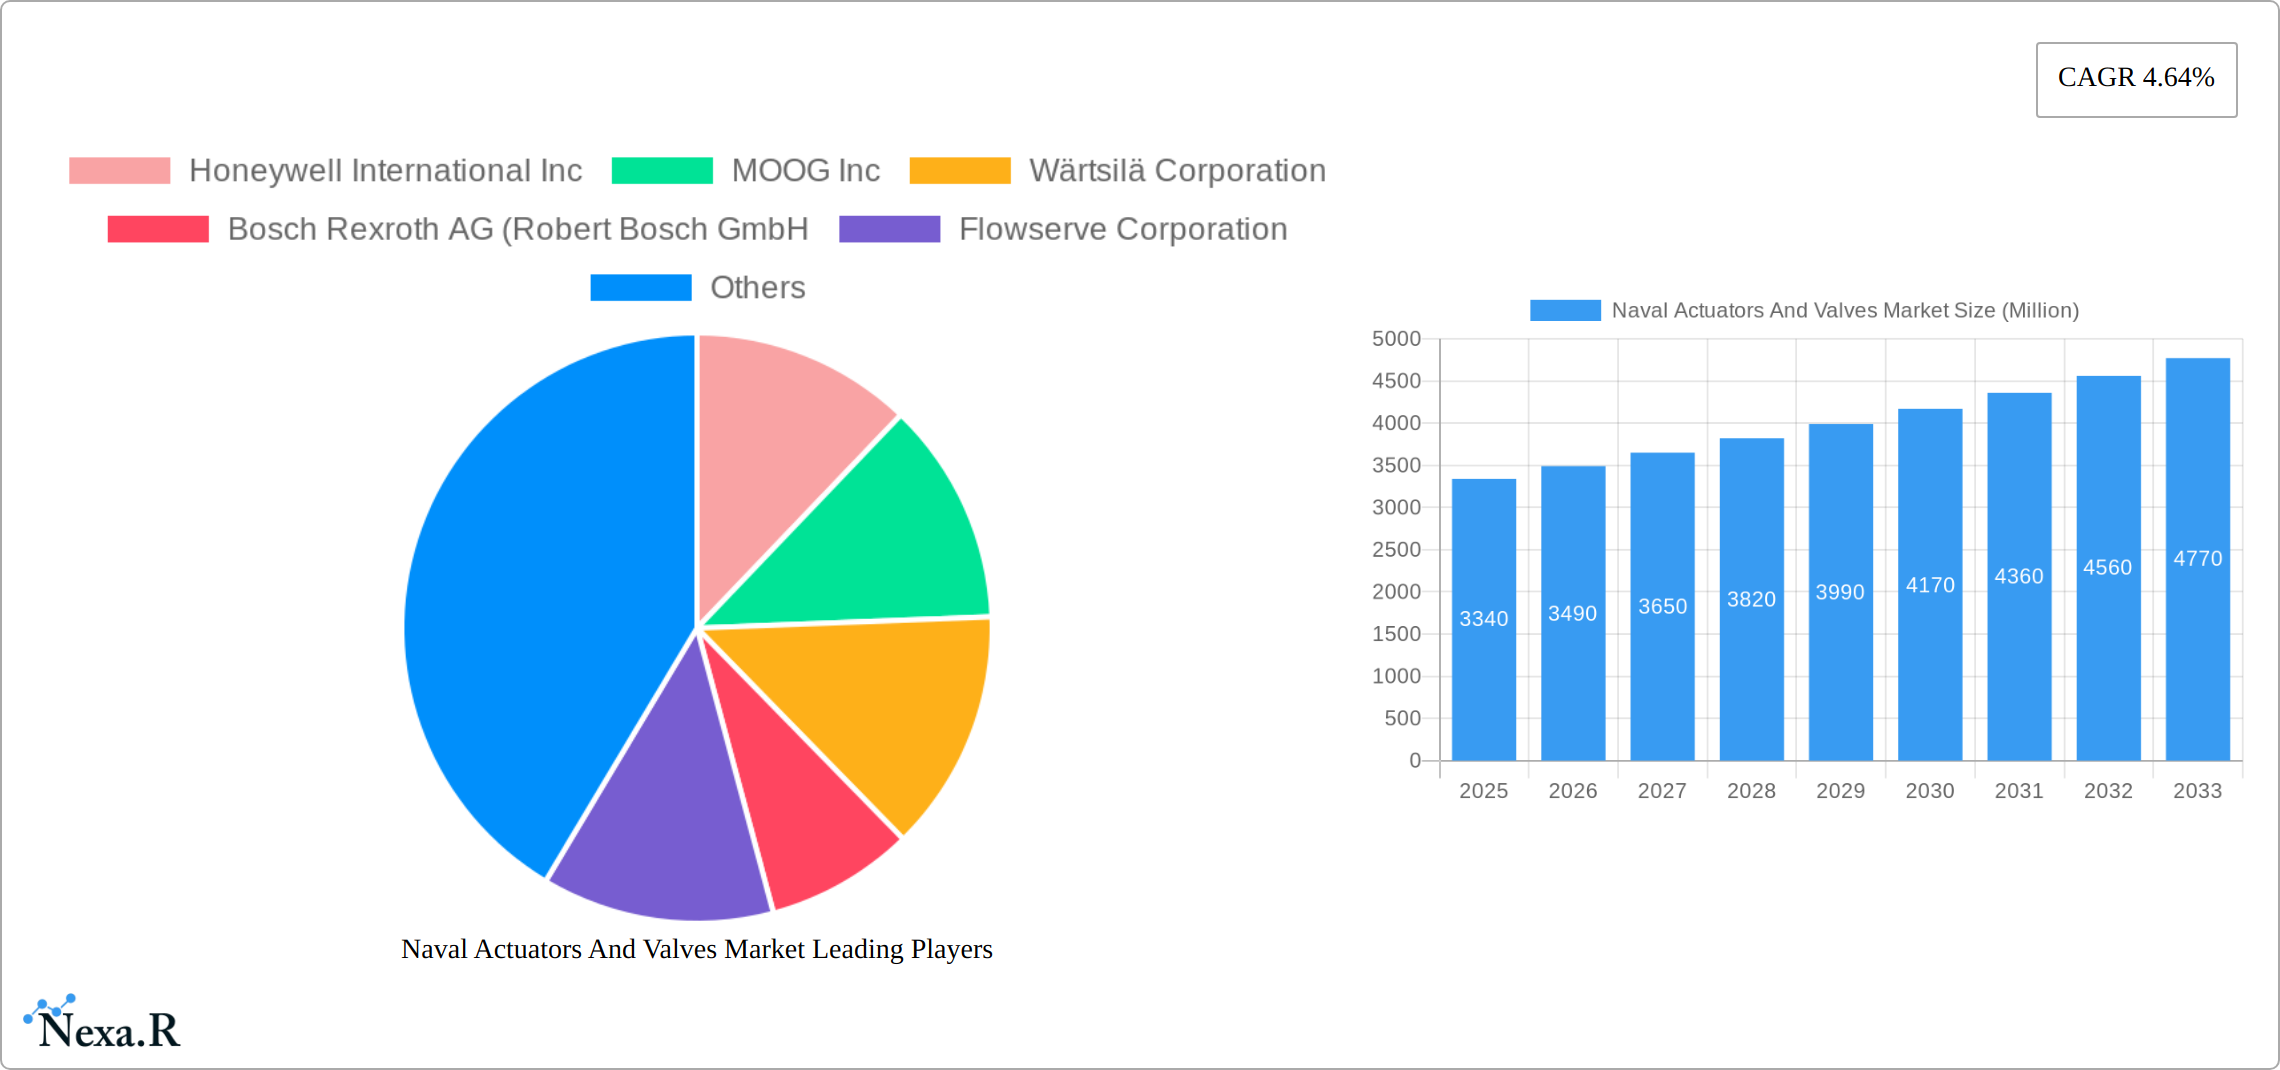
The Naval Actuators and Valves Market, valued at $3.34 billion in 2025, is projected to experience robust growth, driven by increasing naval modernization programs globally and a rising demand for advanced automation and control systems in naval vessels. The market's Compound Annual Growth Rate (CAGR) of 4.64% from 2019 to 2024 indicates a consistent upward trajectory, expected to continue through 2033. Key growth drivers include the integration of sophisticated weaponry systems requiring precise actuation, the need for improved safety and reliability in naval operations, and the ongoing development of unmanned and autonomous naval platforms. The market is segmented by material (aluminum, stainless steel, alloy-based), actuator type (mechanical, hydraulic, pneumatic, electrical, hybrid), and platform (defense, commercial). The defense segment currently dominates, fueled by substantial government investments in naval defense capabilities. However, the commercial segment is projected to witness notable growth due to expanding offshore energy exploration and the increasing adoption of advanced valve technology in maritime applications. Technological advancements, including the development of more efficient and durable actuators, are further contributing to market expansion. While potential restraints include the high initial investment costs associated with advanced systems and stringent regulatory compliance requirements, the overall market outlook remains positive, driven by long-term defense spending and technological innovation.
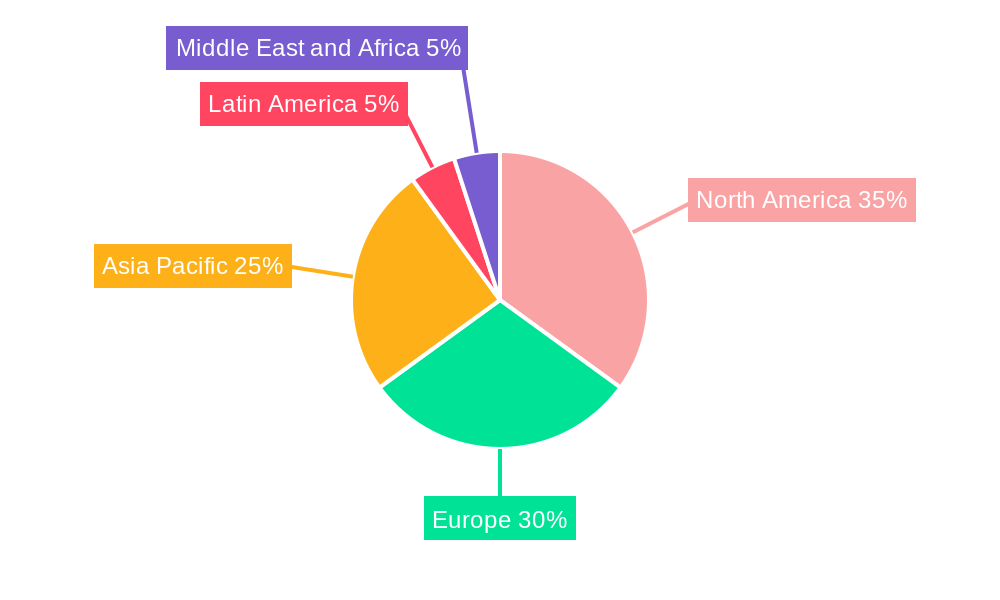
The leading players in this market, including Honeywell International Inc., MOOG Inc., Wärtsilä Corporation, and Bosch Rexroth AG, are actively engaged in developing innovative solutions to meet the evolving needs of the naval industry. Geographic segmentation reveals strong market presence in North America and Europe, owing to their advanced naval fleets and robust defense budgets. However, the Asia-Pacific region is poised for substantial growth, driven by increasing defense expenditure and modernization initiatives in countries like China, India, and South Korea. The Latin American and Middle Eastern & African markets are also expected to contribute to the overall market expansion, albeit at a slower pace compared to the more developed regions. The forecast period (2025-2033) anticipates continued growth, influenced by ongoing geopolitical factors and advancements in naval technology. This sustained demand for advanced actuators and valves in naval applications is expected to support significant market expansion over the next decade.
Naval Actuators and Valves Market: A Comprehensive Report (2019-2033)
This comprehensive report provides an in-depth analysis of the Naval Actuators and Valves market, encompassing market dynamics, growth trends, regional segmentation, product landscape, key players, and future outlook. The study period covers 2019-2033, with 2025 as the base and estimated year, and 2025-2033 as the forecast period. The historical period analyzed is 2019-2024. The parent market is the broader industrial automation sector, while the child market is specifically naval applications. The market size is projected in Million units.
Naval Actuators and Valves Market Market Dynamics & Structure
The naval actuators and valves market is characterized by moderate concentration, with key players holding significant market share. Technological innovation, driven by the need for enhanced efficiency, reliability, and safety in naval systems, is a primary growth driver. Stringent regulatory frameworks governing safety and performance standards in the naval industry significantly influence market dynamics. Competitive substitutes, such as alternative control mechanisms, pose a challenge. The end-user demographics consist primarily of defense forces and commercial shipping companies, with defense segment driving a larger share of the market. M&A activity within the sector has been relatively moderate in recent years, with xx major deals recorded between 2019 and 2024.
- Market Concentration: Moderately concentrated, with top 5 players holding approximately xx% market share in 2024.
- Technological Innovation: Focus on miniaturization, improved durability, and enhanced remote control capabilities.
- Regulatory Landscape: Stringent safety and performance standards (e.g., DNV GL, ABS) impact product development and adoption.
- Competitive Substitutes: Growing competition from advanced control systems and alternative technologies.
- End-User Demographics: Primarily defense (xx%) and commercial (xx%) naval sectors.
- M&A Activity: xx major mergers and acquisitions between 2019 and 2024, indicating consolidation trends.
Naval Actuators and Valves Market Growth Trends & Insights
The naval actuators and valves market experienced steady growth between 2019 and 2024, driven by increasing naval modernization programs globally and rising demand for efficient and reliable control systems in naval vessels. The market is projected to witness a CAGR of xx% during the forecast period (2025-2033), reaching a market size of xx Million units by 2033. This growth is attributed to several factors including the increasing adoption of automation technologies in naval operations, a growing emphasis on enhanced safety and operational efficiency, and the rising demand for technologically advanced actuators and valves from defense and commercial naval sectors. Technological advancements such as the integration of smart sensors, improved materials, and advanced control algorithms are further propelling market growth. Consumer behavior is shifting towards a preference for more reliable, energy-efficient, and digitally integrated products. Market penetration in emerging economies is anticipated to rise significantly, driven by increasing investments in naval infrastructure and defense modernization.

Dominant Regions, Countries, or Segments in Naval Actuators and Valves Market
North America and Europe currently hold the largest market share in the naval actuators and valves market, driven by robust defense budgets and established naval industries. However, the Asia-Pacific region is projected to exhibit the fastest growth rate during the forecast period due to increasing investments in naval infrastructure and expanding naval forces. Within segmentations, the defense platform and electrical actuator types dominate the market. Stainless steel remains the preferred material due to its corrosion resistance.
- Key Regional Drivers:
- North America: Strong defense spending, technological advancements.
- Europe: Significant naval modernization programs, technological expertise.
- Asia-Pacific: Rising defense budgets, increasing naval shipbuilding activities.
- Dominant Segments:
- Platform: Defense (xx% market share)
- Actuator Type: Electrical (xx% market share)
- Material: Stainless Steel (xx% market share)
Naval Actuators and Valves Market Product Landscape
The market offers a diverse range of actuators and valves tailored to specific naval applications, including those designed for harsh marine environments and demanding operational conditions. Products are characterized by features such as high reliability, corrosion resistance, compact size, and integrated control systems. Recent innovations focus on improved energy efficiency, enhanced durability, and advanced diagnostics capabilities. The unique selling propositions (USPs) of these products include robust construction, precise control, and reduced maintenance requirements.
Key Drivers, Barriers & Challenges in Naval Actuators and Valves Market
Key Drivers:
- Increasing demand for automation and remote control systems in naval vessels.
- Stringent safety and performance standards driving technological advancements.
- Growing investments in naval modernization programs globally.
Key Challenges & Restraints:
- High initial investment costs associated with adopting advanced technologies.
- Supply chain disruptions impacting material availability and production timelines.
- Intense competition among established and emerging players.
Emerging Opportunities in Naval Actuators and Valves Market
- Growing demand for unmanned and autonomous naval systems.
- Integration of advanced sensors and data analytics for enhanced situational awareness.
- Development of lightweight and energy-efficient actuators and valves.
Growth Accelerators in the Naval Actuators and Valves Market Industry
Strategic partnerships between technology providers and naval contractors are accelerating market growth by fostering innovation and improving product integration. Moreover, investments in research and development are leading to improved performance, durability, and energy efficiency of actuators and valves, leading to wider adoption. Expansion into emerging markets with significant naval modernization efforts presents lucrative opportunities for growth.
Key Players Shaping the Naval Actuators and Valves Market Market
- Honeywell International Inc
- MOOG Inc
- Wärtsilä Corporation
- Bosch Rexroth AG (Robert Bosch GmbH)
- Flowserve Corporation
- Rotork PLC
- Diakont
- Emerson Electric Co
- Curtiss-Wright Corporation
- Schlumberger Limited
- IMI PLC
- AUMA Riester GmbH & Co KG
Notable Milestones in Naval Actuators and Valves Market Sector
- 2021 Q3: Honeywell launched a new line of energy-efficient actuators for naval applications.
- 2022 Q1: MOOG Inc. secured a major contract for supplying valves to a new class of frigates.
- 2023 Q2: Wärtsilä Corporation and a major naval contractor announced a strategic partnership for developing next-generation control systems. (Note: Specific details are illustrative and require further research for accurate information)
In-Depth Naval Actuators and Valves Market Market Outlook
The naval actuators and valves market is poised for continued growth, driven by sustained investments in naval modernization and the increasing adoption of advanced technologies. Strategic partnerships, technological breakthroughs in areas such as AI and IoT integration, and expansion into emerging markets will create significant opportunities for growth. Companies focusing on innovation, sustainability, and supply chain resilience are well-positioned to capture a significant share of the expanding market.
Naval Actuators And Valves Market Segmentation
- 1. Production Analysis
- 2. Consumption Analysis
- 3. Import Market Analysis (Value & Volume)
- 4. Export Market Analysis (Value & Volume)
- 5. Price Trend Analysis
Naval Actuators And Valves Market Segmentation By Geography
-
1. North America
- 1.1. United States
- 1.2. Canada
- 1.3. Mexico
-
2. South America
- 2.1. Brazil
- 2.2. Argentina
- 2.3. Rest of South America
-
3. Europe
- 3.1. United Kingdom
- 3.2. Germany
- 3.3. France
- 3.4. Italy
- 3.5. Spain
- 3.6. Russia
- 3.7. Benelux
- 3.8. Nordics
- 3.9. Rest of Europe
-
4. Middle East & Africa
- 4.1. Turkey
- 4.2. Israel
- 4.3. GCC
- 4.4. North Africa
- 4.5. South Africa
- 4.6. Rest of Middle East & Africa
-
5. Asia Pacific
- 5.1. China
- 5.2. India
- 5.3. Japan
- 5.4. South Korea
- 5.5. ASEAN
- 5.6. Oceania
- 5.7. Rest of Asia Pacific
Naval Actuators And Valves Market REPORT HIGHLIGHTS
| Aspects | Details |
|---|---|
| Study Period | 2019-2033 |
| Base Year | 2024 |
| Estimated Year | 2025 |
| Forecast Period | 2025-2033 |
| Historical Period | 2019-2024 |
| Growth Rate | CAGR of 4.64% from 2019-2033 |
| Segmentation |
|
Table of Contents
- 1. Introduction
- 1.1. Research Scope
- 1.2. Market Segmentation
- 1.3. Research Methodology
- 1.4. Definitions and Assumptions
- 2. Executive Summary
- 2.1. Introduction
- 3. Market Dynamics
- 3.1. Introduction
- 3.2. Market Drivers
- 3.2.1. Increase in Internet of Things (IoT) and Autonomous Systems; Rise in Demand for Military and Defense Satellite Communication Solutions
- 3.3. Market Restrains
- 3.3.1. Cybersecurity Threats to Satellite Communication; Interference in Transmission of Data
- 3.4. Market Trends
- 3.4.1. Defense Segment is Expected to Dominate the Market
- 4. Market Factor Analysis
- 4.1. Porters Five Forces
- 4.2. Supply/Value Chain
- 4.3. PESTEL analysis
- 4.4. Market Entropy
- 4.5. Patent/Trademark Analysis
- 5. Global Naval Actuators And Valves Market Analysis, Insights and Forecast, 2019-2031
- 5.1. Market Analysis, Insights and Forecast - by Production Analysis
- 5.2. Market Analysis, Insights and Forecast - by Consumption Analysis
- 5.3. Market Analysis, Insights and Forecast - by Import Market Analysis (Value & Volume)
- 5.4. Market Analysis, Insights and Forecast - by Export Market Analysis (Value & Volume)
- 5.5. Market Analysis, Insights and Forecast - by Price Trend Analysis
- 5.6. Market Analysis, Insights and Forecast - by Region
- 5.6.1. North America
- 5.6.2. South America
- 5.6.3. Europe
- 5.6.4. Middle East & Africa
- 5.6.5. Asia Pacific
- 5.1. Market Analysis, Insights and Forecast - by Production Analysis
- 6. North America Naval Actuators And Valves Market Analysis, Insights and Forecast, 2019-2031
- 6.1. Market Analysis, Insights and Forecast - by Production Analysis
- 6.2. Market Analysis, Insights and Forecast - by Consumption Analysis
- 6.3. Market Analysis, Insights and Forecast - by Import Market Analysis (Value & Volume)
- 6.4. Market Analysis, Insights and Forecast - by Export Market Analysis (Value & Volume)
- 6.5. Market Analysis, Insights and Forecast - by Price Trend Analysis
- 6.1. Market Analysis, Insights and Forecast - by Production Analysis
- 7. South America Naval Actuators And Valves Market Analysis, Insights and Forecast, 2019-2031
- 7.1. Market Analysis, Insights and Forecast - by Production Analysis
- 7.2. Market Analysis, Insights and Forecast - by Consumption Analysis
- 7.3. Market Analysis, Insights and Forecast - by Import Market Analysis (Value & Volume)
- 7.4. Market Analysis, Insights and Forecast - by Export Market Analysis (Value & Volume)
- 7.5. Market Analysis, Insights and Forecast - by Price Trend Analysis
- 7.1. Market Analysis, Insights and Forecast - by Production Analysis
- 8. Europe Naval Actuators And Valves Market Analysis, Insights and Forecast, 2019-2031
- 8.1. Market Analysis, Insights and Forecast - by Production Analysis
- 8.2. Market Analysis, Insights and Forecast - by Consumption Analysis
- 8.3. Market Analysis, Insights and Forecast - by Import Market Analysis (Value & Volume)
- 8.4. Market Analysis, Insights and Forecast - by Export Market Analysis (Value & Volume)
- 8.5. Market Analysis, Insights and Forecast - by Price Trend Analysis
- 8.1. Market Analysis, Insights and Forecast - by Production Analysis
- 9. Middle East & Africa Naval Actuators And Valves Market Analysis, Insights and Forecast, 2019-2031
- 9.1. Market Analysis, Insights and Forecast - by Production Analysis
- 9.2. Market Analysis, Insights and Forecast - by Consumption Analysis
- 9.3. Market Analysis, Insights and Forecast - by Import Market Analysis (Value & Volume)
- 9.4. Market Analysis, Insights and Forecast - by Export Market Analysis (Value & Volume)
- 9.5. Market Analysis, Insights and Forecast - by Price Trend Analysis
- 9.1. Market Analysis, Insights and Forecast - by Production Analysis
- 10. Asia Pacific Naval Actuators And Valves Market Analysis, Insights and Forecast, 2019-2031
- 10.1. Market Analysis, Insights and Forecast - by Production Analysis
- 10.2. Market Analysis, Insights and Forecast - by Consumption Analysis
- 10.3. Market Analysis, Insights and Forecast - by Import Market Analysis (Value & Volume)
- 10.4. Market Analysis, Insights and Forecast - by Export Market Analysis (Value & Volume)
- 10.5. Market Analysis, Insights and Forecast - by Price Trend Analysis
- 10.1. Market Analysis, Insights and Forecast - by Production Analysis
- 11. North America Naval Actuators And Valves Market Analysis, Insights and Forecast, 2019-2031
- 11.1. Market Analysis, Insights and Forecast - By Country/Sub-region
- 11.1.1 United States
- 11.1.2 Canada
- 12. Europe Naval Actuators And Valves Market Analysis, Insights and Forecast, 2019-2031
- 12.1. Market Analysis, Insights and Forecast - By Country/Sub-region
- 12.1.1 Germany
- 12.1.2 United Kingdom
- 12.1.3 France
- 12.1.4 Russia
- 12.1.5 Rest of Europe
- 13. Asia Pacific Naval Actuators And Valves Market Analysis, Insights and Forecast, 2019-2031
- 13.1. Market Analysis, Insights and Forecast - By Country/Sub-region
- 13.1.1 India
- 13.1.2 China
- 13.1.3 Japan
- 13.1.4 South Korea
- 13.1.5 Rest of Asia Pacific
- 14. Latin America Naval Actuators And Valves Market Analysis, Insights and Forecast, 2019-2031
- 14.1. Market Analysis, Insights and Forecast - By Country/Sub-region
- 14.1.1 Mexico
- 14.1.2 Brazil
- 14.1.3 Rest of Latin America
- 15. Middle East and Africa Naval Actuators And Valves Market Analysis, Insights and Forecast, 2019-2031
- 15.1. Market Analysis, Insights and Forecast - By Country/Sub-region
- 15.1.1 United Arab Emirates
- 15.1.2 Saudi Arabia
- 15.1.3 Egypt
- 15.1.4 Israel
- 15.1.5 Rest of Middle East and Africa
- 16. Competitive Analysis
- 16.1. Global Market Share Analysis 2024
- 16.2. Company Profiles
- 16.2.1 Honeywell International Inc
- 16.2.1.1. Overview
- 16.2.1.2. Products
- 16.2.1.3. SWOT Analysis
- 16.2.1.4. Recent Developments
- 16.2.1.5. Financials (Based on Availability)
- 16.2.2 MOOG Inc
- 16.2.2.1. Overview
- 16.2.2.2. Products
- 16.2.2.3. SWOT Analysis
- 16.2.2.4. Recent Developments
- 16.2.2.5. Financials (Based on Availability)
- 16.2.3 Wärtsilä Corporation
- 16.2.3.1. Overview
- 16.2.3.2. Products
- 16.2.3.3. SWOT Analysis
- 16.2.3.4. Recent Developments
- 16.2.3.5. Financials (Based on Availability)
- 16.2.4 Bosch Rexroth AG (Robert Bosch GmbH
- 16.2.4.1. Overview
- 16.2.4.2. Products
- 16.2.4.3. SWOT Analysis
- 16.2.4.4. Recent Developments
- 16.2.4.5. Financials (Based on Availability)
- 16.2.5 Flowserve Corporation
- 16.2.5.1. Overview
- 16.2.5.2. Products
- 16.2.5.3. SWOT Analysis
- 16.2.5.4. Recent Developments
- 16.2.5.5. Financials (Based on Availability)
- 16.2.6 Rotork PLC
- 16.2.6.1. Overview
- 16.2.6.2. Products
- 16.2.6.3. SWOT Analysis
- 16.2.6.4. Recent Developments
- 16.2.6.5. Financials (Based on Availability)
- 16.2.7 Diakont
- 16.2.7.1. Overview
- 16.2.7.2. Products
- 16.2.7.3. SWOT Analysis
- 16.2.7.4. Recent Developments
- 16.2.7.5. Financials (Based on Availability)
- 16.2.8 Emerson Electric Co
- 16.2.8.1. Overview
- 16.2.8.2. Products
- 16.2.8.3. SWOT Analysis
- 16.2.8.4. Recent Developments
- 16.2.8.5. Financials (Based on Availability)
- 16.2.9 Curtiss-Wright Corporation
- 16.2.9.1. Overview
- 16.2.9.2. Products
- 16.2.9.3. SWOT Analysis
- 16.2.9.4. Recent Developments
- 16.2.9.5. Financials (Based on Availability)
- 16.2.10 Schlumberger Limited
- 16.2.10.1. Overview
- 16.2.10.2. Products
- 16.2.10.3. SWOT Analysis
- 16.2.10.4. Recent Developments
- 16.2.10.5. Financials (Based on Availability)
- 16.2.11 IMI PLC
- 16.2.11.1. Overview
- 16.2.11.2. Products
- 16.2.11.3. SWOT Analysis
- 16.2.11.4. Recent Developments
- 16.2.11.5. Financials (Based on Availability)
- 16.2.12 AUMA Riester GmbH & Co KG
- 16.2.12.1. Overview
- 16.2.12.2. Products
- 16.2.12.3. SWOT Analysis
- 16.2.12.4. Recent Developments
- 16.2.12.5. Financials (Based on Availability)
- 16.2.1 Honeywell International Inc
List of Figures
- Figure 1: Global Naval Actuators And Valves Market Revenue Breakdown (Million, %) by Region 2024 & 2032
- Figure 2: North America Naval Actuators And Valves Market Revenue (Million), by Country 2024 & 2032
- Figure 3: North America Naval Actuators And Valves Market Revenue Share (%), by Country 2024 & 2032
- Figure 4: Europe Naval Actuators And Valves Market Revenue (Million), by Country 2024 & 2032
- Figure 5: Europe Naval Actuators And Valves Market Revenue Share (%), by Country 2024 & 2032
- Figure 6: Asia Pacific Naval Actuators And Valves Market Revenue (Million), by Country 2024 & 2032
- Figure 7: Asia Pacific Naval Actuators And Valves Market Revenue Share (%), by Country 2024 & 2032
- Figure 8: Latin America Naval Actuators And Valves Market Revenue (Million), by Country 2024 & 2032
- Figure 9: Latin America Naval Actuators And Valves Market Revenue Share (%), by Country 2024 & 2032
- Figure 10: Middle East and Africa Naval Actuators And Valves Market Revenue (Million), by Country 2024 & 2032
- Figure 11: Middle East and Africa Naval Actuators And Valves Market Revenue Share (%), by Country 2024 & 2032
- Figure 12: North America Naval Actuators And Valves Market Revenue (Million), by Production Analysis 2024 & 2032
- Figure 13: North America Naval Actuators And Valves Market Revenue Share (%), by Production Analysis 2024 & 2032
- Figure 14: North America Naval Actuators And Valves Market Revenue (Million), by Consumption Analysis 2024 & 2032
- Figure 15: North America Naval Actuators And Valves Market Revenue Share (%), by Consumption Analysis 2024 & 2032
- Figure 16: North America Naval Actuators And Valves Market Revenue (Million), by Import Market Analysis (Value & Volume) 2024 & 2032
- Figure 17: North America Naval Actuators And Valves Market Revenue Share (%), by Import Market Analysis (Value & Volume) 2024 & 2032
- Figure 18: North America Naval Actuators And Valves Market Revenue (Million), by Export Market Analysis (Value & Volume) 2024 & 2032
- Figure 19: North America Naval Actuators And Valves Market Revenue Share (%), by Export Market Analysis (Value & Volume) 2024 & 2032
- Figure 20: North America Naval Actuators And Valves Market Revenue (Million), by Price Trend Analysis 2024 & 2032
- Figure 21: North America Naval Actuators And Valves Market Revenue Share (%), by Price Trend Analysis 2024 & 2032
- Figure 22: North America Naval Actuators And Valves Market Revenue (Million), by Country 2024 & 2032
- Figure 23: North America Naval Actuators And Valves Market Revenue Share (%), by Country 2024 & 2032
- Figure 24: South America Naval Actuators And Valves Market Revenue (Million), by Production Analysis 2024 & 2032
- Figure 25: South America Naval Actuators And Valves Market Revenue Share (%), by Production Analysis 2024 & 2032
- Figure 26: South America Naval Actuators And Valves Market Revenue (Million), by Consumption Analysis 2024 & 2032
- Figure 27: South America Naval Actuators And Valves Market Revenue Share (%), by Consumption Analysis 2024 & 2032
- Figure 28: South America Naval Actuators And Valves Market Revenue (Million), by Import Market Analysis (Value & Volume) 2024 & 2032
- Figure 29: South America Naval Actuators And Valves Market Revenue Share (%), by Import Market Analysis (Value & Volume) 2024 & 2032
- Figure 30: South America Naval Actuators And Valves Market Revenue (Million), by Export Market Analysis (Value & Volume) 2024 & 2032
- Figure 31: South America Naval Actuators And Valves Market Revenue Share (%), by Export Market Analysis (Value & Volume) 2024 & 2032
- Figure 32: South America Naval Actuators And Valves Market Revenue (Million), by Price Trend Analysis 2024 & 2032
- Figure 33: South America Naval Actuators And Valves Market Revenue Share (%), by Price Trend Analysis 2024 & 2032
- Figure 34: South America Naval Actuators And Valves Market Revenue (Million), by Country 2024 & 2032
- Figure 35: South America Naval Actuators And Valves Market Revenue Share (%), by Country 2024 & 2032
- Figure 36: Europe Naval Actuators And Valves Market Revenue (Million), by Production Analysis 2024 & 2032
- Figure 37: Europe Naval Actuators And Valves Market Revenue Share (%), by Production Analysis 2024 & 2032
- Figure 38: Europe Naval Actuators And Valves Market Revenue (Million), by Consumption Analysis 2024 & 2032
- Figure 39: Europe Naval Actuators And Valves Market Revenue Share (%), by Consumption Analysis 2024 & 2032
- Figure 40: Europe Naval Actuators And Valves Market Revenue (Million), by Import Market Analysis (Value & Volume) 2024 & 2032
- Figure 41: Europe Naval Actuators And Valves Market Revenue Share (%), by Import Market Analysis (Value & Volume) 2024 & 2032
- Figure 42: Europe Naval Actuators And Valves Market Revenue (Million), by Export Market Analysis (Value & Volume) 2024 & 2032
- Figure 43: Europe Naval Actuators And Valves Market Revenue Share (%), by Export Market Analysis (Value & Volume) 2024 & 2032
- Figure 44: Europe Naval Actuators And Valves Market Revenue (Million), by Price Trend Analysis 2024 & 2032
- Figure 45: Europe Naval Actuators And Valves Market Revenue Share (%), by Price Trend Analysis 2024 & 2032
- Figure 46: Europe Naval Actuators And Valves Market Revenue (Million), by Country 2024 & 2032
- Figure 47: Europe Naval Actuators And Valves Market Revenue Share (%), by Country 2024 & 2032
- Figure 48: Middle East & Africa Naval Actuators And Valves Market Revenue (Million), by Production Analysis 2024 & 2032
- Figure 49: Middle East & Africa Naval Actuators And Valves Market Revenue Share (%), by Production Analysis 2024 & 2032
- Figure 50: Middle East & Africa Naval Actuators And Valves Market Revenue (Million), by Consumption Analysis 2024 & 2032
- Figure 51: Middle East & Africa Naval Actuators And Valves Market Revenue Share (%), by Consumption Analysis 2024 & 2032
- Figure 52: Middle East & Africa Naval Actuators And Valves Market Revenue (Million), by Import Market Analysis (Value & Volume) 2024 & 2032
- Figure 53: Middle East & Africa Naval Actuators And Valves Market Revenue Share (%), by Import Market Analysis (Value & Volume) 2024 & 2032
- Figure 54: Middle East & Africa Naval Actuators And Valves Market Revenue (Million), by Export Market Analysis (Value & Volume) 2024 & 2032
- Figure 55: Middle East & Africa Naval Actuators And Valves Market Revenue Share (%), by Export Market Analysis (Value & Volume) 2024 & 2032
- Figure 56: Middle East & Africa Naval Actuators And Valves Market Revenue (Million), by Price Trend Analysis 2024 & 2032
- Figure 57: Middle East & Africa Naval Actuators And Valves Market Revenue Share (%), by Price Trend Analysis 2024 & 2032
- Figure 58: Middle East & Africa Naval Actuators And Valves Market Revenue (Million), by Country 2024 & 2032
- Figure 59: Middle East & Africa Naval Actuators And Valves Market Revenue Share (%), by Country 2024 & 2032
- Figure 60: Asia Pacific Naval Actuators And Valves Market Revenue (Million), by Production Analysis 2024 & 2032
- Figure 61: Asia Pacific Naval Actuators And Valves Market Revenue Share (%), by Production Analysis 2024 & 2032
- Figure 62: Asia Pacific Naval Actuators And Valves Market Revenue (Million), by Consumption Analysis 2024 & 2032
- Figure 63: Asia Pacific Naval Actuators And Valves Market Revenue Share (%), by Consumption Analysis 2024 & 2032
- Figure 64: Asia Pacific Naval Actuators And Valves Market Revenue (Million), by Import Market Analysis (Value & Volume) 2024 & 2032
- Figure 65: Asia Pacific Naval Actuators And Valves Market Revenue Share (%), by Import Market Analysis (Value & Volume) 2024 & 2032
- Figure 66: Asia Pacific Naval Actuators And Valves Market Revenue (Million), by Export Market Analysis (Value & Volume) 2024 & 2032
- Figure 67: Asia Pacific Naval Actuators And Valves Market Revenue Share (%), by Export Market Analysis (Value & Volume) 2024 & 2032
- Figure 68: Asia Pacific Naval Actuators And Valves Market Revenue (Million), by Price Trend Analysis 2024 & 2032
- Figure 69: Asia Pacific Naval Actuators And Valves Market Revenue Share (%), by Price Trend Analysis 2024 & 2032
- Figure 70: Asia Pacific Naval Actuators And Valves Market Revenue (Million), by Country 2024 & 2032
- Figure 71: Asia Pacific Naval Actuators And Valves Market Revenue Share (%), by Country 2024 & 2032
List of Tables
- Table 1: Global Naval Actuators And Valves Market Revenue Million Forecast, by Region 2019 & 2032
- Table 2: Global Naval Actuators And Valves Market Revenue Million Forecast, by Production Analysis 2019 & 2032
- Table 3: Global Naval Actuators And Valves Market Revenue Million Forecast, by Consumption Analysis 2019 & 2032
- Table 4: Global Naval Actuators And Valves Market Revenue Million Forecast, by Import Market Analysis (Value & Volume) 2019 & 2032
- Table 5: Global Naval Actuators And Valves Market Revenue Million Forecast, by Export Market Analysis (Value & Volume) 2019 & 2032
- Table 6: Global Naval Actuators And Valves Market Revenue Million Forecast, by Price Trend Analysis 2019 & 2032
- Table 7: Global Naval Actuators And Valves Market Revenue Million Forecast, by Region 2019 & 2032
- Table 8: Global Naval Actuators And Valves Market Revenue Million Forecast, by Country 2019 & 2032
- Table 9: United States Naval Actuators And Valves Market Revenue (Million) Forecast, by Application 2019 & 2032
- Table 10: Canada Naval Actuators And Valves Market Revenue (Million) Forecast, by Application 2019 & 2032
- Table 11: Global Naval Actuators And Valves Market Revenue Million Forecast, by Country 2019 & 2032
- Table 12: Germany Naval Actuators And Valves Market Revenue (Million) Forecast, by Application 2019 & 2032
- Table 13: United Kingdom Naval Actuators And Valves Market Revenue (Million) Forecast, by Application 2019 & 2032
- Table 14: France Naval Actuators And Valves Market Revenue (Million) Forecast, by Application 2019 & 2032
- Table 15: Russia Naval Actuators And Valves Market Revenue (Million) Forecast, by Application 2019 & 2032
- Table 16: Rest of Europe Naval Actuators And Valves Market Revenue (Million) Forecast, by Application 2019 & 2032
- Table 17: Global Naval Actuators And Valves Market Revenue Million Forecast, by Country 2019 & 2032
- Table 18: India Naval Actuators And Valves Market Revenue (Million) Forecast, by Application 2019 & 2032
- Table 19: China Naval Actuators And Valves Market Revenue (Million) Forecast, by Application 2019 & 2032
- Table 20: Japan Naval Actuators And Valves Market Revenue (Million) Forecast, by Application 2019 & 2032
- Table 21: South Korea Naval Actuators And Valves Market Revenue (Million) Forecast, by Application 2019 & 2032
- Table 22: Rest of Asia Pacific Naval Actuators And Valves Market Revenue (Million) Forecast, by Application 2019 & 2032
- Table 23: Global Naval Actuators And Valves Market Revenue Million Forecast, by Country 2019 & 2032
- Table 24: Mexico Naval Actuators And Valves Market Revenue (Million) Forecast, by Application 2019 & 2032
- Table 25: Brazil Naval Actuators And Valves Market Revenue (Million) Forecast, by Application 2019 & 2032
- Table 26: Rest of Latin America Naval Actuators And Valves Market Revenue (Million) Forecast, by Application 2019 & 2032
- Table 27: Global Naval Actuators And Valves Market Revenue Million Forecast, by Country 2019 & 2032
- Table 28: United Arab Emirates Naval Actuators And Valves Market Revenue (Million) Forecast, by Application 2019 & 2032
- Table 29: Saudi Arabia Naval Actuators And Valves Market Revenue (Million) Forecast, by Application 2019 & 2032
- Table 30: Egypt Naval Actuators And Valves Market Revenue (Million) Forecast, by Application 2019 & 2032
- Table 31: Israel Naval Actuators And Valves Market Revenue (Million) Forecast, by Application 2019 & 2032
- Table 32: Rest of Middle East and Africa Naval Actuators And Valves Market Revenue (Million) Forecast, by Application 2019 & 2032
- Table 33: Global Naval Actuators And Valves Market Revenue Million Forecast, by Production Analysis 2019 & 2032
- Table 34: Global Naval Actuators And Valves Market Revenue Million Forecast, by Consumption Analysis 2019 & 2032
- Table 35: Global Naval Actuators And Valves Market Revenue Million Forecast, by Import Market Analysis (Value & Volume) 2019 & 2032
- Table 36: Global Naval Actuators And Valves Market Revenue Million Forecast, by Export Market Analysis (Value & Volume) 2019 & 2032
- Table 37: Global Naval Actuators And Valves Market Revenue Million Forecast, by Price Trend Analysis 2019 & 2032
- Table 38: Global Naval Actuators And Valves Market Revenue Million Forecast, by Country 2019 & 2032
- Table 39: United States Naval Actuators And Valves Market Revenue (Million) Forecast, by Application 2019 & 2032
- Table 40: Canada Naval Actuators And Valves Market Revenue (Million) Forecast, by Application 2019 & 2032
- Table 41: Mexico Naval Actuators And Valves Market Revenue (Million) Forecast, by Application 2019 & 2032
- Table 42: Global Naval Actuators And Valves Market Revenue Million Forecast, by Production Analysis 2019 & 2032
- Table 43: Global Naval Actuators And Valves Market Revenue Million Forecast, by Consumption Analysis 2019 & 2032
- Table 44: Global Naval Actuators And Valves Market Revenue Million Forecast, by Import Market Analysis (Value & Volume) 2019 & 2032
- Table 45: Global Naval Actuators And Valves Market Revenue Million Forecast, by Export Market Analysis (Value & Volume) 2019 & 2032
- Table 46: Global Naval Actuators And Valves Market Revenue Million Forecast, by Price Trend Analysis 2019 & 2032
- Table 47: Global Naval Actuators And Valves Market Revenue Million Forecast, by Country 2019 & 2032
- Table 48: Brazil Naval Actuators And Valves Market Revenue (Million) Forecast, by Application 2019 & 2032
- Table 49: Argentina Naval Actuators And Valves Market Revenue (Million) Forecast, by Application 2019 & 2032
- Table 50: Rest of South America Naval Actuators And Valves Market Revenue (Million) Forecast, by Application 2019 & 2032
- Table 51: Global Naval Actuators And Valves Market Revenue Million Forecast, by Production Analysis 2019 & 2032
- Table 52: Global Naval Actuators And Valves Market Revenue Million Forecast, by Consumption Analysis 2019 & 2032
- Table 53: Global Naval Actuators And Valves Market Revenue Million Forecast, by Import Market Analysis (Value & Volume) 2019 & 2032
- Table 54: Global Naval Actuators And Valves Market Revenue Million Forecast, by Export Market Analysis (Value & Volume) 2019 & 2032
- Table 55: Global Naval Actuators And Valves Market Revenue Million Forecast, by Price Trend Analysis 2019 & 2032
- Table 56: Global Naval Actuators And Valves Market Revenue Million Forecast, by Country 2019 & 2032
- Table 57: United Kingdom Naval Actuators And Valves Market Revenue (Million) Forecast, by Application 2019 & 2032
- Table 58: Germany Naval Actuators And Valves Market Revenue (Million) Forecast, by Application 2019 & 2032
- Table 59: France Naval Actuators And Valves Market Revenue (Million) Forecast, by Application 2019 & 2032
- Table 60: Italy Naval Actuators And Valves Market Revenue (Million) Forecast, by Application 2019 & 2032
- Table 61: Spain Naval Actuators And Valves Market Revenue (Million) Forecast, by Application 2019 & 2032
- Table 62: Russia Naval Actuators And Valves Market Revenue (Million) Forecast, by Application 2019 & 2032
- Table 63: Benelux Naval Actuators And Valves Market Revenue (Million) Forecast, by Application 2019 & 2032
- Table 64: Nordics Naval Actuators And Valves Market Revenue (Million) Forecast, by Application 2019 & 2032
- Table 65: Rest of Europe Naval Actuators And Valves Market Revenue (Million) Forecast, by Application 2019 & 2032
- Table 66: Global Naval Actuators And Valves Market Revenue Million Forecast, by Production Analysis 2019 & 2032
- Table 67: Global Naval Actuators And Valves Market Revenue Million Forecast, by Consumption Analysis 2019 & 2032
- Table 68: Global Naval Actuators And Valves Market Revenue Million Forecast, by Import Market Analysis (Value & Volume) 2019 & 2032
- Table 69: Global Naval Actuators And Valves Market Revenue Million Forecast, by Export Market Analysis (Value & Volume) 2019 & 2032
- Table 70: Global Naval Actuators And Valves Market Revenue Million Forecast, by Price Trend Analysis 2019 & 2032
- Table 71: Global Naval Actuators And Valves Market Revenue Million Forecast, by Country 2019 & 2032
- Table 72: Turkey Naval Actuators And Valves Market Revenue (Million) Forecast, by Application 2019 & 2032
- Table 73: Israel Naval Actuators And Valves Market Revenue (Million) Forecast, by Application 2019 & 2032
- Table 74: GCC Naval Actuators And Valves Market Revenue (Million) Forecast, by Application 2019 & 2032
- Table 75: North Africa Naval Actuators And Valves Market Revenue (Million) Forecast, by Application 2019 & 2032
- Table 76: South Africa Naval Actuators And Valves Market Revenue (Million) Forecast, by Application 2019 & 2032
- Table 77: Rest of Middle East & Africa Naval Actuators And Valves Market Revenue (Million) Forecast, by Application 2019 & 2032
- Table 78: Global Naval Actuators And Valves Market Revenue Million Forecast, by Production Analysis 2019 & 2032
- Table 79: Global Naval Actuators And Valves Market Revenue Million Forecast, by Consumption Analysis 2019 & 2032
- Table 80: Global Naval Actuators And Valves Market Revenue Million Forecast, by Import Market Analysis (Value & Volume) 2019 & 2032
- Table 81: Global Naval Actuators And Valves Market Revenue Million Forecast, by Export Market Analysis (Value & Volume) 2019 & 2032
- Table 82: Global Naval Actuators And Valves Market Revenue Million Forecast, by Price Trend Analysis 2019 & 2032
- Table 83: Global Naval Actuators And Valves Market Revenue Million Forecast, by Country 2019 & 2032
- Table 84: China Naval Actuators And Valves Market Revenue (Million) Forecast, by Application 2019 & 2032
- Table 85: India Naval Actuators And Valves Market Revenue (Million) Forecast, by Application 2019 & 2032
- Table 86: Japan Naval Actuators And Valves Market Revenue (Million) Forecast, by Application 2019 & 2032
- Table 87: South Korea Naval Actuators And Valves Market Revenue (Million) Forecast, by Application 2019 & 2032
- Table 88: ASEAN Naval Actuators And Valves Market Revenue (Million) Forecast, by Application 2019 & 2032
- Table 89: Oceania Naval Actuators And Valves Market Revenue (Million) Forecast, by Application 2019 & 2032
- Table 90: Rest of Asia Pacific Naval Actuators And Valves Market Revenue (Million) Forecast, by Application 2019 & 2032
Frequently Asked Questions
1. What is the projected Compound Annual Growth Rate (CAGR) of the Naval Actuators And Valves Market?
The projected CAGR is approximately 4.64%.
2. Which companies are prominent players in the Naval Actuators And Valves Market?
Key companies in the market include Honeywell International Inc, MOOG Inc, Wärtsilä Corporation, Bosch Rexroth AG (Robert Bosch GmbH, Flowserve Corporation, Rotork PLC, Diakont, Emerson Electric Co, Curtiss-Wright Corporation, Schlumberger Limited, IMI PLC, AUMA Riester GmbH & Co KG.
3. What are the main segments of the Naval Actuators And Valves Market?
The market segments include Production Analysis, Consumption Analysis, Import Market Analysis (Value & Volume), Export Market Analysis (Value & Volume), Price Trend Analysis.
4. Can you provide details about the market size?
The market size is estimated to be USD 3.34 Million as of 2022.
5. What are some drivers contributing to market growth?
Increase in Internet of Things (IoT) and Autonomous Systems; Rise in Demand for Military and Defense Satellite Communication Solutions.
6. What are the notable trends driving market growth?
Defense Segment is Expected to Dominate the Market.
7. Are there any restraints impacting market growth?
Cybersecurity Threats to Satellite Communication; Interference in Transmission of Data.
8. Can you provide examples of recent developments in the market?
N/A
9. What pricing options are available for accessing the report?
Pricing options include single-user, multi-user, and enterprise licenses priced at USD 4750, USD 5250, and USD 8750 respectively.
10. Is the market size provided in terms of value or volume?
The market size is provided in terms of value, measured in Million.
11. Are there any specific market keywords associated with the report?
Yes, the market keyword associated with the report is "Naval Actuators And Valves Market," which aids in identifying and referencing the specific market segment covered.
12. How do I determine which pricing option suits my needs best?
The pricing options vary based on user requirements and access needs. Individual users may opt for single-user licenses, while businesses requiring broader access may choose multi-user or enterprise licenses for cost-effective access to the report.
13. Are there any additional resources or data provided in the Naval Actuators And Valves Market report?
While the report offers comprehensive insights, it's advisable to review the specific contents or supplementary materials provided to ascertain if additional resources or data are available.
14. How can I stay updated on further developments or reports in the Naval Actuators And Valves Market?
To stay informed about further developments, trends, and reports in the Naval Actuators And Valves Market, consider subscribing to industry newsletters, following relevant companies and organizations, or regularly checking reputable industry news sources and publications.
Methodology
Step 1 - Identification of Relevant Samples Size from Population Database


Step 2 - Approaches for Defining Global Market Size (Value, Volume* & Price*)

Note*: In applicable scenarios
Step 3 - Data Sources
Primary Research
- Web Analytics
- Survey Reports
- Research Institute
- Latest Research Reports
- Opinion Leaders
Secondary Research
- Annual Reports
- White Paper
- Latest Press Release
- Industry Association
- Paid Database
- Investor Presentations

Step 4 - Data Triangulation
Involves using different sources of information in order to increase the validity of a study
These sources are likely to be stakeholders in a program - participants, other researchers, program staff, other community members, and so on.
Then we put all data in single framework & apply various statistical tools to find out the dynamic on the market.
During the analysis stage, feedback from the stakeholder groups would be compared to determine areas of agreement as well as areas of divergence
