

Key Insights
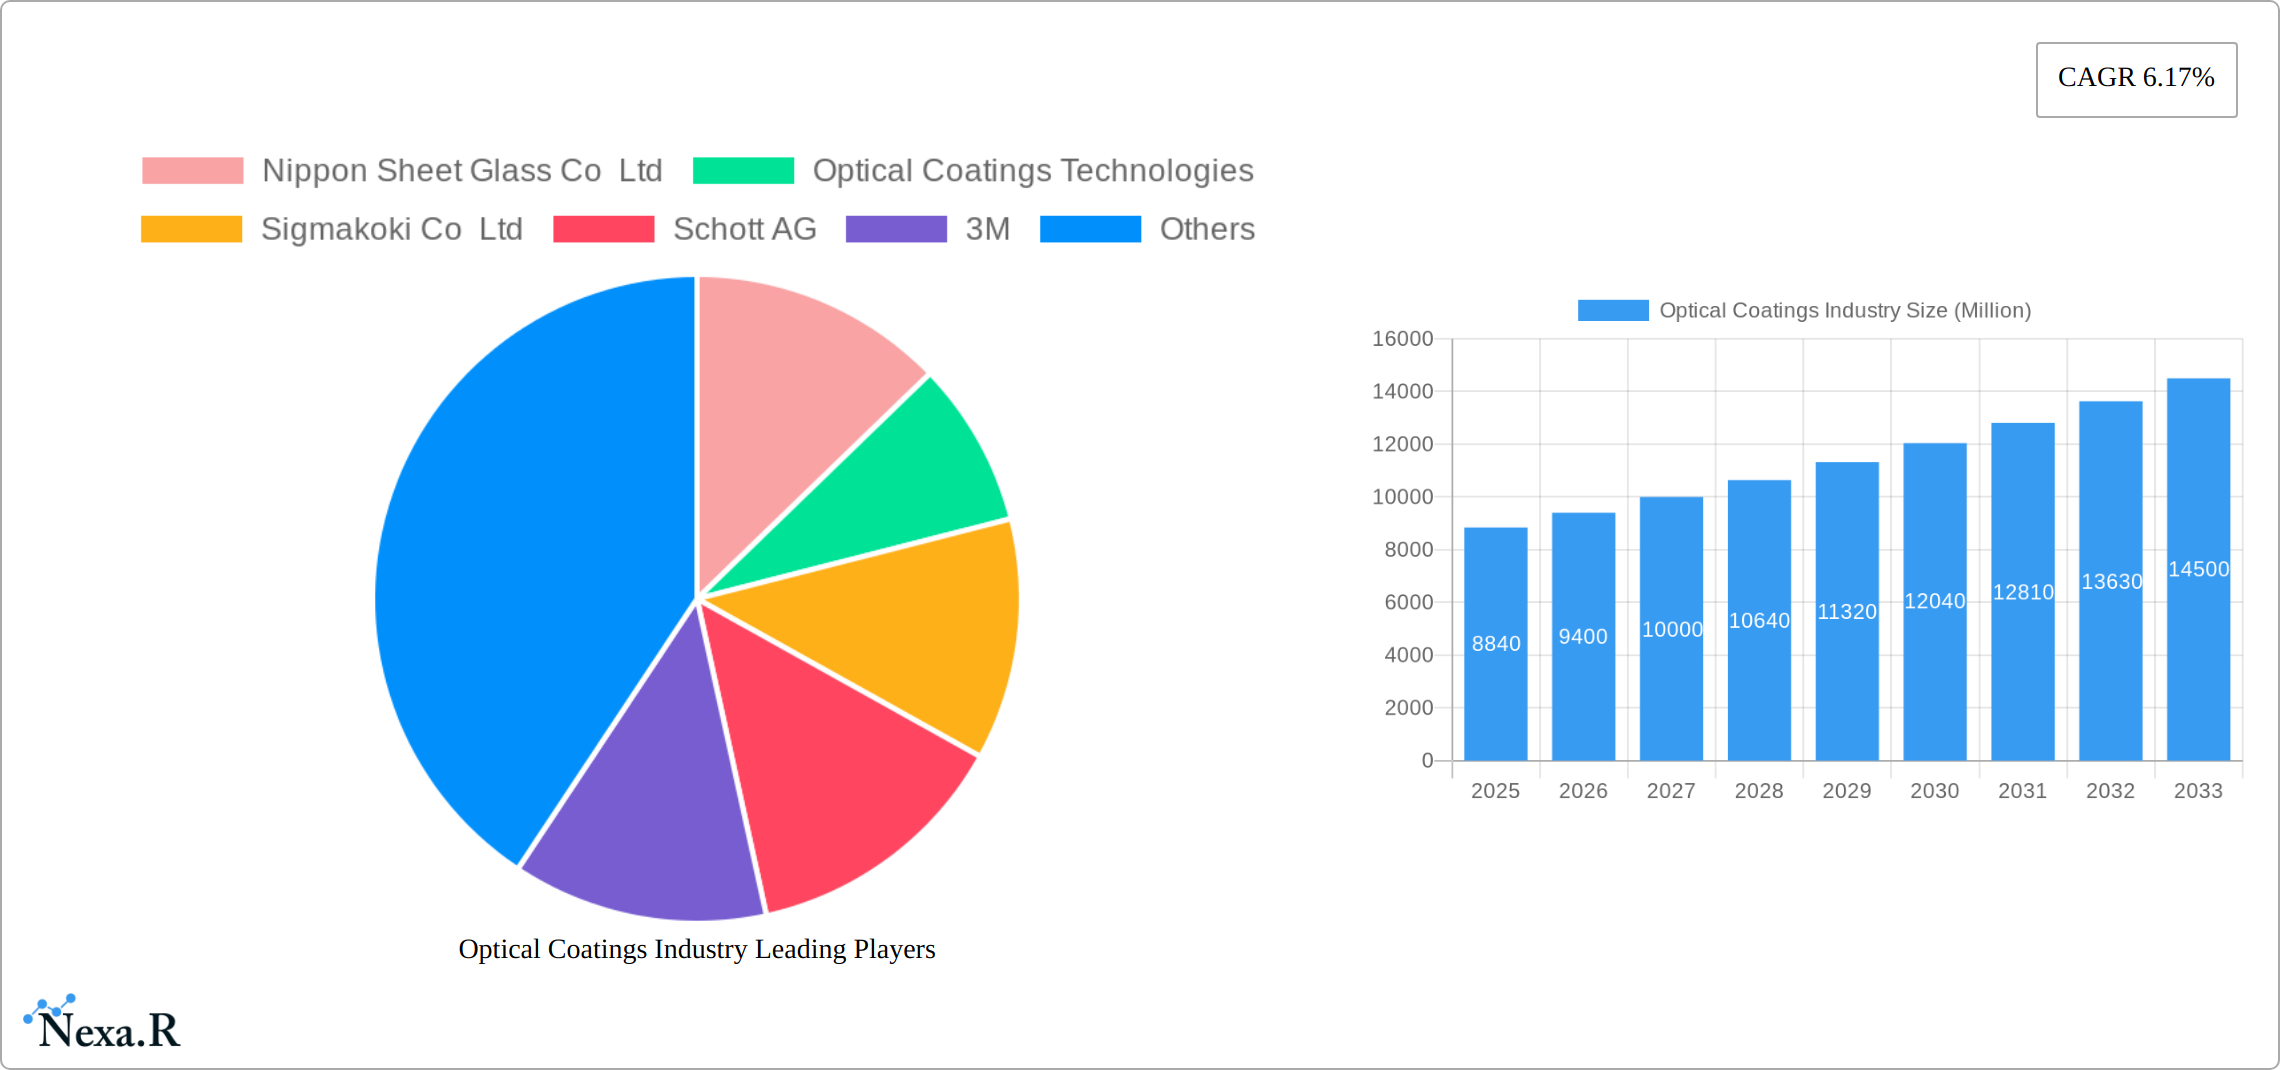
The global optical coatings market, valued at $8.84 billion in 2025, is projected to experience robust growth, driven by a Compound Annual Growth Rate (CAGR) of 6.17% from 2025 to 2033. This expansion is fueled by several key factors. The increasing demand for advanced optical components across diverse sectors like electronics, telecommunications, and automotive is a primary driver. The rising adoption of sophisticated technologies such as smartphones, high-speed internet infrastructure, and autonomous vehicles necessitates high-performance optical coatings for improved functionality and efficiency. Furthermore, the growing investments in research and development are leading to innovations in coating materials and deposition techniques, enhancing the performance and durability of optical coatings. The continuous miniaturization of electronic devices also creates a strong demand for thinner, more efficient, and specialized coatings. Specific application areas like augmented reality (AR) and virtual reality (VR) devices are emerging as significant growth catalysts, demanding advanced optical coatings with unique properties.
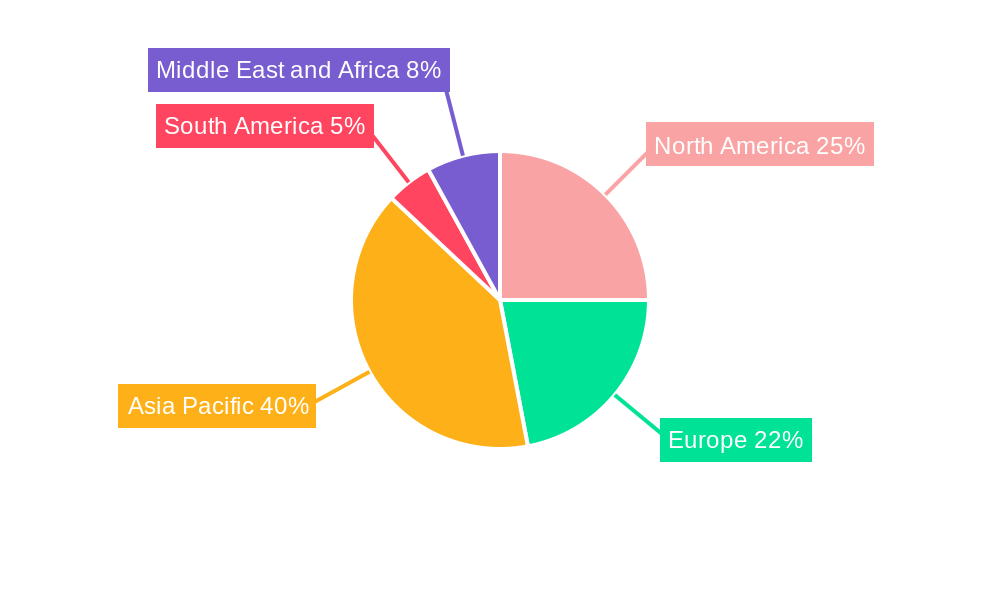
The market segmentation reveals significant opportunities within specific product types and technologies. Anti-reflective coatings and transparent conductive coatings are witnessing particularly strong demand, driven by their crucial roles in display technologies and solar energy applications. Among technologies, chemical vapor deposition and ion-beam sputtering remain dominant, while advancements in atomic layer deposition and sub-wavelength structured surfaces offer potential for future growth and niche applications. Regionally, Asia Pacific is expected to dominate the market, driven by the rapid expansion of electronics manufacturing and the growing adoption of advanced technologies in countries like China and India. North America and Europe, however, are also expected to maintain substantial market share, driven by strong demand from aerospace and defense and automotive industries. While market restraints may include fluctuating raw material prices and stringent regulatory compliance requirements, the overall outlook remains positive, signifying considerable investment potential and sustained market growth.
Optical Coatings Industry Market Report: 2019-2033
This comprehensive report provides a detailed analysis of the Optical Coatings Industry, encompassing market size, growth trends, competitive landscape, and future outlook. With a study period spanning 2019-2033, a base year of 2025, and a forecast period of 2025-2033, this report is an invaluable resource for industry professionals, investors, and strategic decision-makers. The report covers key segments, including Product Type (Optical Filter Coatings, Anti-reflective Coatings, Transparent Conductive Coatings, Mirror Coatings, Beam Splitter Coatings, Other Product Types), Technology (Chemical Vapor Deposition, Ion-beam Sputtering, Plasma Sputtering, Atomic Layer Deposition, Sub-wavelength Structured Surfaces), and End-user Industry (Aerospace & Defense, Electronics & Semiconductors, Telecommunications, Healthcare, Solar, Automotive, Other End-user Industries). The market value is presented in Million units.
Optical Coatings Industry Market Dynamics & Structure
The optical coatings market exhibits a moderately concentrated structure, with several key players commanding significant market share. However, a vibrant ecosystem of smaller, specialized companies fuels innovation and competitive intensity. Market growth is primarily driven by ongoing advancements in materials science and deposition techniques, particularly the increasing adoption of Atomic Layer Deposition (ALD). Stringent regulatory landscapes, encompassing environmental concerns (like RoHS compliance) and product safety standards, directly influence manufacturing processes and material choices. While alternative optical components exist, they often present performance limitations, restricting their applicability to specific niches and thereby sustaining demand for high-performance optical coatings. The end-user base is remarkably diverse, spanning numerous sectors, which contributes to the market's overall resilience and consistent growth. Mergers and acquisitions (M&A) activity demonstrates a moderate level of consolidation, reflecting strategic expansions by smaller firms and the ongoing pursuit of scale and technological integration by larger players.
- Market Concentration: Moderately concentrated, with leading players holding a significant but evolving market share. Precise figures require further specific market research data.
- Technological Innovation: Significant advancements in deposition techniques (e.g., ALD, sputtering, sol-gel) are driving performance improvements, cost reductions, and the creation of novel coating functionalities.
- Regulatory Frameworks: Environmental regulations (e.g., RoHS, REACH) and safety standards influence material selection, waste management practices, and manufacturing processes, demanding compliance and potentially impacting costs.
- Competitive Substitutes: While alternatives exist, the superior performance characteristics of optical coatings in many applications maintain strong market demand, especially in high-precision sectors.
- M&A Activity: Strategic acquisitions and partnerships are frequent, indicating a dynamic market landscape and a focus on technological synergy and expanded market reach.
- Innovation Barriers: High R&D costs, specialized expertise requirements, and the need for sophisticated equipment pose challenges for new entrants and smaller companies.
Optical Coatings Industry Growth Trends & Insights
The optical coatings market has demonstrated robust growth from 2019-2024, fueled by escalating demand across diverse sectors. While precise figures require up-to-date market analysis, projections suggest continued expansion. This growth is fueled by several key trends: the proliferation of AR/VR technologies, the increasing integration of advanced driver-assistance systems (ADAS) in the automotive industry, and the burgeoning use of optical sensors in healthcare and other advanced technologies. Consumer preferences for higher-quality, more efficient optical systems further bolster market expansion. The adoption of advanced coating techniques like ALD continues to rise, enhancing performance capabilities. While certain niche applications (aerospace and defense) demonstrate high market penetration, substantial growth opportunities remain across various untapped sectors.
Dominant Regions, Countries, or Segments in Optical Coatings Industry
North America and Asia (specifically, China, Japan, and South Korea) currently dominate the optical coatings market, driven by a strong presence of major players, substantial investments in R&D, and high demand across various end-user industries.
- Leading Regions: North America and Asia (China, Japan, South Korea) hold the largest market share.
- Dominant Product Type: Anti-reflective coatings maintain the largest market share due to widespread applications across multiple industries.
- Leading Technology: Ion-beam sputtering remains the dominant deposition technique due to its versatility and performance advantages.
- High-Growth End-user Industry: The electronics and semiconductors sector exhibits the highest growth rate driven by the increasing demand for advanced imaging and sensing systems.
Within product types, Anti-reflective coatings are currently leading due to their extensive use in various applications. In terms of technology, Ion-beam sputtering holds a dominant position for its versatility and ability to create high-quality coatings. The Electronics and Semiconductors sector is the fastest-growing end-user industry, driven by advancements in consumer electronics, data centers, and other technology-driven applications.
Optical Coatings Industry Product Landscape
The optical coatings market offers a wide array of products tailored to specific applications, encompassing anti-reflective, high-reflective, and other specialized coatings. Recent product innovations focus on enhancing durability, improving performance characteristics (e.g., wider spectral range, increased damage threshold), and developing cost-effective manufacturing processes. These advancements drive the adoption of optical coatings in new and existing applications, expanding the overall market potential. Key performance metrics include transmission, reflection, and scratch resistance. Unique selling propositions frequently emphasize improved durability, enhanced optical performance, and cost-effectiveness.
Key Drivers, Barriers & Challenges in Optical Coatings Industry
Key Drivers:
- Technological advancements continuously improving coating performance, expanding application possibilities, and enabling new functionalities.
- Growing demand across diverse end-user sectors, particularly electronics, automotive, telecommunications, and healthcare, is driving volume and revenue growth.
- Increased R&D investments foster innovation in materials science and deposition processes, leading to superior and more cost-effective solutions.
- The increasing need for precision and performance in various optical systems is creating further demand.
Key Challenges and Restraints:
- Fluctuations in raw material costs and potential supply chain disruptions can significantly impact profitability and production schedules.
- Stringent environmental regulations and increasing compliance costs add complexity to manufacturing processes and increase production expenses.
- Intense competition among established players and the emergence of new market entrants create price pressures and necessitate continuous innovation to maintain a competitive edge.
- Maintaining quality control and consistency across large-scale production remains a significant challenge.
Emerging Opportunities in Optical Coatings Industry
Emerging opportunities abound, driven by technological advancements and evolving market demands:
- The expansion of AR/VR and extended reality (XR) technologies is creating significant demand for specialized optical coatings.
- The biomedical and healthcare sectors present lucrative opportunities with coatings for medical devices, diagnostic tools, and therapeutic applications.
- The development of innovative coatings for energy-efficient applications, such as solar cells and energy-saving windows, is a key area of growth.
- The rise of flexible electronics and wearables opens new markets for adaptable, flexible, and durable optical coatings.
- Advancements in photonic integrated circuits (PICs) require specialized coatings.
Growth Accelerators in the Optical Coatings Industry
Long-term growth is driven by continued technological innovation, including the development of novel coating materials and advanced deposition techniques. Strategic partnerships between coating manufacturers and end-user companies will facilitate market penetration and drive adoption. Expansion into emerging markets, particularly in developing economies, offers significant growth potential.
Key Players Shaping the Optical Coatings Industry Market
- Nippon Sheet Glass Co Ltd
- Optical Coatings Technologies
- Sigmakoki Co Ltd
- Schott AG
- 3M
- PPG Industries Inc
- Quantum Coating
- Zeiss International
- Edmund Optics Inc
- DuPont
- Inrad Optics
- Artemis Optical Ltd
- Accucoat Inc
- Materion Corporation
- Abrisa Technologies
- Reynard Corporation
- Newport Corporation
- Zygo Corporation
Notable Milestones in Optical Coatings Industry Sector
- April 2022: Imatest partnered with Edmund Optics Inc., enhancing access to imaging performance evaluation tools.
- April 2022: Edmund Optics Inc. opened a new facility in New Jersey, expanding its capabilities and services.
- April 2022: Carl Zeiss Meditec acquired Kogent Surgical, LLC and Katalyst Surgical, LLC, strengthening its surgical solutions portfolio.
In-Depth Optical Coatings Industry Market Outlook
The optical coatings market is poised for substantial growth, propelled by consistent technological advancements, robust demand across diverse sectors, and strategic alliances among key players. The market's future trajectory will be shaped by the ongoing focus on delivering high-performance, cost-effective coatings and addressing the evolving needs of various end-users. Opportunities within emerging sectors, such as AR/VR, flexible electronics, biomedical applications, and sustainable technologies, represent significant potential for future growth. Companies demonstrating agility in adapting to technological advancements, maintaining robust supply chains, and forging strategic partnerships will likely be best positioned to capture the greatest share of this expanding market.
Optical Coatings Industry Segmentation
-
1. Product Type
- 1.1. Optical Filter Coatings
- 1.2. Anti-reflective Coatings
- 1.3. Transparent Conductive Coatings
- 1.4. Mirror Coatings (High Reflective)
- 1.5. Beam Splitter Coatings
- 1.6. Other Pr
-
2. Technology
- 2.1. Chemical Vapor Deposition
- 2.2. Ion-beam Sputtering
- 2.3. Plasma Sputtering
- 2.4. Atomic Layer Deposition
- 2.5. Sub-wavelength Structured Surfaces
-
3. End-user Industry
- 3.1. Aerospace and Defense
- 3.2. Electronics and Semiconductors
- 3.3. Telecommunications
- 3.4. Healthcare
- 3.5. Solar
- 3.6. Automotive
- 3.7. Other En
Optical Coatings Industry Segmentation By Geography
-
1. Asia Pacific
- 1.1. China
- 1.2. India
- 1.3. Japan
- 1.4. South Korea
- 1.5. Malaysia
- 1.6. Thailand
- 1.7. Indonesia
- 1.8. Vietnam
- 1.9. Rest of Asia Pacific
-
2. North America
- 2.1. United States
- 2.2. Canada
- 2.3. Mexico
-
3. Europe
- 3.1. Germany
- 3.2. United Kingdom
- 3.3. Italy
- 3.4. France
- 3.5. Spain
- 3.6. Nordic Countries
- 3.7. Turkey
- 3.8. Russia
- 3.9. Rest of Europe
-
4. South America
- 4.1. Brazil
- 4.2. Argentina
- 4.3. Colombia
- 4.4. Rest of South America
-
5. Middle East and Africa
- 5.1. Saudi Arabia
- 5.2. South Africa
- 5.3. Qatar
- 5.4. United Arab Emirates
- 5.5. Nigeria
- 5.6. Egypt
- 5.7. Rest of Middle East and Africa
Optical Coatings Industry REPORT HIGHLIGHTS
| Aspects | Details |
|---|---|
| Study Period | 2019-2033 |
| Base Year | 2024 |
| Estimated Year | 2025 |
| Forecast Period | 2025-2033 |
| Historical Period | 2019-2024 |
| Growth Rate | CAGR of 6.17% from 2019-2033 |
| Segmentation |
|
Table of Contents
- 1. Introduction
- 1.1. Research Scope
- 1.2. Market Segmentation
- 1.3. Research Methodology
- 1.4. Definitions and Assumptions
- 2. Executive Summary
- 2.1. Introduction
- 3. Market Dynamics
- 3.1. Introduction
- 3.2. Market Drivers
- 3.2.1. Growing Demand from the Solar Industry; Technological Advancements in the Optical Coatings Process
- 3.3. Market Restrains
- 3.3.1. High Costs and Some Limiting Properties of Optical Coatings
- 3.4. Market Trends
- 3.4.1. The Electronics and Semiconductors Segment is Expected to Dominate the Market
- 4. Market Factor Analysis
- 4.1. Porters Five Forces
- 4.2. Supply/Value Chain
- 4.3. PESTEL analysis
- 4.4. Market Entropy
- 4.5. Patent/Trademark Analysis
- 5. Global Optical Coatings Industry Analysis, Insights and Forecast, 2019-2031
- 5.1. Market Analysis, Insights and Forecast - by Product Type
- 5.1.1. Optical Filter Coatings
- 5.1.2. Anti-reflective Coatings
- 5.1.3. Transparent Conductive Coatings
- 5.1.4. Mirror Coatings (High Reflective)
- 5.1.5. Beam Splitter Coatings
- 5.1.6. Other Pr
- 5.2. Market Analysis, Insights and Forecast - by Technology
- 5.2.1. Chemical Vapor Deposition
- 5.2.2. Ion-beam Sputtering
- 5.2.3. Plasma Sputtering
- 5.2.4. Atomic Layer Deposition
- 5.2.5. Sub-wavelength Structured Surfaces
- 5.3. Market Analysis, Insights and Forecast - by End-user Industry
- 5.3.1. Aerospace and Defense
- 5.3.2. Electronics and Semiconductors
- 5.3.3. Telecommunications
- 5.3.4. Healthcare
- 5.3.5. Solar
- 5.3.6. Automotive
- 5.3.7. Other En
- 5.4. Market Analysis, Insights and Forecast - by Region
- 5.4.1. Asia Pacific
- 5.4.2. North America
- 5.4.3. Europe
- 5.4.4. South America
- 5.4.5. Middle East and Africa
- 5.1. Market Analysis, Insights and Forecast - by Product Type
- 6. Asia Pacific Optical Coatings Industry Analysis, Insights and Forecast, 2019-2031
- 6.1. Market Analysis, Insights and Forecast - by Product Type
- 6.1.1. Optical Filter Coatings
- 6.1.2. Anti-reflective Coatings
- 6.1.3. Transparent Conductive Coatings
- 6.1.4. Mirror Coatings (High Reflective)
- 6.1.5. Beam Splitter Coatings
- 6.1.6. Other Pr
- 6.2. Market Analysis, Insights and Forecast - by Technology
- 6.2.1. Chemical Vapor Deposition
- 6.2.2. Ion-beam Sputtering
- 6.2.3. Plasma Sputtering
- 6.2.4. Atomic Layer Deposition
- 6.2.5. Sub-wavelength Structured Surfaces
- 6.3. Market Analysis, Insights and Forecast - by End-user Industry
- 6.3.1. Aerospace and Defense
- 6.3.2. Electronics and Semiconductors
- 6.3.3. Telecommunications
- 6.3.4. Healthcare
- 6.3.5. Solar
- 6.3.6. Automotive
- 6.3.7. Other En
- 6.1. Market Analysis, Insights and Forecast - by Product Type
- 7. North America Optical Coatings Industry Analysis, Insights and Forecast, 2019-2031
- 7.1. Market Analysis, Insights and Forecast - by Product Type
- 7.1.1. Optical Filter Coatings
- 7.1.2. Anti-reflective Coatings
- 7.1.3. Transparent Conductive Coatings
- 7.1.4. Mirror Coatings (High Reflective)
- 7.1.5. Beam Splitter Coatings
- 7.1.6. Other Pr
- 7.2. Market Analysis, Insights and Forecast - by Technology
- 7.2.1. Chemical Vapor Deposition
- 7.2.2. Ion-beam Sputtering
- 7.2.3. Plasma Sputtering
- 7.2.4. Atomic Layer Deposition
- 7.2.5. Sub-wavelength Structured Surfaces
- 7.3. Market Analysis, Insights and Forecast - by End-user Industry
- 7.3.1. Aerospace and Defense
- 7.3.2. Electronics and Semiconductors
- 7.3.3. Telecommunications
- 7.3.4. Healthcare
- 7.3.5. Solar
- 7.3.6. Automotive
- 7.3.7. Other En
- 7.1. Market Analysis, Insights and Forecast - by Product Type
- 8. Europe Optical Coatings Industry Analysis, Insights and Forecast, 2019-2031
- 8.1. Market Analysis, Insights and Forecast - by Product Type
- 8.1.1. Optical Filter Coatings
- 8.1.2. Anti-reflective Coatings
- 8.1.3. Transparent Conductive Coatings
- 8.1.4. Mirror Coatings (High Reflective)
- 8.1.5. Beam Splitter Coatings
- 8.1.6. Other Pr
- 8.2. Market Analysis, Insights and Forecast - by Technology
- 8.2.1. Chemical Vapor Deposition
- 8.2.2. Ion-beam Sputtering
- 8.2.3. Plasma Sputtering
- 8.2.4. Atomic Layer Deposition
- 8.2.5. Sub-wavelength Structured Surfaces
- 8.3. Market Analysis, Insights and Forecast - by End-user Industry
- 8.3.1. Aerospace and Defense
- 8.3.2. Electronics and Semiconductors
- 8.3.3. Telecommunications
- 8.3.4. Healthcare
- 8.3.5. Solar
- 8.3.6. Automotive
- 8.3.7. Other En
- 8.1. Market Analysis, Insights and Forecast - by Product Type
- 9. South America Optical Coatings Industry Analysis, Insights and Forecast, 2019-2031
- 9.1. Market Analysis, Insights and Forecast - by Product Type
- 9.1.1. Optical Filter Coatings
- 9.1.2. Anti-reflective Coatings
- 9.1.3. Transparent Conductive Coatings
- 9.1.4. Mirror Coatings (High Reflective)
- 9.1.5. Beam Splitter Coatings
- 9.1.6. Other Pr
- 9.2. Market Analysis, Insights and Forecast - by Technology
- 9.2.1. Chemical Vapor Deposition
- 9.2.2. Ion-beam Sputtering
- 9.2.3. Plasma Sputtering
- 9.2.4. Atomic Layer Deposition
- 9.2.5. Sub-wavelength Structured Surfaces
- 9.3. Market Analysis, Insights and Forecast - by End-user Industry
- 9.3.1. Aerospace and Defense
- 9.3.2. Electronics and Semiconductors
- 9.3.3. Telecommunications
- 9.3.4. Healthcare
- 9.3.5. Solar
- 9.3.6. Automotive
- 9.3.7. Other En
- 9.1. Market Analysis, Insights and Forecast - by Product Type
- 10. Middle East and Africa Optical Coatings Industry Analysis, Insights and Forecast, 2019-2031
- 10.1. Market Analysis, Insights and Forecast - by Product Type
- 10.1.1. Optical Filter Coatings
- 10.1.2. Anti-reflective Coatings
- 10.1.3. Transparent Conductive Coatings
- 10.1.4. Mirror Coatings (High Reflective)
- 10.1.5. Beam Splitter Coatings
- 10.1.6. Other Pr
- 10.2. Market Analysis, Insights and Forecast - by Technology
- 10.2.1. Chemical Vapor Deposition
- 10.2.2. Ion-beam Sputtering
- 10.2.3. Plasma Sputtering
- 10.2.4. Atomic Layer Deposition
- 10.2.5. Sub-wavelength Structured Surfaces
- 10.3. Market Analysis, Insights and Forecast - by End-user Industry
- 10.3.1. Aerospace and Defense
- 10.3.2. Electronics and Semiconductors
- 10.3.3. Telecommunications
- 10.3.4. Healthcare
- 10.3.5. Solar
- 10.3.6. Automotive
- 10.3.7. Other En
- 10.1. Market Analysis, Insights and Forecast - by Product Type
- 11. Asia Pacific Optical Coatings Industry Analysis, Insights and Forecast, 2019-2031
- 11.1. Market Analysis, Insights and Forecast - By Country/Sub-region
- 11.1.1 China
- 11.1.2 India
- 11.1.3 Japan
- 11.1.4 South Korea
- 11.1.5 Rest of Asia Pacific
- 12. North America Optical Coatings Industry Analysis, Insights and Forecast, 2019-2031
- 12.1. Market Analysis, Insights and Forecast - By Country/Sub-region
- 12.1.1 United States
- 12.1.2 Canada
- 12.1.3 Mexico
- 13. Europe Optical Coatings Industry Analysis, Insights and Forecast, 2019-2031
- 13.1. Market Analysis, Insights and Forecast - By Country/Sub-region
- 13.1.1 Germany
- 13.1.2 United Kingdom
- 13.1.3 Italy
- 13.1.4 France
- 13.1.5 Rest of Europe
- 14. South America Optical Coatings Industry Analysis, Insights and Forecast, 2019-2031
- 14.1. Market Analysis, Insights and Forecast - By Country/Sub-region
- 14.1.1 Brazil
- 14.1.2 Argentina
- 14.1.3 Rest of South America
- 15. Middle East and Africa Optical Coatings Industry Analysis, Insights and Forecast, 2019-2031
- 15.1. Market Analysis, Insights and Forecast - By Country/Sub-region
- 15.1.1 Saudi Arabia
- 15.1.2 South Africa
- 15.1.3 Rest of Middle East and Africa
- 16. Competitive Analysis
- 16.1. Global Market Share Analysis 2024
- 16.2. Company Profiles
- 16.2.1 Nippon Sheet Glass Co Ltd
- 16.2.1.1. Overview
- 16.2.1.2. Products
- 16.2.1.3. SWOT Analysis
- 16.2.1.4. Recent Developments
- 16.2.1.5. Financials (Based on Availability)
- 16.2.2 Optical Coatings Technologies
- 16.2.2.1. Overview
- 16.2.2.2. Products
- 16.2.2.3. SWOT Analysis
- 16.2.2.4. Recent Developments
- 16.2.2.5. Financials (Based on Availability)
- 16.2.3 Sigmakoki Co Ltd
- 16.2.3.1. Overview
- 16.2.3.2. Products
- 16.2.3.3. SWOT Analysis
- 16.2.3.4. Recent Developments
- 16.2.3.5. Financials (Based on Availability)
- 16.2.4 Schott AG
- 16.2.4.1. Overview
- 16.2.4.2. Products
- 16.2.4.3. SWOT Analysis
- 16.2.4.4. Recent Developments
- 16.2.4.5. Financials (Based on Availability)
- 16.2.5 3M
- 16.2.5.1. Overview
- 16.2.5.2. Products
- 16.2.5.3. SWOT Analysis
- 16.2.5.4. Recent Developments
- 16.2.5.5. Financials (Based on Availability)
- 16.2.6 PPG Industries Inc
- 16.2.6.1. Overview
- 16.2.6.2. Products
- 16.2.6.3. SWOT Analysis
- 16.2.6.4. Recent Developments
- 16.2.6.5. Financials (Based on Availability)
- 16.2.7 Quantum Coating
- 16.2.7.1. Overview
- 16.2.7.2. Products
- 16.2.7.3. SWOT Analysis
- 16.2.7.4. Recent Developments
- 16.2.7.5. Financials (Based on Availability)
- 16.2.8 Zeiss International
- 16.2.8.1. Overview
- 16.2.8.2. Products
- 16.2.8.3. SWOT Analysis
- 16.2.8.4. Recent Developments
- 16.2.8.5. Financials (Based on Availability)
- 16.2.9 Edmund Optics Inc
- 16.2.9.1. Overview
- 16.2.9.2. Products
- 16.2.9.3. SWOT Analysis
- 16.2.9.4. Recent Developments
- 16.2.9.5. Financials (Based on Availability)
- 16.2.10 DuPont
- 16.2.10.1. Overview
- 16.2.10.2. Products
- 16.2.10.3. SWOT Analysis
- 16.2.10.4. Recent Developments
- 16.2.10.5. Financials (Based on Availability)
- 16.2.11 Inrad Optics
- 16.2.11.1. Overview
- 16.2.11.2. Products
- 16.2.11.3. SWOT Analysis
- 16.2.11.4. Recent Developments
- 16.2.11.5. Financials (Based on Availability)
- 16.2.12 Artemis Optical Ltd
- 16.2.12.1. Overview
- 16.2.12.2. Products
- 16.2.12.3. SWOT Analysis
- 16.2.12.4. Recent Developments
- 16.2.12.5. Financials (Based on Availability)
- 16.2.13 Accucoat Inc
- 16.2.13.1. Overview
- 16.2.13.2. Products
- 16.2.13.3. SWOT Analysis
- 16.2.13.4. Recent Developments
- 16.2.13.5. Financials (Based on Availability)
- 16.2.14 Materion Corporation
- 16.2.14.1. Overview
- 16.2.14.2. Products
- 16.2.14.3. SWOT Analysis
- 16.2.14.4. Recent Developments
- 16.2.14.5. Financials (Based on Availability)
- 16.2.15 Abrisa Technologies
- 16.2.15.1. Overview
- 16.2.15.2. Products
- 16.2.15.3. SWOT Analysis
- 16.2.15.4. Recent Developments
- 16.2.15.5. Financials (Based on Availability)
- 16.2.16 Reynard Corporation
- 16.2.16.1. Overview
- 16.2.16.2. Products
- 16.2.16.3. SWOT Analysis
- 16.2.16.4. Recent Developments
- 16.2.16.5. Financials (Based on Availability)
- 16.2.17 Newport Corporation
- 16.2.17.1. Overview
- 16.2.17.2. Products
- 16.2.17.3. SWOT Analysis
- 16.2.17.4. Recent Developments
- 16.2.17.5. Financials (Based on Availability)
- 16.2.18 Zygo Corporation*List Not Exhaustive
- 16.2.18.1. Overview
- 16.2.18.2. Products
- 16.2.18.3. SWOT Analysis
- 16.2.18.4. Recent Developments
- 16.2.18.5. Financials (Based on Availability)
- 16.2.1 Nippon Sheet Glass Co Ltd
List of Figures
- Figure 1: Global Optical Coatings Industry Revenue Breakdown (Million, %) by Region 2024 & 2032
- Figure 2: Asia Pacific Optical Coatings Industry Revenue (Million), by Country 2024 & 2032
- Figure 3: Asia Pacific Optical Coatings Industry Revenue Share (%), by Country 2024 & 2032
- Figure 4: North America Optical Coatings Industry Revenue (Million), by Country 2024 & 2032
- Figure 5: North America Optical Coatings Industry Revenue Share (%), by Country 2024 & 2032
- Figure 6: Europe Optical Coatings Industry Revenue (Million), by Country 2024 & 2032
- Figure 7: Europe Optical Coatings Industry Revenue Share (%), by Country 2024 & 2032
- Figure 8: South America Optical Coatings Industry Revenue (Million), by Country 2024 & 2032
- Figure 9: South America Optical Coatings Industry Revenue Share (%), by Country 2024 & 2032
- Figure 10: Middle East and Africa Optical Coatings Industry Revenue (Million), by Country 2024 & 2032
- Figure 11: Middle East and Africa Optical Coatings Industry Revenue Share (%), by Country 2024 & 2032
- Figure 12: Asia Pacific Optical Coatings Industry Revenue (Million), by Product Type 2024 & 2032
- Figure 13: Asia Pacific Optical Coatings Industry Revenue Share (%), by Product Type 2024 & 2032
- Figure 14: Asia Pacific Optical Coatings Industry Revenue (Million), by Technology 2024 & 2032
- Figure 15: Asia Pacific Optical Coatings Industry Revenue Share (%), by Technology 2024 & 2032
- Figure 16: Asia Pacific Optical Coatings Industry Revenue (Million), by End-user Industry 2024 & 2032
- Figure 17: Asia Pacific Optical Coatings Industry Revenue Share (%), by End-user Industry 2024 & 2032
- Figure 18: Asia Pacific Optical Coatings Industry Revenue (Million), by Country 2024 & 2032
- Figure 19: Asia Pacific Optical Coatings Industry Revenue Share (%), by Country 2024 & 2032
- Figure 20: North America Optical Coatings Industry Revenue (Million), by Product Type 2024 & 2032
- Figure 21: North America Optical Coatings Industry Revenue Share (%), by Product Type 2024 & 2032
- Figure 22: North America Optical Coatings Industry Revenue (Million), by Technology 2024 & 2032
- Figure 23: North America Optical Coatings Industry Revenue Share (%), by Technology 2024 & 2032
- Figure 24: North America Optical Coatings Industry Revenue (Million), by End-user Industry 2024 & 2032
- Figure 25: North America Optical Coatings Industry Revenue Share (%), by End-user Industry 2024 & 2032
- Figure 26: North America Optical Coatings Industry Revenue (Million), by Country 2024 & 2032
- Figure 27: North America Optical Coatings Industry Revenue Share (%), by Country 2024 & 2032
- Figure 28: Europe Optical Coatings Industry Revenue (Million), by Product Type 2024 & 2032
- Figure 29: Europe Optical Coatings Industry Revenue Share (%), by Product Type 2024 & 2032
- Figure 30: Europe Optical Coatings Industry Revenue (Million), by Technology 2024 & 2032
- Figure 31: Europe Optical Coatings Industry Revenue Share (%), by Technology 2024 & 2032
- Figure 32: Europe Optical Coatings Industry Revenue (Million), by End-user Industry 2024 & 2032
- Figure 33: Europe Optical Coatings Industry Revenue Share (%), by End-user Industry 2024 & 2032
- Figure 34: Europe Optical Coatings Industry Revenue (Million), by Country 2024 & 2032
- Figure 35: Europe Optical Coatings Industry Revenue Share (%), by Country 2024 & 2032
- Figure 36: South America Optical Coatings Industry Revenue (Million), by Product Type 2024 & 2032
- Figure 37: South America Optical Coatings Industry Revenue Share (%), by Product Type 2024 & 2032
- Figure 38: South America Optical Coatings Industry Revenue (Million), by Technology 2024 & 2032
- Figure 39: South America Optical Coatings Industry Revenue Share (%), by Technology 2024 & 2032
- Figure 40: South America Optical Coatings Industry Revenue (Million), by End-user Industry 2024 & 2032
- Figure 41: South America Optical Coatings Industry Revenue Share (%), by End-user Industry 2024 & 2032
- Figure 42: South America Optical Coatings Industry Revenue (Million), by Country 2024 & 2032
- Figure 43: South America Optical Coatings Industry Revenue Share (%), by Country 2024 & 2032
- Figure 44: Middle East and Africa Optical Coatings Industry Revenue (Million), by Product Type 2024 & 2032
- Figure 45: Middle East and Africa Optical Coatings Industry Revenue Share (%), by Product Type 2024 & 2032
- Figure 46: Middle East and Africa Optical Coatings Industry Revenue (Million), by Technology 2024 & 2032
- Figure 47: Middle East and Africa Optical Coatings Industry Revenue Share (%), by Technology 2024 & 2032
- Figure 48: Middle East and Africa Optical Coatings Industry Revenue (Million), by End-user Industry 2024 & 2032
- Figure 49: Middle East and Africa Optical Coatings Industry Revenue Share (%), by End-user Industry 2024 & 2032
- Figure 50: Middle East and Africa Optical Coatings Industry Revenue (Million), by Country 2024 & 2032
- Figure 51: Middle East and Africa Optical Coatings Industry Revenue Share (%), by Country 2024 & 2032
List of Tables
- Table 1: Global Optical Coatings Industry Revenue Million Forecast, by Region 2019 & 2032
- Table 2: Global Optical Coatings Industry Revenue Million Forecast, by Product Type 2019 & 2032
- Table 3: Global Optical Coatings Industry Revenue Million Forecast, by Technology 2019 & 2032
- Table 4: Global Optical Coatings Industry Revenue Million Forecast, by End-user Industry 2019 & 2032
- Table 5: Global Optical Coatings Industry Revenue Million Forecast, by Region 2019 & 2032
- Table 6: Global Optical Coatings Industry Revenue Million Forecast, by Country 2019 & 2032
- Table 7: China Optical Coatings Industry Revenue (Million) Forecast, by Application 2019 & 2032
- Table 8: India Optical Coatings Industry Revenue (Million) Forecast, by Application 2019 & 2032
- Table 9: Japan Optical Coatings Industry Revenue (Million) Forecast, by Application 2019 & 2032
- Table 10: South Korea Optical Coatings Industry Revenue (Million) Forecast, by Application 2019 & 2032
- Table 11: Rest of Asia Pacific Optical Coatings Industry Revenue (Million) Forecast, by Application 2019 & 2032
- Table 12: Global Optical Coatings Industry Revenue Million Forecast, by Country 2019 & 2032
- Table 13: United States Optical Coatings Industry Revenue (Million) Forecast, by Application 2019 & 2032
- Table 14: Canada Optical Coatings Industry Revenue (Million) Forecast, by Application 2019 & 2032
- Table 15: Mexico Optical Coatings Industry Revenue (Million) Forecast, by Application 2019 & 2032
- Table 16: Global Optical Coatings Industry Revenue Million Forecast, by Country 2019 & 2032
- Table 17: Germany Optical Coatings Industry Revenue (Million) Forecast, by Application 2019 & 2032
- Table 18: United Kingdom Optical Coatings Industry Revenue (Million) Forecast, by Application 2019 & 2032
- Table 19: Italy Optical Coatings Industry Revenue (Million) Forecast, by Application 2019 & 2032
- Table 20: France Optical Coatings Industry Revenue (Million) Forecast, by Application 2019 & 2032
- Table 21: Rest of Europe Optical Coatings Industry Revenue (Million) Forecast, by Application 2019 & 2032
- Table 22: Global Optical Coatings Industry Revenue Million Forecast, by Country 2019 & 2032
- Table 23: Brazil Optical Coatings Industry Revenue (Million) Forecast, by Application 2019 & 2032
- Table 24: Argentina Optical Coatings Industry Revenue (Million) Forecast, by Application 2019 & 2032
- Table 25: Rest of South America Optical Coatings Industry Revenue (Million) Forecast, by Application 2019 & 2032
- Table 26: Global Optical Coatings Industry Revenue Million Forecast, by Country 2019 & 2032
- Table 27: Saudi Arabia Optical Coatings Industry Revenue (Million) Forecast, by Application 2019 & 2032
- Table 28: South Africa Optical Coatings Industry Revenue (Million) Forecast, by Application 2019 & 2032
- Table 29: Rest of Middle East and Africa Optical Coatings Industry Revenue (Million) Forecast, by Application 2019 & 2032
- Table 30: Global Optical Coatings Industry Revenue Million Forecast, by Product Type 2019 & 2032
- Table 31: Global Optical Coatings Industry Revenue Million Forecast, by Technology 2019 & 2032
- Table 32: Global Optical Coatings Industry Revenue Million Forecast, by End-user Industry 2019 & 2032
- Table 33: Global Optical Coatings Industry Revenue Million Forecast, by Country 2019 & 2032
- Table 34: China Optical Coatings Industry Revenue (Million) Forecast, by Application 2019 & 2032
- Table 35: India Optical Coatings Industry Revenue (Million) Forecast, by Application 2019 & 2032
- Table 36: Japan Optical Coatings Industry Revenue (Million) Forecast, by Application 2019 & 2032
- Table 37: South Korea Optical Coatings Industry Revenue (Million) Forecast, by Application 2019 & 2032
- Table 38: Malaysia Optical Coatings Industry Revenue (Million) Forecast, by Application 2019 & 2032
- Table 39: Thailand Optical Coatings Industry Revenue (Million) Forecast, by Application 2019 & 2032
- Table 40: Indonesia Optical Coatings Industry Revenue (Million) Forecast, by Application 2019 & 2032
- Table 41: Vietnam Optical Coatings Industry Revenue (Million) Forecast, by Application 2019 & 2032
- Table 42: Rest of Asia Pacific Optical Coatings Industry Revenue (Million) Forecast, by Application 2019 & 2032
- Table 43: Global Optical Coatings Industry Revenue Million Forecast, by Product Type 2019 & 2032
- Table 44: Global Optical Coatings Industry Revenue Million Forecast, by Technology 2019 & 2032
- Table 45: Global Optical Coatings Industry Revenue Million Forecast, by End-user Industry 2019 & 2032
- Table 46: Global Optical Coatings Industry Revenue Million Forecast, by Country 2019 & 2032
- Table 47: United States Optical Coatings Industry Revenue (Million) Forecast, by Application 2019 & 2032
- Table 48: Canada Optical Coatings Industry Revenue (Million) Forecast, by Application 2019 & 2032
- Table 49: Mexico Optical Coatings Industry Revenue (Million) Forecast, by Application 2019 & 2032
- Table 50: Global Optical Coatings Industry Revenue Million Forecast, by Product Type 2019 & 2032
- Table 51: Global Optical Coatings Industry Revenue Million Forecast, by Technology 2019 & 2032
- Table 52: Global Optical Coatings Industry Revenue Million Forecast, by End-user Industry 2019 & 2032
- Table 53: Global Optical Coatings Industry Revenue Million Forecast, by Country 2019 & 2032
- Table 54: Germany Optical Coatings Industry Revenue (Million) Forecast, by Application 2019 & 2032
- Table 55: United Kingdom Optical Coatings Industry Revenue (Million) Forecast, by Application 2019 & 2032
- Table 56: Italy Optical Coatings Industry Revenue (Million) Forecast, by Application 2019 & 2032
- Table 57: France Optical Coatings Industry Revenue (Million) Forecast, by Application 2019 & 2032
- Table 58: Spain Optical Coatings Industry Revenue (Million) Forecast, by Application 2019 & 2032
- Table 59: Nordic Countries Optical Coatings Industry Revenue (Million) Forecast, by Application 2019 & 2032
- Table 60: Turkey Optical Coatings Industry Revenue (Million) Forecast, by Application 2019 & 2032
- Table 61: Russia Optical Coatings Industry Revenue (Million) Forecast, by Application 2019 & 2032
- Table 62: Rest of Europe Optical Coatings Industry Revenue (Million) Forecast, by Application 2019 & 2032
- Table 63: Global Optical Coatings Industry Revenue Million Forecast, by Product Type 2019 & 2032
- Table 64: Global Optical Coatings Industry Revenue Million Forecast, by Technology 2019 & 2032
- Table 65: Global Optical Coatings Industry Revenue Million Forecast, by End-user Industry 2019 & 2032
- Table 66: Global Optical Coatings Industry Revenue Million Forecast, by Country 2019 & 2032
- Table 67: Brazil Optical Coatings Industry Revenue (Million) Forecast, by Application 2019 & 2032
- Table 68: Argentina Optical Coatings Industry Revenue (Million) Forecast, by Application 2019 & 2032
- Table 69: Colombia Optical Coatings Industry Revenue (Million) Forecast, by Application 2019 & 2032
- Table 70: Rest of South America Optical Coatings Industry Revenue (Million) Forecast, by Application 2019 & 2032
- Table 71: Global Optical Coatings Industry Revenue Million Forecast, by Product Type 2019 & 2032
- Table 72: Global Optical Coatings Industry Revenue Million Forecast, by Technology 2019 & 2032
- Table 73: Global Optical Coatings Industry Revenue Million Forecast, by End-user Industry 2019 & 2032
- Table 74: Global Optical Coatings Industry Revenue Million Forecast, by Country 2019 & 2032
- Table 75: Saudi Arabia Optical Coatings Industry Revenue (Million) Forecast, by Application 2019 & 2032
- Table 76: South Africa Optical Coatings Industry Revenue (Million) Forecast, by Application 2019 & 2032
- Table 77: Qatar Optical Coatings Industry Revenue (Million) Forecast, by Application 2019 & 2032
- Table 78: United Arab Emirates Optical Coatings Industry Revenue (Million) Forecast, by Application 2019 & 2032
- Table 79: Nigeria Optical Coatings Industry Revenue (Million) Forecast, by Application 2019 & 2032
- Table 80: Egypt Optical Coatings Industry Revenue (Million) Forecast, by Application 2019 & 2032
- Table 81: Rest of Middle East and Africa Optical Coatings Industry Revenue (Million) Forecast, by Application 2019 & 2032
Frequently Asked Questions
1. What is the projected Compound Annual Growth Rate (CAGR) of the Optical Coatings Industry?
The projected CAGR is approximately 6.17%.
2. Which companies are prominent players in the Optical Coatings Industry?
Key companies in the market include Nippon Sheet Glass Co Ltd, Optical Coatings Technologies, Sigmakoki Co Ltd, Schott AG, 3M, PPG Industries Inc, Quantum Coating, Zeiss International, Edmund Optics Inc, DuPont, Inrad Optics, Artemis Optical Ltd, Accucoat Inc, Materion Corporation, Abrisa Technologies, Reynard Corporation, Newport Corporation, Zygo Corporation*List Not Exhaustive.
3. What are the main segments of the Optical Coatings Industry?
The market segments include Product Type, Technology, End-user Industry.
4. Can you provide details about the market size?
The market size is estimated to be USD 8.84 Million as of 2022.
5. What are some drivers contributing to market growth?
Growing Demand from the Solar Industry; Technological Advancements in the Optical Coatings Process.
6. What are the notable trends driving market growth?
The Electronics and Semiconductors Segment is Expected to Dominate the Market.
7. Are there any restraints impacting market growth?
High Costs and Some Limiting Properties of Optical Coatings.
8. Can you provide examples of recent developments in the market?
April 2022: Imatest announced a new partnership with Edmund Optics Inc. to enable its customers to buy Imatest software and charts via Edmund Optics' website seamlessly. Additionally, this partnership will allow Edmund Optics' imaging customers to easily acquire the tools needed to evaluate their imaging performance.
9. What pricing options are available for accessing the report?
Pricing options include single-user, multi-user, and enterprise licenses priced at USD 4750, USD 5250, and USD 8750 respectively.
10. Is the market size provided in terms of value or volume?
The market size is provided in terms of value, measured in Million.
11. Are there any specific market keywords associated with the report?
Yes, the market keyword associated with the report is "Optical Coatings Industry," which aids in identifying and referencing the specific market segment covered.
12. How do I determine which pricing option suits my needs best?
The pricing options vary based on user requirements and access needs. Individual users may opt for single-user licenses, while businesses requiring broader access may choose multi-user or enterprise licenses for cost-effective access to the report.
13. Are there any additional resources or data provided in the Optical Coatings Industry report?
While the report offers comprehensive insights, it's advisable to review the specific contents or supplementary materials provided to ascertain if additional resources or data are available.
14. How can I stay updated on further developments or reports in the Optical Coatings Industry?
To stay informed about further developments, trends, and reports in the Optical Coatings Industry, consider subscribing to industry newsletters, following relevant companies and organizations, or regularly checking reputable industry news sources and publications.
Methodology
Step 1 - Identification of Relevant Samples Size from Population Database


Step 2 - Approaches for Defining Global Market Size (Value, Volume* & Price*)

Note*: In applicable scenarios
Step 3 - Data Sources
Primary Research
- Web Analytics
- Survey Reports
- Research Institute
- Latest Research Reports
- Opinion Leaders
Secondary Research
- Annual Reports
- White Paper
- Latest Press Release
- Industry Association
- Paid Database
- Investor Presentations

Step 4 - Data Triangulation
Involves using different sources of information in order to increase the validity of a study
These sources are likely to be stakeholders in a program - participants, other researchers, program staff, other community members, and so on.
Then we put all data in single framework & apply various statistical tools to find out the dynamic on the market.
During the analysis stage, feedback from the stakeholder groups would be compared to determine areas of agreement as well as areas of divergence
