

Key Insights
The Physical Vapor Deposition (PVD) Coatings market is experiencing robust growth, projected to reach a market size of $10.46 billion in 2025 and maintain a Compound Annual Growth Rate (CAGR) of 6.43% from 2025 to 2033. This expansion is driven by increasing demand across diverse sectors, including automotive, aerospace, electronics, and medical devices. The automotive industry's push for lightweighting and enhanced durability is a major contributor, with PVD coatings offering superior corrosion resistance, hardness, and aesthetic appeal. Similarly, the aerospace sector's stringent requirements for high-performance materials are fueling the adoption of PVD coatings for improved engine efficiency and component lifespan. The electronics industry leverages PVD for creating advanced microelectronics and enhancing the performance of semiconductors, while the medical sector utilizes these coatings for biocompatibility and sterilization in implants and instruments. Technological advancements in PVD techniques, particularly in areas like high-rate sputtering and atomic layer deposition, are further enhancing the quality and efficiency of coating processes, leading to broader applications and increased market penetration. Competitive landscape analysis reveals a mix of established players like Oerlikon, Mitsubishi Materials, and IHI Corporation, alongside specialized companies like Crystallume PVD and Impact Coatings AB, indicating a dynamic market with opportunities for both large and smaller firms.
The restraints to market growth are primarily related to the relatively high initial investment costs associated with PVD equipment and the specialized expertise required for effective implementation. Furthermore, environmental regulations concerning the emission of certain PVD process by-products can pose challenges for manufacturers. However, ongoing innovations are addressing these limitations, leading to more environmentally friendly and cost-effective PVD processes. The segmentation of the market is likely diverse, encompassing various coating materials (e.g., titanium nitride, chromium nitride, diamond-like carbon), application methods (e.g., sputtering, evaporation), and end-use industries. Future growth will likely be shaped by advancements in materials science, leading to new PVD coatings with enhanced properties, and the continued adoption of PVD technology across emerging applications. The consistent CAGR and diverse drivers suggest a positive outlook for the PVD coatings market over the forecast period.
Physical Vapor Deposition (PVD) Coatings Industry Market Report: 2019-2033
This comprehensive report provides a detailed analysis of the Physical Vapor Deposition (PVD) Coatings industry, encompassing market dynamics, growth trends, regional dominance, product landscape, key players, and future outlook. The study period covers 2019-2033, with 2025 as the base year and estimated year. The report offers invaluable insights for industry professionals, investors, and strategic decision-makers seeking to navigate this dynamic market. Market values are presented in millions of units ($USD).
Physical Vapor Deposition Coatings Industry Market Dynamics & Structure
The PVD coatings market is characterized by moderate concentration, with a few major players and numerous smaller niche players. Technological innovation, driven by advancements in materials science and coating techniques, is a key driver. Stringent environmental regulations regarding hazardous materials are shaping industry practices, while the availability of competitive substitutes like chemical vapor deposition (CVD) influences market share. End-user demographics are diverse, spanning automotive, aerospace, medical, and electronics sectors. M&A activity has been moderate, with strategic acquisitions aimed at expanding geographical reach and technological capabilities.
- Market Concentration: Moderately concentrated, with top 5 players holding approximately xx% market share in 2024.
- Technological Innovation: Continuous improvements in coating materials, deposition techniques (e.g., sputtering, evaporation), and process control.
- Regulatory Framework: Stringent environmental regulations influence material choices and waste management practices.
- Competitive Substitutes: CVD coatings present a competitive alternative, particularly in specific applications.
- End-User Demographics: Automotive, aerospace, medical implants, electronics, and tools are major end-use segments.
- M&A Trends: Strategic acquisitions focused on technology expansion and market penetration. Approximately xx M&A deals were recorded between 2019 and 2024.
Physical Vapor Deposition Coatings Industry Growth Trends & Insights
The global Physical Vapor Deposition (PVD) coatings market has demonstrated robust expansion over the historical period (2019-2024), fueled by escalating demand across a diverse spectrum of end-use industries. Projections indicate a continued upward trajectory, with an anticipated Compound Annual Growth Rate (CAGR) of [Insert specific CAGR value here, e.g., 7.5%] during the forecast period (2025-2033). This growth is expected to culminate in a market valuation of [Insert specific market value here, e.g., $15.2 billion] by 2033. Key drivers underpinning this expansion include the accelerating adoption of PVD coatings in sophisticated manufacturing processes, a burgeoning need for surfaces exhibiting superior durability and enhanced aesthetic appeal, and ongoing technological breakthroughs that consistently elevate coating performance and deposition efficiency. Consumer preferences are increasingly leaning towards products that offer discernible improvements in both functionality and visual attractiveness, thereby bolstering the demand for PVD-coated components. Furthermore, disruptive innovations, such as the creation of novel coating materials and the refinement of advanced deposition methodologies, are acting as significant catalysts for market proliferation. The penetration of PVD coatings across various industrial sectors is experiencing sustained and significant growth.
Dominant Regions, Countries, or Segments in Physical Vapor Deposition Coatings Industry
North America and Europe currently dominate the PVD coatings market, driven by strong industrial infrastructure, technological advancements, and high adoption rates in key end-use sectors. However, Asia-Pacific is witnessing rapid growth, fueled by expanding manufacturing activities, particularly in China and India. The automotive and electronics sectors are major drivers of growth in these regions.
- North America: High adoption rates in automotive and aerospace industries. Strong R&D activity.
- Europe: Well-established manufacturing base, strong focus on sustainability, and high demand for advanced coatings.
- Asia-Pacific: Rapid industrialization, significant investments in manufacturing, and increasing consumer demand.
- Rest of the World: Gradual growth driven by specific niche applications and emerging economies.
Physical Vapor Deposition Coatings Industry Product Landscape
The PVD coatings market encompasses a comprehensive array of products designed to meet a wide range of application requirements. This includes highly sought-after decorative coatings, engineered to significantly enhance the aesthetic appeal and visual sophistication of various substrates. Alongside these, functional coatings play a critical role in bolstering performance characteristics such as superior wear resistance, robust corrosion protection, and exceptional high-temperature stability, extending the lifespan and reliability of components. A specialized segment caters to niche applications, offering tailored solutions for sensitive fields like biomedical devices and precision optical components. Continuous technological advancements are at the forefront of refining coating properties, leading to marked improvements in hardness, interlayer adhesion, and overall corrosion resistance. The unique selling propositions that differentiate market players often revolve around delivering demonstrably enhanced performance metrics, offering highly customizable functionalities to meet specific client needs, and championing sustainable manufacturing practices that minimize environmental impact.
Key Drivers, Barriers & Challenges in Physical Vapor Deposition Coatings Industry
Key Drivers:
- Increasing demand from automotive and electronics industries.
- Advancements in coating materials and deposition technologies.
- Rising demand for durable and aesthetically pleasing coatings.
Key Challenges:
- High initial investment costs for PVD coating equipment.
- Stringent environmental regulations and waste management concerns.
- Competition from other surface treatment technologies (e.g., CVD, electroplating).
- Supply chain disruptions resulting in increased material costs and delivery delays (approximately xx% increase in material costs observed in 2023).
Emerging Opportunities in Physical Vapor Deposition Coatings Industry
The PVD coatings industry is witnessing the emergence of compelling new opportunities across several dynamic sectors. A significant growth area lies in the escalating demand for PVD coatings within the burgeoning renewable energy sector, particularly for critical applications in solar cells and hydrogen fuel cells, where efficiency and durability are paramount. Concurrently, the healthcare industry is increasingly embracing advanced PVD coatings for medical devices, driven by the need for biocompatibility, wear resistance, and antimicrobial properties. A concerted effort is also underway in the development of novel, sustainable, and eco-friendly coating materials, responding to global environmental imperatives. Furthermore, untapped markets within developing economies represent substantial and largely unexplored avenues for significant growth and market penetration.
Growth Accelerators in the Physical Vapor Deposition Coatings Industry
Technological breakthroughs in materials science and coating techniques will continue to drive market expansion. Strategic partnerships between PVD coating providers and end-use industries will facilitate technology adoption and market penetration. Market expansion strategies focusing on emerging economies and niche applications will further fuel growth.
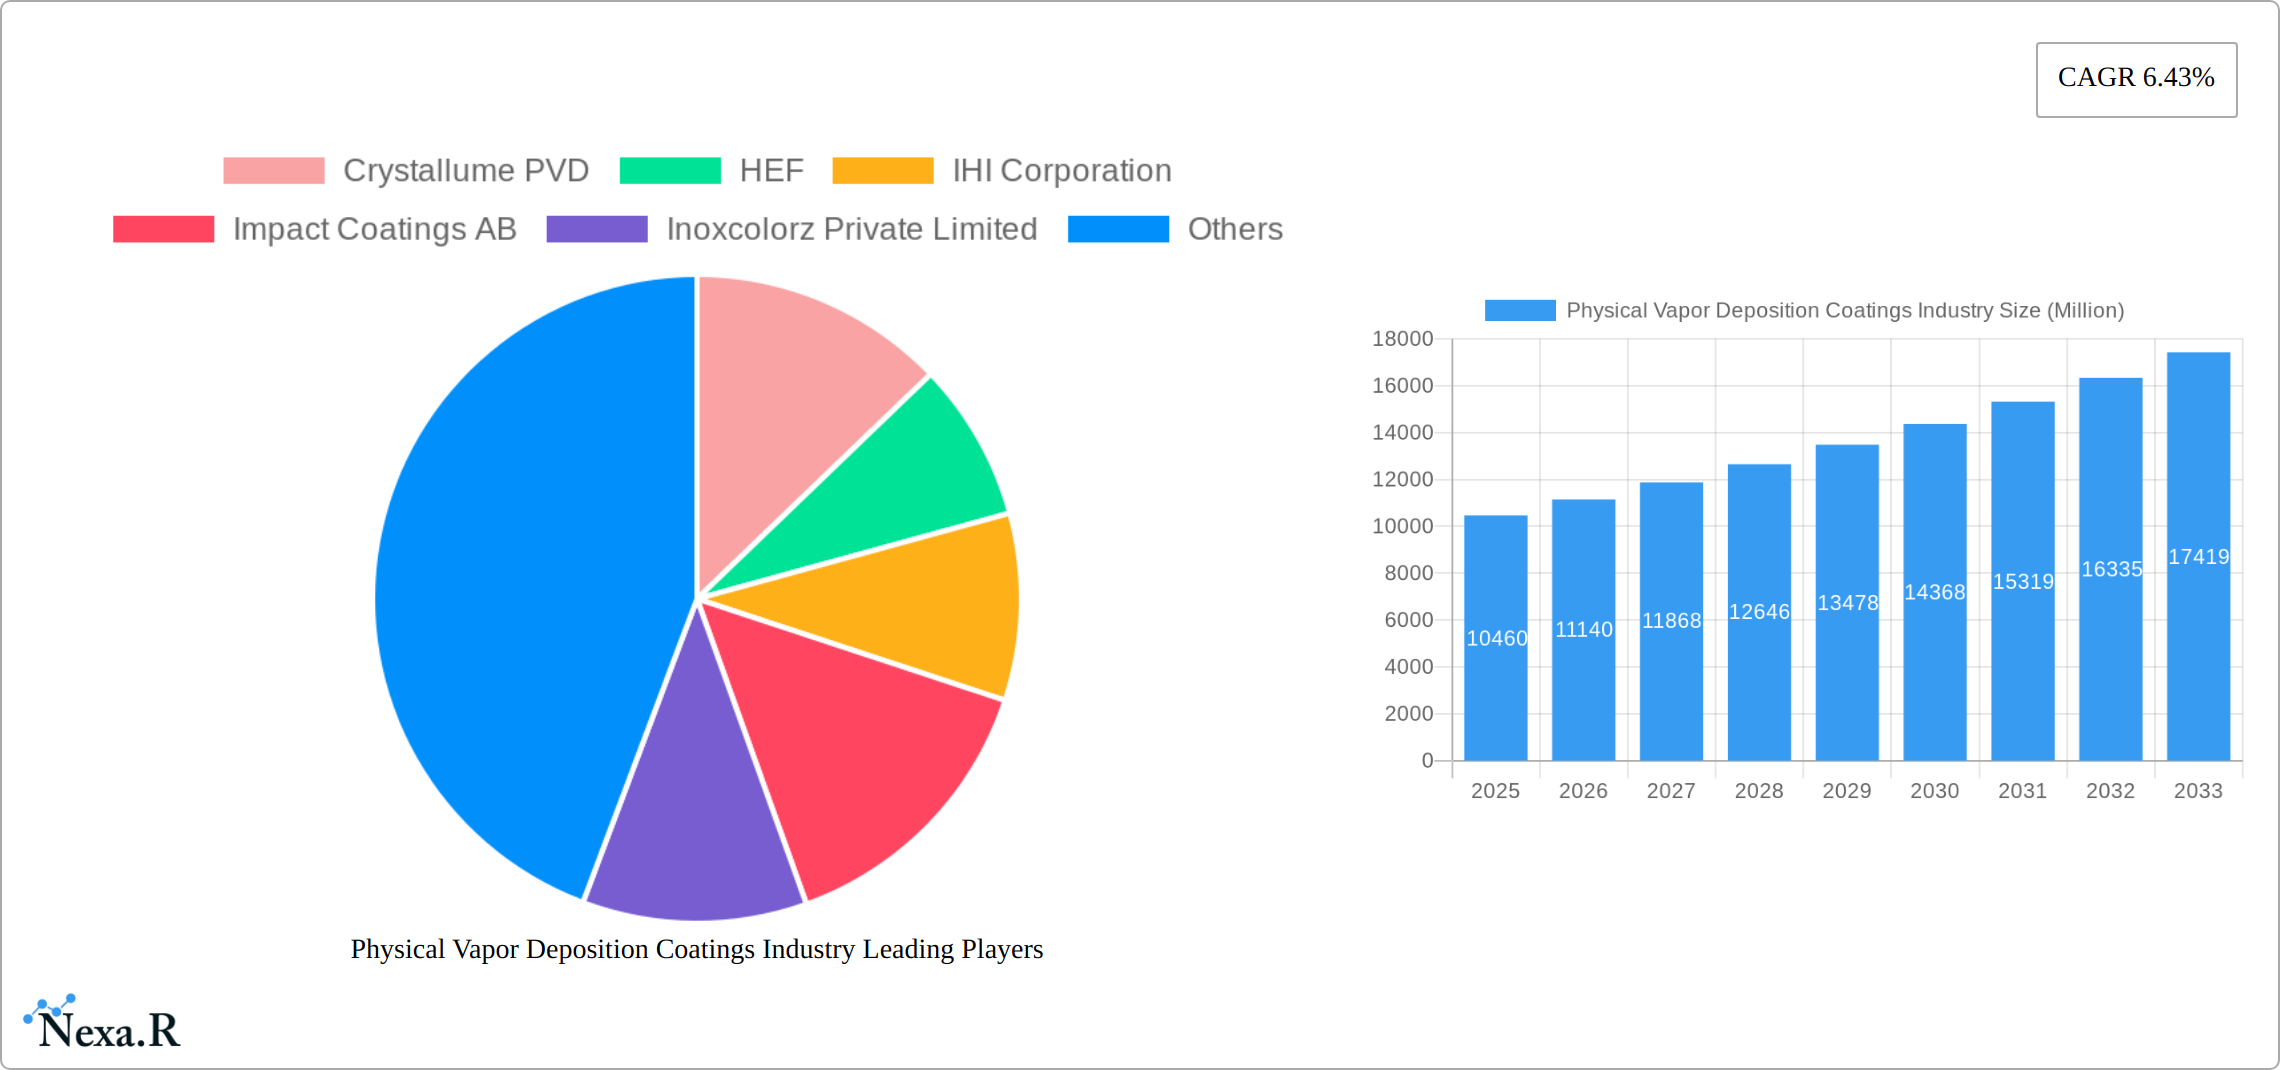
Key Players Shaping the Physical Vapor Deposition Coatings Industry Market
- Crystallume PVD
- HEF
- IHI Corporation
- Impact Coatings AB
- Inoxcolorz Private Limited
- KOLZER SRL
- Mitsubishi Materials Corporation
- OC Oerlikon Management AG
- Red Spot Paint & Varnish Company Inc
- Richter Precision Inc
- Sputtek Advanced Metallurgical Coatings
- Surface Modification Technologies
- TOCALO Co Ltd
- voestalpine eifeler Group
*List Not Exhaustive
Notable Milestones in Physical Vapor Deposition Coatings Industry Sector
- April 2022: Impact Coatings strategically expanded its global footprint and strengthened its position in the rapidly growing hydrogen solutions market with the establishment of a dedicated Chinese subsidiary.
- January 2022: IHI Ionbond made a significant investment in augmenting its decorative coating capacity, acquiring a state-of-the-art Hauzer Flexicoat 1500 PVD system to enhance production capabilities and meet increasing demand for high-quality decorative finishes.
In-Depth Physical Vapor Deposition Coatings Industry Market Outlook
The PVD coatings market is robustly positioned for sustained and significant growth, propelled by a confluence of factors including relentless technological innovation, burgeoning demand from a diverse array of end-use sectors, and strategic expansion into promising emerging markets. Future success will be intrinsically linked to prudent strategic investments in cutting-edge research and development (R&D), the forging of synergistic partnerships, and the unwavering commitment to sustainable operational practices. The market landscape offers substantial opportunities for companies adept at developing and delivering innovative, high-performance coatings that are precisely tailored to meet the unique and evolving application-specific requirements of their clientele.
Physical Vapor Deposition Coatings Industry Segmentation
-
1. Substrate
- 1.1. Metals
- 1.2. Plastics
- 1.3. Glass
-
2. Material Type
- 2.1. Metals (Includes Alloys)
- 2.2. Ceramics
- 2.3. Other Material Types
-
3. End User
- 3.1. Tools
-
3.2. Components
- 3.2.1. Aerospace and Defense
- 3.2.2. Automotive
- 3.2.3. Electronics and Semiconductors (Including Optics)
- 3.2.4. Power Generation
- 3.2.5. Other Co
Physical Vapor Deposition Coatings Industry Segmentation By Geography
-
1. Asia Pacific
- 1.1. China
- 1.2. India
- 1.3. Japan
- 1.4. South Korea
- 1.5. Malaysia
- 1.6. Thailand
- 1.7. Indonesia
- 1.8. Vietnam
- 1.9. Rest of Asia Pacific
-
2. North America
- 2.1. United States
- 2.2. Canada
- 2.3. Mexico
-
3. Europe
- 3.1. Germany
- 3.2. United Kingdom
- 3.3. France
- 3.4. Italy
- 3.5. Spain
- 3.6. Turkey
- 3.7. Russia
- 3.8. NORDIC Countries
- 3.9. Rest of Europe
-
4. South America
- 4.1. Brazil
- 4.2. Argentina
- 4.3. Colombia
- 4.4. Rest of South America
-
5. Middle East and Africa
- 5.1. Saudi Arabia
- 5.2. Nigeria
- 5.3. Qatar
- 5.4. Egypt
- 5.5. United Arab Emirates
- 5.6. South Africa
- 5.7. Rest of Middle East and Africa

Physical Vapor Deposition Coatings Industry REPORT HIGHLIGHTS
| Aspects | Details |
|---|---|
| Study Period | 2019-2033 |
| Base Year | 2024 |
| Estimated Year | 2025 |
| Forecast Period | 2025-2033 |
| Historical Period | 2019-2024 |
| Growth Rate | CAGR of 6.43% from 2019-2033 |
| Segmentation |
|
Table of Contents
- 1. Introduction
- 1.1. Research Scope
- 1.2. Market Segmentation
- 1.3. Research Methodology
- 1.4. Definitions and Assumptions
- 2. Executive Summary
- 2.1. Introduction
- 3. Market Dynamics
- 3.1. Introduction
- 3.2. Market Drivers
- 3.2.1. Demand from the Electronics Sector; Increasing Usage in Medical Industry; Other Drivers
- 3.3. Market Restrains
- 3.3.1. Demand from the Electronics Sector; Increasing Usage in Medical Industry; Other Drivers
- 3.4. Market Trends
- 3.4.1. The Automotive Industry is Expected to Dominate the Market Studied
- 4. Market Factor Analysis
- 4.1. Porters Five Forces
- 4.2. Supply/Value Chain
- 4.3. PESTEL analysis
- 4.4. Market Entropy
- 4.5. Patent/Trademark Analysis
- 5. Global Physical Vapor Deposition Coatings Industry Analysis, Insights and Forecast, 2019-2031
- 5.1. Market Analysis, Insights and Forecast - by Substrate
- 5.1.1. Metals
- 5.1.2. Plastics
- 5.1.3. Glass
- 5.2. Market Analysis, Insights and Forecast - by Material Type
- 5.2.1. Metals (Includes Alloys)
- 5.2.2. Ceramics
- 5.2.3. Other Material Types
- 5.3. Market Analysis, Insights and Forecast - by End User
- 5.3.1. Tools
- 5.3.2. Components
- 5.3.2.1. Aerospace and Defense
- 5.3.2.2. Automotive
- 5.3.2.3. Electronics and Semiconductors (Including Optics)
- 5.3.2.4. Power Generation
- 5.3.2.5. Other Co
- 5.4. Market Analysis, Insights and Forecast - by Region
- 5.4.1. Asia Pacific
- 5.4.2. North America
- 5.4.3. Europe
- 5.4.4. South America
- 5.4.5. Middle East and Africa
- 5.1. Market Analysis, Insights and Forecast - by Substrate
- 6. Asia Pacific Physical Vapor Deposition Coatings Industry Analysis, Insights and Forecast, 2019-2031
- 6.1. Market Analysis, Insights and Forecast - by Substrate
- 6.1.1. Metals
- 6.1.2. Plastics
- 6.1.3. Glass
- 6.2. Market Analysis, Insights and Forecast - by Material Type
- 6.2.1. Metals (Includes Alloys)
- 6.2.2. Ceramics
- 6.2.3. Other Material Types
- 6.3. Market Analysis, Insights and Forecast - by End User
- 6.3.1. Tools
- 6.3.2. Components
- 6.3.2.1. Aerospace and Defense
- 6.3.2.2. Automotive
- 6.3.2.3. Electronics and Semiconductors (Including Optics)
- 6.3.2.4. Power Generation
- 6.3.2.5. Other Co
- 6.1. Market Analysis, Insights and Forecast - by Substrate
- 7. North America Physical Vapor Deposition Coatings Industry Analysis, Insights and Forecast, 2019-2031
- 7.1. Market Analysis, Insights and Forecast - by Substrate
- 7.1.1. Metals
- 7.1.2. Plastics
- 7.1.3. Glass
- 7.2. Market Analysis, Insights and Forecast - by Material Type
- 7.2.1. Metals (Includes Alloys)
- 7.2.2. Ceramics
- 7.2.3. Other Material Types
- 7.3. Market Analysis, Insights and Forecast - by End User
- 7.3.1. Tools
- 7.3.2. Components
- 7.3.2.1. Aerospace and Defense
- 7.3.2.2. Automotive
- 7.3.2.3. Electronics and Semiconductors (Including Optics)
- 7.3.2.4. Power Generation
- 7.3.2.5. Other Co
- 7.1. Market Analysis, Insights and Forecast - by Substrate
- 8. Europe Physical Vapor Deposition Coatings Industry Analysis, Insights and Forecast, 2019-2031
- 8.1. Market Analysis, Insights and Forecast - by Substrate
- 8.1.1. Metals
- 8.1.2. Plastics
- 8.1.3. Glass
- 8.2. Market Analysis, Insights and Forecast - by Material Type
- 8.2.1. Metals (Includes Alloys)
- 8.2.2. Ceramics
- 8.2.3. Other Material Types
- 8.3. Market Analysis, Insights and Forecast - by End User
- 8.3.1. Tools
- 8.3.2. Components
- 8.3.2.1. Aerospace and Defense
- 8.3.2.2. Automotive
- 8.3.2.3. Electronics and Semiconductors (Including Optics)
- 8.3.2.4. Power Generation
- 8.3.2.5. Other Co
- 8.1. Market Analysis, Insights and Forecast - by Substrate
- 9. South America Physical Vapor Deposition Coatings Industry Analysis, Insights and Forecast, 2019-2031
- 9.1. Market Analysis, Insights and Forecast - by Substrate
- 9.1.1. Metals
- 9.1.2. Plastics
- 9.1.3. Glass
- 9.2. Market Analysis, Insights and Forecast - by Material Type
- 9.2.1. Metals (Includes Alloys)
- 9.2.2. Ceramics
- 9.2.3. Other Material Types
- 9.3. Market Analysis, Insights and Forecast - by End User
- 9.3.1. Tools
- 9.3.2. Components
- 9.3.2.1. Aerospace and Defense
- 9.3.2.2. Automotive
- 9.3.2.3. Electronics and Semiconductors (Including Optics)
- 9.3.2.4. Power Generation
- 9.3.2.5. Other Co
- 9.1. Market Analysis, Insights and Forecast - by Substrate
- 10. Middle East and Africa Physical Vapor Deposition Coatings Industry Analysis, Insights and Forecast, 2019-2031
- 10.1. Market Analysis, Insights and Forecast - by Substrate
- 10.1.1. Metals
- 10.1.2. Plastics
- 10.1.3. Glass
- 10.2. Market Analysis, Insights and Forecast - by Material Type
- 10.2.1. Metals (Includes Alloys)
- 10.2.2. Ceramics
- 10.2.3. Other Material Types
- 10.3. Market Analysis, Insights and Forecast - by End User
- 10.3.1. Tools
- 10.3.2. Components
- 10.3.2.1. Aerospace and Defense
- 10.3.2.2. Automotive
- 10.3.2.3. Electronics and Semiconductors (Including Optics)
- 10.3.2.4. Power Generation
- 10.3.2.5. Other Co
- 10.1. Market Analysis, Insights and Forecast - by Substrate
- 11. Competitive Analysis
- 11.1. Global Market Share Analysis 2024
- 11.2. Company Profiles
- 11.2.1 Crystallume PVD
- 11.2.1.1. Overview
- 11.2.1.2. Products
- 11.2.1.3. SWOT Analysis
- 11.2.1.4. Recent Developments
- 11.2.1.5. Financials (Based on Availability)
- 11.2.2 HEF
- 11.2.2.1. Overview
- 11.2.2.2. Products
- 11.2.2.3. SWOT Analysis
- 11.2.2.4. Recent Developments
- 11.2.2.5. Financials (Based on Availability)
- 11.2.3 IHI Corporation
- 11.2.3.1. Overview
- 11.2.3.2. Products
- 11.2.3.3. SWOT Analysis
- 11.2.3.4. Recent Developments
- 11.2.3.5. Financials (Based on Availability)
- 11.2.4 Impact Coatings AB
- 11.2.4.1. Overview
- 11.2.4.2. Products
- 11.2.4.3. SWOT Analysis
- 11.2.4.4. Recent Developments
- 11.2.4.5. Financials (Based on Availability)
- 11.2.5 Inoxcolorz Private Limited
- 11.2.5.1. Overview
- 11.2.5.2. Products
- 11.2.5.3. SWOT Analysis
- 11.2.5.4. Recent Developments
- 11.2.5.5. Financials (Based on Availability)
- 11.2.6 KOLZER SRL
- 11.2.6.1. Overview
- 11.2.6.2. Products
- 11.2.6.3. SWOT Analysis
- 11.2.6.4. Recent Developments
- 11.2.6.5. Financials (Based on Availability)
- 11.2.7 Mitsubishi Materials Corporation
- 11.2.7.1. Overview
- 11.2.7.2. Products
- 11.2.7.3. SWOT Analysis
- 11.2.7.4. Recent Developments
- 11.2.7.5. Financials (Based on Availability)
- 11.2.8 OC Oerlikon Management AG
- 11.2.8.1. Overview
- 11.2.8.2. Products
- 11.2.8.3. SWOT Analysis
- 11.2.8.4. Recent Developments
- 11.2.8.5. Financials (Based on Availability)
- 11.2.9 Red Spot Paint & Varnish Company Inc
- 11.2.9.1. Overview
- 11.2.9.2. Products
- 11.2.9.3. SWOT Analysis
- 11.2.9.4. Recent Developments
- 11.2.9.5. Financials (Based on Availability)
- 11.2.10 Richter Precision Inc
- 11.2.10.1. Overview
- 11.2.10.2. Products
- 11.2.10.3. SWOT Analysis
- 11.2.10.4. Recent Developments
- 11.2.10.5. Financials (Based on Availability)
- 11.2.11 Sputtek Advanced Metallurgical Coatings
- 11.2.11.1. Overview
- 11.2.11.2. Products
- 11.2.11.3. SWOT Analysis
- 11.2.11.4. Recent Developments
- 11.2.11.5. Financials (Based on Availability)
- 11.2.12 Surface Modification Technologies
- 11.2.12.1. Overview
- 11.2.12.2. Products
- 11.2.12.3. SWOT Analysis
- 11.2.12.4. Recent Developments
- 11.2.12.5. Financials (Based on Availability)
- 11.2.13 TOCALO Co Ltd
- 11.2.13.1. Overview
- 11.2.13.2. Products
- 11.2.13.3. SWOT Analysis
- 11.2.13.4. Recent Developments
- 11.2.13.5. Financials (Based on Availability)
- 11.2.14 voestalpine eifeler Group*List Not Exhaustive
- 11.2.14.1. Overview
- 11.2.14.2. Products
- 11.2.14.3. SWOT Analysis
- 11.2.14.4. Recent Developments
- 11.2.14.5. Financials (Based on Availability)
- 11.2.1 Crystallume PVD
List of Figures
- Figure 1: Global Physical Vapor Deposition Coatings Industry Revenue Breakdown (Million, %) by Region 2024 & 2032
- Figure 2: Global Physical Vapor Deposition Coatings Industry Volume Breakdown (Billion, %) by Region 2024 & 2032
- Figure 3: Asia Pacific Physical Vapor Deposition Coatings Industry Revenue (Million), by Substrate 2024 & 2032
- Figure 4: Asia Pacific Physical Vapor Deposition Coatings Industry Volume (Billion), by Substrate 2024 & 2032
- Figure 5: Asia Pacific Physical Vapor Deposition Coatings Industry Revenue Share (%), by Substrate 2024 & 2032
- Figure 6: Asia Pacific Physical Vapor Deposition Coatings Industry Volume Share (%), by Substrate 2024 & 2032
- Figure 7: Asia Pacific Physical Vapor Deposition Coatings Industry Revenue (Million), by Material Type 2024 & 2032
- Figure 8: Asia Pacific Physical Vapor Deposition Coatings Industry Volume (Billion), by Material Type 2024 & 2032
- Figure 9: Asia Pacific Physical Vapor Deposition Coatings Industry Revenue Share (%), by Material Type 2024 & 2032
- Figure 10: Asia Pacific Physical Vapor Deposition Coatings Industry Volume Share (%), by Material Type 2024 & 2032
- Figure 11: Asia Pacific Physical Vapor Deposition Coatings Industry Revenue (Million), by End User 2024 & 2032
- Figure 12: Asia Pacific Physical Vapor Deposition Coatings Industry Volume (Billion), by End User 2024 & 2032
- Figure 13: Asia Pacific Physical Vapor Deposition Coatings Industry Revenue Share (%), by End User 2024 & 2032
- Figure 14: Asia Pacific Physical Vapor Deposition Coatings Industry Volume Share (%), by End User 2024 & 2032
- Figure 15: Asia Pacific Physical Vapor Deposition Coatings Industry Revenue (Million), by Country 2024 & 2032
- Figure 16: Asia Pacific Physical Vapor Deposition Coatings Industry Volume (Billion), by Country 2024 & 2032
- Figure 17: Asia Pacific Physical Vapor Deposition Coatings Industry Revenue Share (%), by Country 2024 & 2032
- Figure 18: Asia Pacific Physical Vapor Deposition Coatings Industry Volume Share (%), by Country 2024 & 2032
- Figure 19: North America Physical Vapor Deposition Coatings Industry Revenue (Million), by Substrate 2024 & 2032
- Figure 20: North America Physical Vapor Deposition Coatings Industry Volume (Billion), by Substrate 2024 & 2032
- Figure 21: North America Physical Vapor Deposition Coatings Industry Revenue Share (%), by Substrate 2024 & 2032
- Figure 22: North America Physical Vapor Deposition Coatings Industry Volume Share (%), by Substrate 2024 & 2032
- Figure 23: North America Physical Vapor Deposition Coatings Industry Revenue (Million), by Material Type 2024 & 2032
- Figure 24: North America Physical Vapor Deposition Coatings Industry Volume (Billion), by Material Type 2024 & 2032
- Figure 25: North America Physical Vapor Deposition Coatings Industry Revenue Share (%), by Material Type 2024 & 2032
- Figure 26: North America Physical Vapor Deposition Coatings Industry Volume Share (%), by Material Type 2024 & 2032
- Figure 27: North America Physical Vapor Deposition Coatings Industry Revenue (Million), by End User 2024 & 2032
- Figure 28: North America Physical Vapor Deposition Coatings Industry Volume (Billion), by End User 2024 & 2032
- Figure 29: North America Physical Vapor Deposition Coatings Industry Revenue Share (%), by End User 2024 & 2032
- Figure 30: North America Physical Vapor Deposition Coatings Industry Volume Share (%), by End User 2024 & 2032
- Figure 31: North America Physical Vapor Deposition Coatings Industry Revenue (Million), by Country 2024 & 2032
- Figure 32: North America Physical Vapor Deposition Coatings Industry Volume (Billion), by Country 2024 & 2032
- Figure 33: North America Physical Vapor Deposition Coatings Industry Revenue Share (%), by Country 2024 & 2032
- Figure 34: North America Physical Vapor Deposition Coatings Industry Volume Share (%), by Country 2024 & 2032
- Figure 35: Europe Physical Vapor Deposition Coatings Industry Revenue (Million), by Substrate 2024 & 2032
- Figure 36: Europe Physical Vapor Deposition Coatings Industry Volume (Billion), by Substrate 2024 & 2032
- Figure 37: Europe Physical Vapor Deposition Coatings Industry Revenue Share (%), by Substrate 2024 & 2032
- Figure 38: Europe Physical Vapor Deposition Coatings Industry Volume Share (%), by Substrate 2024 & 2032
- Figure 39: Europe Physical Vapor Deposition Coatings Industry Revenue (Million), by Material Type 2024 & 2032
- Figure 40: Europe Physical Vapor Deposition Coatings Industry Volume (Billion), by Material Type 2024 & 2032
- Figure 41: Europe Physical Vapor Deposition Coatings Industry Revenue Share (%), by Material Type 2024 & 2032
- Figure 42: Europe Physical Vapor Deposition Coatings Industry Volume Share (%), by Material Type 2024 & 2032
- Figure 43: Europe Physical Vapor Deposition Coatings Industry Revenue (Million), by End User 2024 & 2032
- Figure 44: Europe Physical Vapor Deposition Coatings Industry Volume (Billion), by End User 2024 & 2032
- Figure 45: Europe Physical Vapor Deposition Coatings Industry Revenue Share (%), by End User 2024 & 2032
- Figure 46: Europe Physical Vapor Deposition Coatings Industry Volume Share (%), by End User 2024 & 2032
- Figure 47: Europe Physical Vapor Deposition Coatings Industry Revenue (Million), by Country 2024 & 2032
- Figure 48: Europe Physical Vapor Deposition Coatings Industry Volume (Billion), by Country 2024 & 2032
- Figure 49: Europe Physical Vapor Deposition Coatings Industry Revenue Share (%), by Country 2024 & 2032
- Figure 50: Europe Physical Vapor Deposition Coatings Industry Volume Share (%), by Country 2024 & 2032
- Figure 51: South America Physical Vapor Deposition Coatings Industry Revenue (Million), by Substrate 2024 & 2032
- Figure 52: South America Physical Vapor Deposition Coatings Industry Volume (Billion), by Substrate 2024 & 2032
- Figure 53: South America Physical Vapor Deposition Coatings Industry Revenue Share (%), by Substrate 2024 & 2032
- Figure 54: South America Physical Vapor Deposition Coatings Industry Volume Share (%), by Substrate 2024 & 2032
- Figure 55: South America Physical Vapor Deposition Coatings Industry Revenue (Million), by Material Type 2024 & 2032
- Figure 56: South America Physical Vapor Deposition Coatings Industry Volume (Billion), by Material Type 2024 & 2032
- Figure 57: South America Physical Vapor Deposition Coatings Industry Revenue Share (%), by Material Type 2024 & 2032
- Figure 58: South America Physical Vapor Deposition Coatings Industry Volume Share (%), by Material Type 2024 & 2032
- Figure 59: South America Physical Vapor Deposition Coatings Industry Revenue (Million), by End User 2024 & 2032
- Figure 60: South America Physical Vapor Deposition Coatings Industry Volume (Billion), by End User 2024 & 2032
- Figure 61: South America Physical Vapor Deposition Coatings Industry Revenue Share (%), by End User 2024 & 2032
- Figure 62: South America Physical Vapor Deposition Coatings Industry Volume Share (%), by End User 2024 & 2032
- Figure 63: South America Physical Vapor Deposition Coatings Industry Revenue (Million), by Country 2024 & 2032
- Figure 64: South America Physical Vapor Deposition Coatings Industry Volume (Billion), by Country 2024 & 2032
- Figure 65: South America Physical Vapor Deposition Coatings Industry Revenue Share (%), by Country 2024 & 2032
- Figure 66: South America Physical Vapor Deposition Coatings Industry Volume Share (%), by Country 2024 & 2032
- Figure 67: Middle East and Africa Physical Vapor Deposition Coatings Industry Revenue (Million), by Substrate 2024 & 2032
- Figure 68: Middle East and Africa Physical Vapor Deposition Coatings Industry Volume (Billion), by Substrate 2024 & 2032
- Figure 69: Middle East and Africa Physical Vapor Deposition Coatings Industry Revenue Share (%), by Substrate 2024 & 2032
- Figure 70: Middle East and Africa Physical Vapor Deposition Coatings Industry Volume Share (%), by Substrate 2024 & 2032
- Figure 71: Middle East and Africa Physical Vapor Deposition Coatings Industry Revenue (Million), by Material Type 2024 & 2032
- Figure 72: Middle East and Africa Physical Vapor Deposition Coatings Industry Volume (Billion), by Material Type 2024 & 2032
- Figure 73: Middle East and Africa Physical Vapor Deposition Coatings Industry Revenue Share (%), by Material Type 2024 & 2032
- Figure 74: Middle East and Africa Physical Vapor Deposition Coatings Industry Volume Share (%), by Material Type 2024 & 2032
- Figure 75: Middle East and Africa Physical Vapor Deposition Coatings Industry Revenue (Million), by End User 2024 & 2032
- Figure 76: Middle East and Africa Physical Vapor Deposition Coatings Industry Volume (Billion), by End User 2024 & 2032
- Figure 77: Middle East and Africa Physical Vapor Deposition Coatings Industry Revenue Share (%), by End User 2024 & 2032
- Figure 78: Middle East and Africa Physical Vapor Deposition Coatings Industry Volume Share (%), by End User 2024 & 2032
- Figure 79: Middle East and Africa Physical Vapor Deposition Coatings Industry Revenue (Million), by Country 2024 & 2032
- Figure 80: Middle East and Africa Physical Vapor Deposition Coatings Industry Volume (Billion), by Country 2024 & 2032
- Figure 81: Middle East and Africa Physical Vapor Deposition Coatings Industry Revenue Share (%), by Country 2024 & 2032
- Figure 82: Middle East and Africa Physical Vapor Deposition Coatings Industry Volume Share (%), by Country 2024 & 2032
List of Tables
- Table 1: Global Physical Vapor Deposition Coatings Industry Revenue Million Forecast, by Region 2019 & 2032
- Table 2: Global Physical Vapor Deposition Coatings Industry Volume Billion Forecast, by Region 2019 & 2032
- Table 3: Global Physical Vapor Deposition Coatings Industry Revenue Million Forecast, by Substrate 2019 & 2032
- Table 4: Global Physical Vapor Deposition Coatings Industry Volume Billion Forecast, by Substrate 2019 & 2032
- Table 5: Global Physical Vapor Deposition Coatings Industry Revenue Million Forecast, by Material Type 2019 & 2032
- Table 6: Global Physical Vapor Deposition Coatings Industry Volume Billion Forecast, by Material Type 2019 & 2032
- Table 7: Global Physical Vapor Deposition Coatings Industry Revenue Million Forecast, by End User 2019 & 2032
- Table 8: Global Physical Vapor Deposition Coatings Industry Volume Billion Forecast, by End User 2019 & 2032
- Table 9: Global Physical Vapor Deposition Coatings Industry Revenue Million Forecast, by Region 2019 & 2032
- Table 10: Global Physical Vapor Deposition Coatings Industry Volume Billion Forecast, by Region 2019 & 2032
- Table 11: Global Physical Vapor Deposition Coatings Industry Revenue Million Forecast, by Substrate 2019 & 2032
- Table 12: Global Physical Vapor Deposition Coatings Industry Volume Billion Forecast, by Substrate 2019 & 2032
- Table 13: Global Physical Vapor Deposition Coatings Industry Revenue Million Forecast, by Material Type 2019 & 2032
- Table 14: Global Physical Vapor Deposition Coatings Industry Volume Billion Forecast, by Material Type 2019 & 2032
- Table 15: Global Physical Vapor Deposition Coatings Industry Revenue Million Forecast, by End User 2019 & 2032
- Table 16: Global Physical Vapor Deposition Coatings Industry Volume Billion Forecast, by End User 2019 & 2032
- Table 17: Global Physical Vapor Deposition Coatings Industry Revenue Million Forecast, by Country 2019 & 2032
- Table 18: Global Physical Vapor Deposition Coatings Industry Volume Billion Forecast, by Country 2019 & 2032
- Table 19: China Physical Vapor Deposition Coatings Industry Revenue (Million) Forecast, by Application 2019 & 2032
- Table 20: China Physical Vapor Deposition Coatings Industry Volume (Billion) Forecast, by Application 2019 & 2032
- Table 21: India Physical Vapor Deposition Coatings Industry Revenue (Million) Forecast, by Application 2019 & 2032
- Table 22: India Physical Vapor Deposition Coatings Industry Volume (Billion) Forecast, by Application 2019 & 2032
- Table 23: Japan Physical Vapor Deposition Coatings Industry Revenue (Million) Forecast, by Application 2019 & 2032
- Table 24: Japan Physical Vapor Deposition Coatings Industry Volume (Billion) Forecast, by Application 2019 & 2032
- Table 25: South Korea Physical Vapor Deposition Coatings Industry Revenue (Million) Forecast, by Application 2019 & 2032
- Table 26: South Korea Physical Vapor Deposition Coatings Industry Volume (Billion) Forecast, by Application 2019 & 2032
- Table 27: Malaysia Physical Vapor Deposition Coatings Industry Revenue (Million) Forecast, by Application 2019 & 2032
- Table 28: Malaysia Physical Vapor Deposition Coatings Industry Volume (Billion) Forecast, by Application 2019 & 2032
- Table 29: Thailand Physical Vapor Deposition Coatings Industry Revenue (Million) Forecast, by Application 2019 & 2032
- Table 30: Thailand Physical Vapor Deposition Coatings Industry Volume (Billion) Forecast, by Application 2019 & 2032
- Table 31: Indonesia Physical Vapor Deposition Coatings Industry Revenue (Million) Forecast, by Application 2019 & 2032
- Table 32: Indonesia Physical Vapor Deposition Coatings Industry Volume (Billion) Forecast, by Application 2019 & 2032
- Table 33: Vietnam Physical Vapor Deposition Coatings Industry Revenue (Million) Forecast, by Application 2019 & 2032
- Table 34: Vietnam Physical Vapor Deposition Coatings Industry Volume (Billion) Forecast, by Application 2019 & 2032
- Table 35: Rest of Asia Pacific Physical Vapor Deposition Coatings Industry Revenue (Million) Forecast, by Application 2019 & 2032
- Table 36: Rest of Asia Pacific Physical Vapor Deposition Coatings Industry Volume (Billion) Forecast, by Application 2019 & 2032
- Table 37: Global Physical Vapor Deposition Coatings Industry Revenue Million Forecast, by Substrate 2019 & 2032
- Table 38: Global Physical Vapor Deposition Coatings Industry Volume Billion Forecast, by Substrate 2019 & 2032
- Table 39: Global Physical Vapor Deposition Coatings Industry Revenue Million Forecast, by Material Type 2019 & 2032
- Table 40: Global Physical Vapor Deposition Coatings Industry Volume Billion Forecast, by Material Type 2019 & 2032
- Table 41: Global Physical Vapor Deposition Coatings Industry Revenue Million Forecast, by End User 2019 & 2032
- Table 42: Global Physical Vapor Deposition Coatings Industry Volume Billion Forecast, by End User 2019 & 2032
- Table 43: Global Physical Vapor Deposition Coatings Industry Revenue Million Forecast, by Country 2019 & 2032
- Table 44: Global Physical Vapor Deposition Coatings Industry Volume Billion Forecast, by Country 2019 & 2032
- Table 45: United States Physical Vapor Deposition Coatings Industry Revenue (Million) Forecast, by Application 2019 & 2032
- Table 46: United States Physical Vapor Deposition Coatings Industry Volume (Billion) Forecast, by Application 2019 & 2032
- Table 47: Canada Physical Vapor Deposition Coatings Industry Revenue (Million) Forecast, by Application 2019 & 2032
- Table 48: Canada Physical Vapor Deposition Coatings Industry Volume (Billion) Forecast, by Application 2019 & 2032
- Table 49: Mexico Physical Vapor Deposition Coatings Industry Revenue (Million) Forecast, by Application 2019 & 2032
- Table 50: Mexico Physical Vapor Deposition Coatings Industry Volume (Billion) Forecast, by Application 2019 & 2032
- Table 51: Global Physical Vapor Deposition Coatings Industry Revenue Million Forecast, by Substrate 2019 & 2032
- Table 52: Global Physical Vapor Deposition Coatings Industry Volume Billion Forecast, by Substrate 2019 & 2032
- Table 53: Global Physical Vapor Deposition Coatings Industry Revenue Million Forecast, by Material Type 2019 & 2032
- Table 54: Global Physical Vapor Deposition Coatings Industry Volume Billion Forecast, by Material Type 2019 & 2032
- Table 55: Global Physical Vapor Deposition Coatings Industry Revenue Million Forecast, by End User 2019 & 2032
- Table 56: Global Physical Vapor Deposition Coatings Industry Volume Billion Forecast, by End User 2019 & 2032
- Table 57: Global Physical Vapor Deposition Coatings Industry Revenue Million Forecast, by Country 2019 & 2032
- Table 58: Global Physical Vapor Deposition Coatings Industry Volume Billion Forecast, by Country 2019 & 2032
- Table 59: Germany Physical Vapor Deposition Coatings Industry Revenue (Million) Forecast, by Application 2019 & 2032
- Table 60: Germany Physical Vapor Deposition Coatings Industry Volume (Billion) Forecast, by Application 2019 & 2032
- Table 61: United Kingdom Physical Vapor Deposition Coatings Industry Revenue (Million) Forecast, by Application 2019 & 2032
- Table 62: United Kingdom Physical Vapor Deposition Coatings Industry Volume (Billion) Forecast, by Application 2019 & 2032
- Table 63: France Physical Vapor Deposition Coatings Industry Revenue (Million) Forecast, by Application 2019 & 2032
- Table 64: France Physical Vapor Deposition Coatings Industry Volume (Billion) Forecast, by Application 2019 & 2032
- Table 65: Italy Physical Vapor Deposition Coatings Industry Revenue (Million) Forecast, by Application 2019 & 2032
- Table 66: Italy Physical Vapor Deposition Coatings Industry Volume (Billion) Forecast, by Application 2019 & 2032
- Table 67: Spain Physical Vapor Deposition Coatings Industry Revenue (Million) Forecast, by Application 2019 & 2032
- Table 68: Spain Physical Vapor Deposition Coatings Industry Volume (Billion) Forecast, by Application 2019 & 2032
- Table 69: Turkey Physical Vapor Deposition Coatings Industry Revenue (Million) Forecast, by Application 2019 & 2032
- Table 70: Turkey Physical Vapor Deposition Coatings Industry Volume (Billion) Forecast, by Application 2019 & 2032
- Table 71: Russia Physical Vapor Deposition Coatings Industry Revenue (Million) Forecast, by Application 2019 & 2032
- Table 72: Russia Physical Vapor Deposition Coatings Industry Volume (Billion) Forecast, by Application 2019 & 2032
- Table 73: NORDIC Countries Physical Vapor Deposition Coatings Industry Revenue (Million) Forecast, by Application 2019 & 2032
- Table 74: NORDIC Countries Physical Vapor Deposition Coatings Industry Volume (Billion) Forecast, by Application 2019 & 2032
- Table 75: Rest of Europe Physical Vapor Deposition Coatings Industry Revenue (Million) Forecast, by Application 2019 & 2032
- Table 76: Rest of Europe Physical Vapor Deposition Coatings Industry Volume (Billion) Forecast, by Application 2019 & 2032
- Table 77: Global Physical Vapor Deposition Coatings Industry Revenue Million Forecast, by Substrate 2019 & 2032
- Table 78: Global Physical Vapor Deposition Coatings Industry Volume Billion Forecast, by Substrate 2019 & 2032
- Table 79: Global Physical Vapor Deposition Coatings Industry Revenue Million Forecast, by Material Type 2019 & 2032
- Table 80: Global Physical Vapor Deposition Coatings Industry Volume Billion Forecast, by Material Type 2019 & 2032
- Table 81: Global Physical Vapor Deposition Coatings Industry Revenue Million Forecast, by End User 2019 & 2032
- Table 82: Global Physical Vapor Deposition Coatings Industry Volume Billion Forecast, by End User 2019 & 2032
- Table 83: Global Physical Vapor Deposition Coatings Industry Revenue Million Forecast, by Country 2019 & 2032
- Table 84: Global Physical Vapor Deposition Coatings Industry Volume Billion Forecast, by Country 2019 & 2032
- Table 85: Brazil Physical Vapor Deposition Coatings Industry Revenue (Million) Forecast, by Application 2019 & 2032
- Table 86: Brazil Physical Vapor Deposition Coatings Industry Volume (Billion) Forecast, by Application 2019 & 2032
- Table 87: Argentina Physical Vapor Deposition Coatings Industry Revenue (Million) Forecast, by Application 2019 & 2032
- Table 88: Argentina Physical Vapor Deposition Coatings Industry Volume (Billion) Forecast, by Application 2019 & 2032
- Table 89: Colombia Physical Vapor Deposition Coatings Industry Revenue (Million) Forecast, by Application 2019 & 2032
- Table 90: Colombia Physical Vapor Deposition Coatings Industry Volume (Billion) Forecast, by Application 2019 & 2032
- Table 91: Rest of South America Physical Vapor Deposition Coatings Industry Revenue (Million) Forecast, by Application 2019 & 2032
- Table 92: Rest of South America Physical Vapor Deposition Coatings Industry Volume (Billion) Forecast, by Application 2019 & 2032
- Table 93: Global Physical Vapor Deposition Coatings Industry Revenue Million Forecast, by Substrate 2019 & 2032
- Table 94: Global Physical Vapor Deposition Coatings Industry Volume Billion Forecast, by Substrate 2019 & 2032
- Table 95: Global Physical Vapor Deposition Coatings Industry Revenue Million Forecast, by Material Type 2019 & 2032
- Table 96: Global Physical Vapor Deposition Coatings Industry Volume Billion Forecast, by Material Type 2019 & 2032
- Table 97: Global Physical Vapor Deposition Coatings Industry Revenue Million Forecast, by End User 2019 & 2032
- Table 98: Global Physical Vapor Deposition Coatings Industry Volume Billion Forecast, by End User 2019 & 2032
- Table 99: Global Physical Vapor Deposition Coatings Industry Revenue Million Forecast, by Country 2019 & 2032
- Table 100: Global Physical Vapor Deposition Coatings Industry Volume Billion Forecast, by Country 2019 & 2032
- Table 101: Saudi Arabia Physical Vapor Deposition Coatings Industry Revenue (Million) Forecast, by Application 2019 & 2032
- Table 102: Saudi Arabia Physical Vapor Deposition Coatings Industry Volume (Billion) Forecast, by Application 2019 & 2032
- Table 103: Nigeria Physical Vapor Deposition Coatings Industry Revenue (Million) Forecast, by Application 2019 & 2032
- Table 104: Nigeria Physical Vapor Deposition Coatings Industry Volume (Billion) Forecast, by Application 2019 & 2032
- Table 105: Qatar Physical Vapor Deposition Coatings Industry Revenue (Million) Forecast, by Application 2019 & 2032
- Table 106: Qatar Physical Vapor Deposition Coatings Industry Volume (Billion) Forecast, by Application 2019 & 2032
- Table 107: Egypt Physical Vapor Deposition Coatings Industry Revenue (Million) Forecast, by Application 2019 & 2032
- Table 108: Egypt Physical Vapor Deposition Coatings Industry Volume (Billion) Forecast, by Application 2019 & 2032
- Table 109: United Arab Emirates Physical Vapor Deposition Coatings Industry Revenue (Million) Forecast, by Application 2019 & 2032
- Table 110: United Arab Emirates Physical Vapor Deposition Coatings Industry Volume (Billion) Forecast, by Application 2019 & 2032
- Table 111: South Africa Physical Vapor Deposition Coatings Industry Revenue (Million) Forecast, by Application 2019 & 2032
- Table 112: South Africa Physical Vapor Deposition Coatings Industry Volume (Billion) Forecast, by Application 2019 & 2032
- Table 113: Rest of Middle East and Africa Physical Vapor Deposition Coatings Industry Revenue (Million) Forecast, by Application 2019 & 2032
- Table 114: Rest of Middle East and Africa Physical Vapor Deposition Coatings Industry Volume (Billion) Forecast, by Application 2019 & 2032
Frequently Asked Questions
1. What is the projected Compound Annual Growth Rate (CAGR) of the Physical Vapor Deposition Coatings Industry?
The projected CAGR is approximately 6.43%.
2. Which companies are prominent players in the Physical Vapor Deposition Coatings Industry?
Key companies in the market include Crystallume PVD, HEF, IHI Corporation, Impact Coatings AB, Inoxcolorz Private Limited, KOLZER SRL, Mitsubishi Materials Corporation, OC Oerlikon Management AG, Red Spot Paint & Varnish Company Inc, Richter Precision Inc, Sputtek Advanced Metallurgical Coatings, Surface Modification Technologies, TOCALO Co Ltd, voestalpine eifeler Group*List Not Exhaustive.
3. What are the main segments of the Physical Vapor Deposition Coatings Industry?
The market segments include Substrate, Material Type, End User.
4. Can you provide details about the market size?
The market size is estimated to be USD 10.46 Million as of 2022.
5. What are some drivers contributing to market growth?
Demand from the Electronics Sector; Increasing Usage in Medical Industry; Other Drivers.
6. What are the notable trends driving market growth?
The Automotive Industry is Expected to Dominate the Market Studied.
7. Are there any restraints impacting market growth?
Demand from the Electronics Sector; Increasing Usage in Medical Industry; Other Drivers.
8. Can you provide examples of recent developments in the market?
April 2022: Impact Coatings announced the establishment of a Chinese subsidiary with headquarters in Shanghai. The opening is expected to disseminate Impact Coatings' market-leading expertise in PVD coatings for hydrogen solutions and increase the availability of coating services solutions to Chinese customers in the hydrogen value chain.January 2022: IHI Ionbond announced its significant investment in decorative coating capacity by purchasing a Hauzer Flexicoat 1500 PVD system. This large-scale coating system has an impressive coating zone of 0.9 m diameter by 1.5 m height. It is a welcome addition to the growing capabilities of the Ionbond component coating facility at Consett County Durham.
9. What pricing options are available for accessing the report?
Pricing options include single-user, multi-user, and enterprise licenses priced at USD 4750, USD 5250, and USD 8750 respectively.
10. Is the market size provided in terms of value or volume?
The market size is provided in terms of value, measured in Million and volume, measured in Billion.
11. Are there any specific market keywords associated with the report?
Yes, the market keyword associated with the report is "Physical Vapor Deposition Coatings Industry," which aids in identifying and referencing the specific market segment covered.
12. How do I determine which pricing option suits my needs best?
The pricing options vary based on user requirements and access needs. Individual users may opt for single-user licenses, while businesses requiring broader access may choose multi-user or enterprise licenses for cost-effective access to the report.
13. Are there any additional resources or data provided in the Physical Vapor Deposition Coatings Industry report?
While the report offers comprehensive insights, it's advisable to review the specific contents or supplementary materials provided to ascertain if additional resources or data are available.
14. How can I stay updated on further developments or reports in the Physical Vapor Deposition Coatings Industry?
To stay informed about further developments, trends, and reports in the Physical Vapor Deposition Coatings Industry, consider subscribing to industry newsletters, following relevant companies and organizations, or regularly checking reputable industry news sources and publications.
Methodology
Step 1 - Identification of Relevant Samples Size from Population Database


Step 2 - Approaches for Defining Global Market Size (Value, Volume* & Price*)

Note*: In applicable scenarios
Step 3 - Data Sources
Primary Research
- Web Analytics
- Survey Reports
- Research Institute
- Latest Research Reports
- Opinion Leaders
Secondary Research
- Annual Reports
- White Paper
- Latest Press Release
- Industry Association
- Paid Database
- Investor Presentations

Step 4 - Data Triangulation
Involves using different sources of information in order to increase the validity of a study
These sources are likely to be stakeholders in a program - participants, other researchers, program staff, other community members, and so on.
Then we put all data in single framework & apply various statistical tools to find out the dynamic on the market.
During the analysis stage, feedback from the stakeholder groups would be compared to determine areas of agreement as well as areas of divergence
