

Key Insights
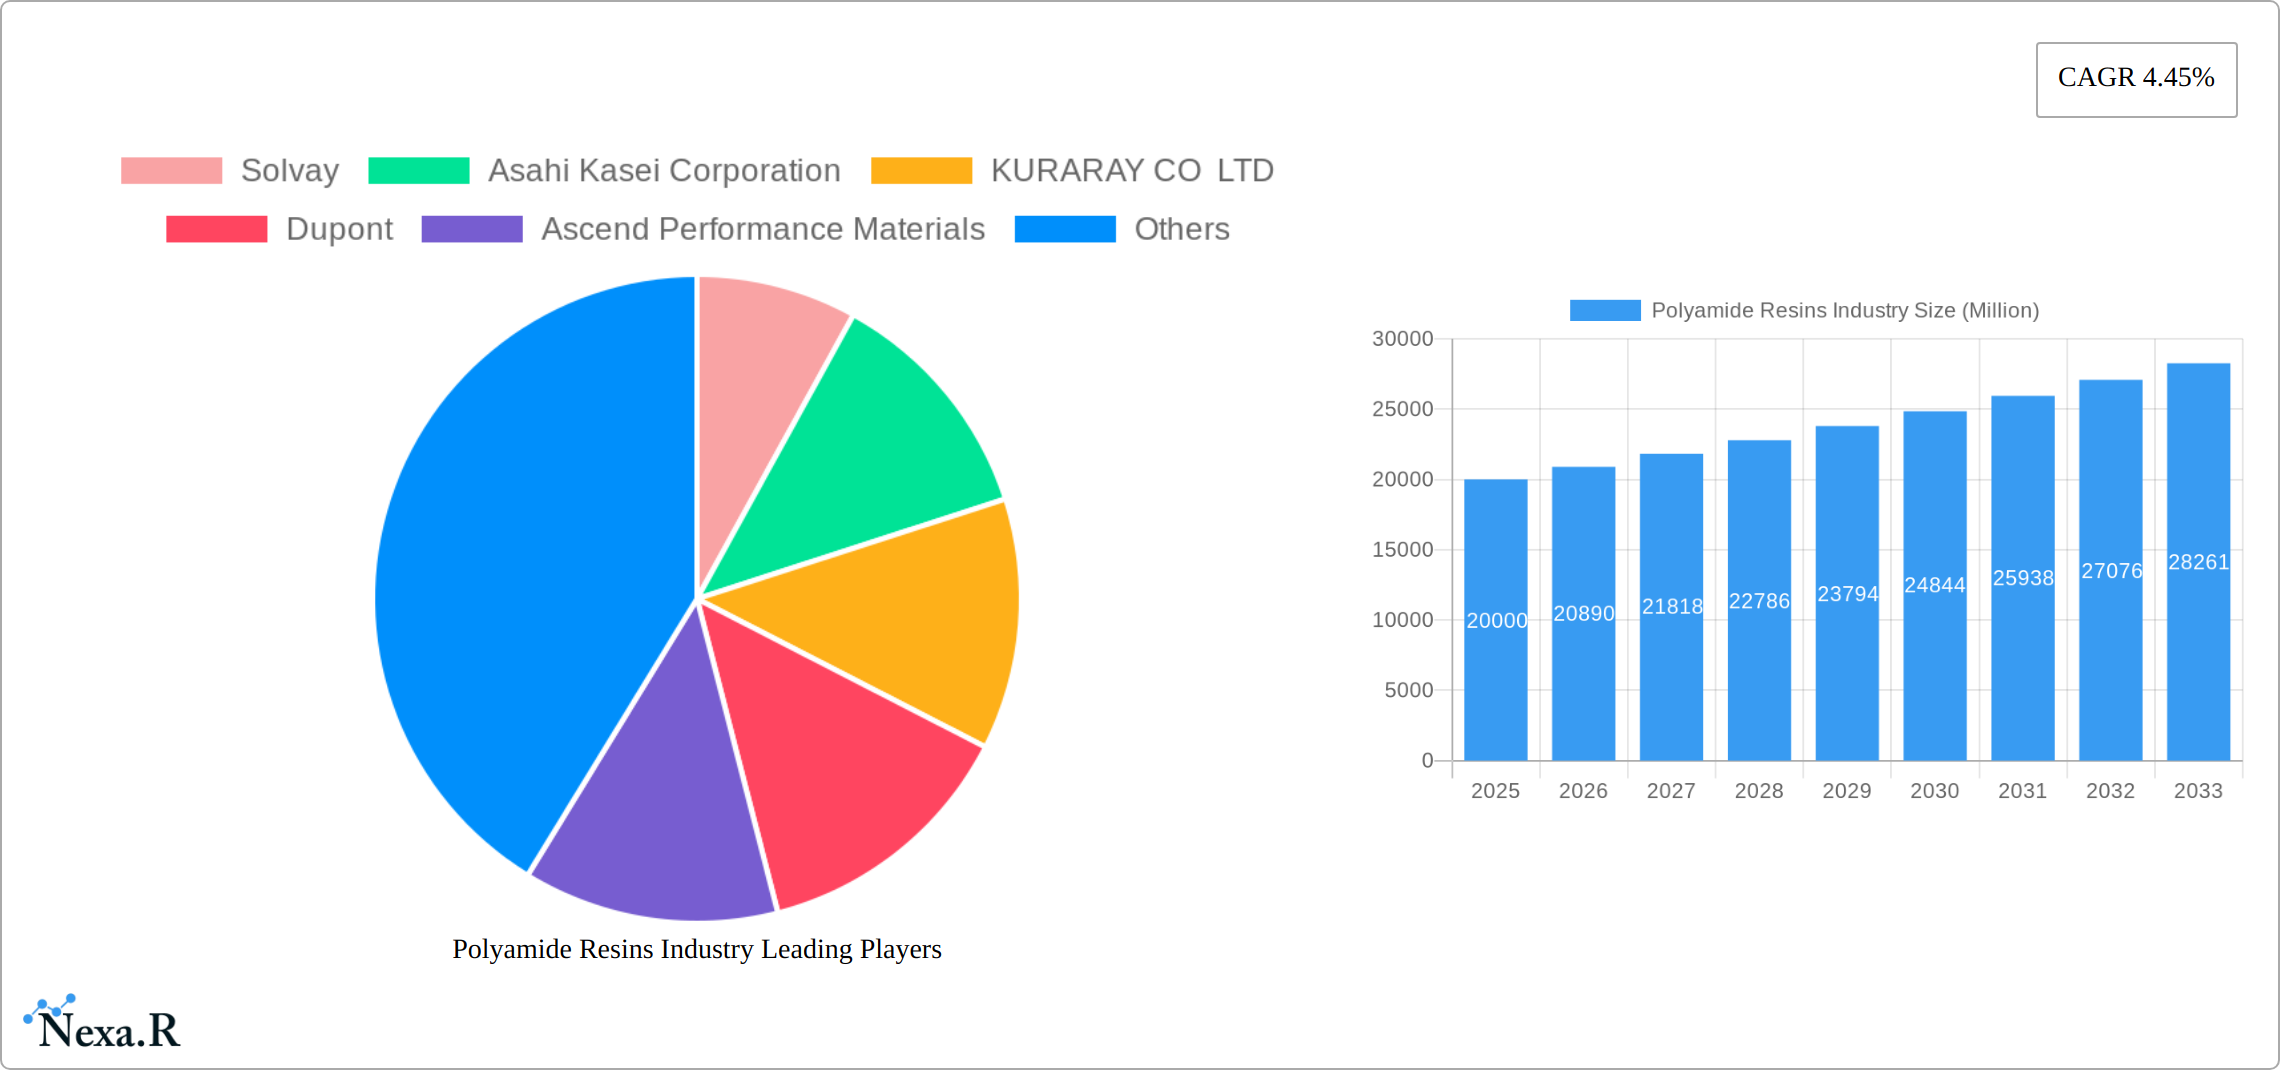
The global polyamide resins market, valued at approximately $XX million in 2025, is projected to experience robust growth, driven by a compound annual growth rate (CAGR) of 4.45% from 2025 to 2033. This expansion is fueled by several key factors. The automotive industry's increasing demand for lightweight yet high-strength materials in vehicle components is a significant driver. Similarly, the aerospace and defense sectors utilize polyamide resins for their durability and resistance to extreme temperatures and chemicals. The burgeoning electrical and electronics industry further contributes to market growth, with polyamide resins finding applications in various components due to their excellent insulation properties. Furthermore, advancements in bio-based nylon production are creating sustainable alternatives, appealing to environmentally conscious manufacturers and consumers. Growth is also propelled by continuous innovation in product types, leading to enhanced performance characteristics tailored to diverse applications, such as moisture-resistant and colorable options. However, fluctuating raw material prices and the emergence of competing materials pose challenges to market growth.
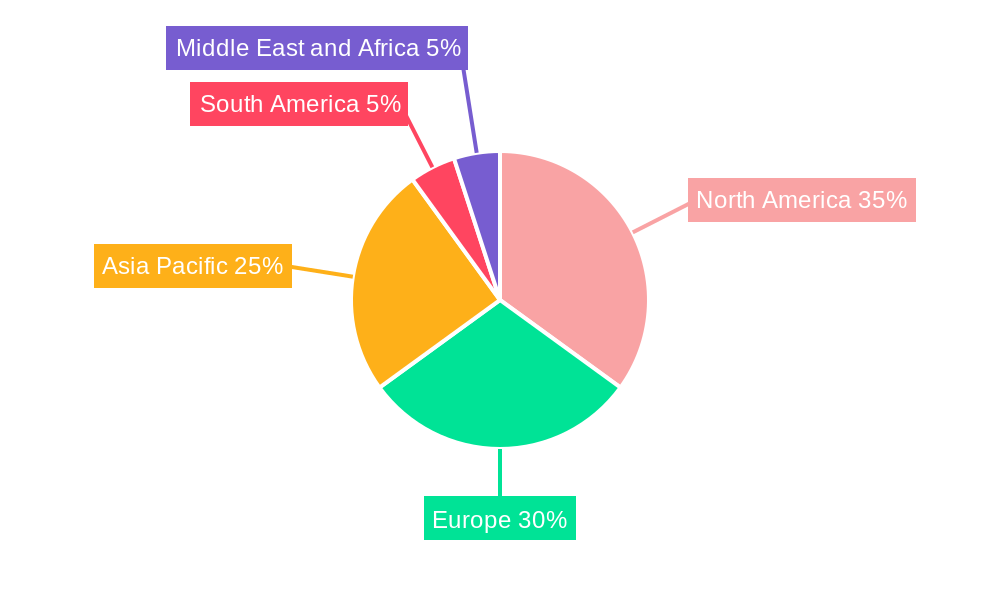
Despite these challenges, market segmentation offers promising opportunities. The Nylon 6 segment is expected to maintain a leading position due to its cost-effectiveness and versatility. However, the bio-based nylon segment is poised for significant growth, driven by the increasing demand for sustainable materials. Geographically, North America and Europe are currently leading the market, but the Asia-Pacific region is anticipated to witness substantial growth driven by rapid industrialization and increasing demand from various end-use sectors. This projection considers factors like the ongoing expansion of the automotive and electronics sectors in developing economies within the region. Companies such as Solvay, Asahi Kasei Corporation, and DuPont are key players shaping the market landscape through innovation and strategic expansions.
Polyamide Resins Industry Market Report: 2019-2033
This comprehensive report provides a detailed analysis of the Polyamide Resins industry, offering invaluable insights for industry professionals, investors, and strategic decision-makers. Covering the period from 2019 to 2033, with a focus on the 2025-2033 forecast, this report dissects market dynamics, growth trends, key players, and emerging opportunities across various segments and geographic regions. The report utilizes a robust methodology incorporating both quantitative and qualitative data, providing a holistic view of this dynamic market valued at xx Million in 2025 and projected to reach xx Million by 2033.
Polyamide Resins Industry Market Dynamics & Structure
The polyamide resins market presents a moderately concentrated competitive landscape, with key players such as Solvay, Asahi Kasei Corporation, and BASF SE commanding substantial market share. Growth is significantly propelled by technological innovation, particularly in the development of bio-based nylons and the enhancement of material performance characteristics to meet evolving industry demands. The industry's trajectory is heavily influenced by stringent regulatory frameworks emphasizing sustainability and material safety, necessitating innovative manufacturing processes and environmentally conscious product development. The market faces competitive pressure from substitute engineering plastics, demanding continuous product differentiation and innovation to maintain a competitive edge. End-user demographics are dynamically shifting towards sectors prioritizing lightweighting and high-performance materials, creating new opportunities for specialized polyamide applications. The period from 2019 to 2024 witnessed notable mergers and acquisitions (M&A) activity, including BASF SE's acquisition of Solvay's PA66 business, significantly altering the competitive dynamics and market consolidation. The market is projected to experience robust growth, with a projected Compound Annual Growth Rate (CAGR) of xx% from 2025 to 2033.
- Market Concentration: Moderately concentrated, with leading players holding an estimated xx% market share in 2025. This concentration is expected to evolve with further consolidation and strategic partnerships.
- Technological Innovation: A key driver of growth, focusing on bio-based nylon alternatives, improved thermal and chemical resistance, and the development of high-performance grades tailored to specific applications (e.g., high-temperature resistance, enhanced wear resistance).
- Regulatory Framework: Increasingly stringent regulations emphasizing sustainability and circular economy principles are shaping manufacturing processes, product design, and the adoption of eco-friendly materials and technologies.
- Competitive Substitutes: The presence of alternative materials like polyester and other engineering plastics necessitates continuous innovation in material properties, performance, and cost-effectiveness to maintain market share.
- M&A Activity: The period from 2019 to 2024 witnessed xx significant mergers and acquisitions, valued at approximately xx million dollars, indicating a trend towards industry consolidation and strategic expansion.
- Innovation Barriers: High research and development (R&D) costs, complex material science challenges, and the need for long-term investments in sustainable technologies present significant barriers to rapid innovation.
Polyamide Resins Industry Growth Trends & Insights
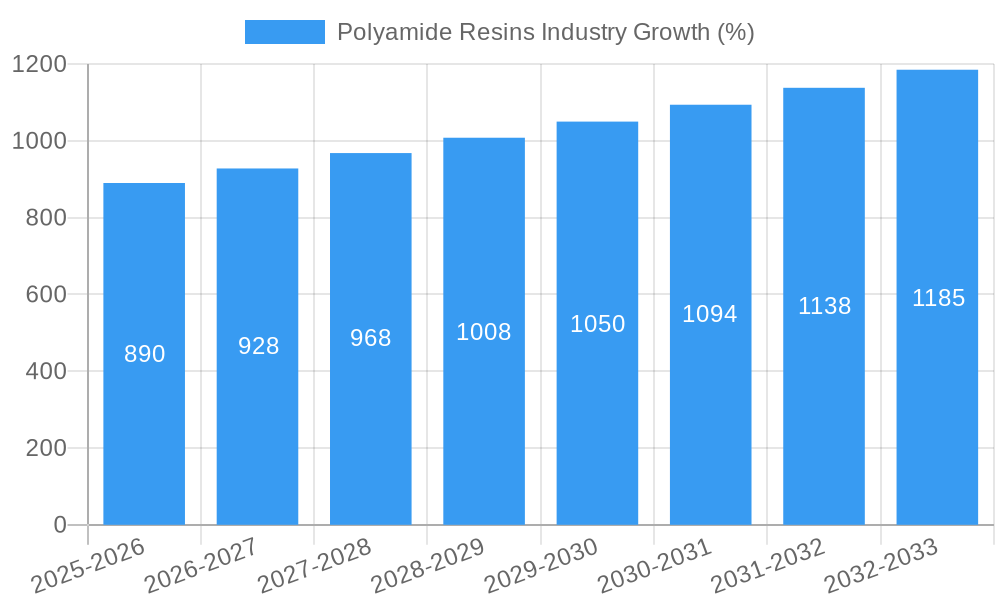
The global polyamide resins market is experiencing robust growth, driven by increasing demand from diverse end-use industries. The automotive, aerospace and defense, and electrical and electronics sectors are major contributors to market expansion. The adoption rate of high-performance polyamides is accelerating, particularly in applications requiring enhanced durability, lightweighting, and chemical resistance. Technological disruptions, such as the development of bio-based nylon and advanced recycling processes, are reshaping the industry. Consumer behavior shifts towards sustainable and environmentally friendly materials are creating new market opportunities. The market is expected to witness a CAGR of xx% from 2025 to 2033. Specific segments, like Nylon 6 and specialty polyamide alloys, show even higher growth rates. Increased adoption in electric vehicle components and the growth of the 3D printing industry are further contributing factors.
Dominant Regions, Countries, or Segments in Polyamide Resins Industry
The Asia Pacific region commands a dominant position in the polyamide resins market, driven by rapid industrialization, particularly in the automotive and electronics sectors. Within this region, China and India are major contributors to market growth. The automotive industry serves as a significant end-user segment, followed by the electronics and textile industries. High-performance polyamides, characterized by temperature and chemical resistance, are experiencing rapid growth, fueled by the demand for durable and specialized materials in various applications. Nylon 6 currently maintains the largest market share among product types, while bio-based nylon alternatives are witnessing rapid expansion, driven by increasing environmental concerns and regulatory pressures.
- Dominant Region: Asia Pacific (xx% market share projected for 2025), reflecting the region's strong industrial growth and expanding manufacturing base.
- Key Countries: China and India represent significant growth markets, along with established players in the United States and Germany.
- Dominant End-User Industry: The automotive industry is a leading consumer of polyamide resins (xx% of total demand in 2025), driven by the need for lightweight and high-performance components.
- High-Growth Segments: Temperature-resistant, chemical-resistant polyamides, and bio-based nylon alternatives are experiencing particularly strong growth due to specialized applications and environmental considerations.
- Drivers: Rapid industrialization, particularly in the Asia-Pacific region, coupled with the increasing demand for lightweight, high-performance materials across diverse end-use industries.
Polyamide Resins Industry Product Landscape
The polyamide resins market offers a wide range of products, including Nylon 6, Nylon 66, bio-based nylon, and various nylon alloys. These materials exhibit diverse properties, tailored to specific applications. Recent innovations focus on enhancing mechanical strength, thermal stability, and chemical resistance. Key features driving adoption include improved processability, reduced environmental impact (bio-based options), and superior performance characteristics compared to traditional materials. The market is seeing a rise in customizable solutions and specialized grades catering to niche requirements.
Key Drivers, Barriers & Challenges in Polyamide Resins Industry
Key Drivers:
- Rising demand from automotive and electronics sectors.
- Growing adoption of high-performance polymers.
- Development of sustainable and bio-based alternatives.
Challenges:
- Fluctuations in raw material prices (e.g., crude oil) impacting profitability.
- Stringent environmental regulations leading to increased production costs.
- Intense competition from other engineering plastics. This competition impacts market share and pricing strategies. The pressure to innovate and offer competitive pricing poses a significant challenge.
Emerging Opportunities in Polyamide Resins Industry
- Expansion into Emerging Markets: Significant growth opportunities exist in emerging economies with developing industrial sectors and increasing infrastructure investments.
- Specialized Polyamide Grades: Developing specialized polyamide grades for niche applications such as medical devices, 3D printing filaments, and high-performance components in aerospace and other demanding industries presents considerable growth potential.
- Chemical Recycling Technologies: The growing adoption of chemical recycling technologies offers a pathway towards enhancing the sustainability of polyamide production and reducing the environmental impact of manufacturing processes.
- Sustainable Solutions: The development and adoption of bio-based and recycled polyamides are becoming increasingly crucial to meet growing environmental regulations and consumer demand for sustainable materials.
Growth Accelerators in the Polyamide Resins Industry
Strategic partnerships and collaborations between material suppliers and end-users are fostering innovation and market penetration. Investments in research and development are leading to the development of novel polyamide grades with enhanced properties and functionalities. The growing adoption of sustainable manufacturing practices and the expansion into high-growth markets will further accelerate market expansion.
Key Players Shaping the Polyamide Resins Industry Market
- Solvay
- Asahi Kasei Corporation
- KURARAY CO LTD
- Dupont
- Ascend Performance Materials
- INVISTA
- BASF SE
- DSM
- Aquafil S p A
- NILIT
Notable Milestones in Polyamide Resins Industry Sector
- April 2023: Asahi Kasei Corporation and Microwave Chemical launch a joint demonstration project for chemical recycling of polyamide 66 using microwave technology.
- February 2022: BASF SE launches new polyamide and polyphthalamide grades in Europe, acquired from Solvay.
In-Depth Polyamide Resins Industry Market Outlook
The polyamide resins market is poised for sustained growth, driven by a confluence of factors including continuous technological advancements, the increasing focus on sustainability initiatives, and the expanding demand from diverse end-use industries. Strategic partnerships, expansion into high-growth markets, and the development of innovative product offerings are crucial factors influencing the future trajectory of market dynamics. The emphasis on circular economy principles and the development of advanced recycling technologies will play a vital role in fostering sustainable market expansion and reducing the industry's overall environmental footprint. Companies that successfully innovate, adapt to evolving market demands, and adopt robust sustainable practices are well-positioned to capture significant opportunities within this dynamic and expanding market.
Polyamide Resins Industry Segmentation
-
1. Product Type
- 1.1. Nylon 6
- 1.2. Nylon 6,6
- 1.3. Bio-based Nylon
- 1.4. Other Product Types
-
2. Application
- 2.1. Moisture Absorbent
- 2.2. Chemical Resistant
- 2.3. Temperature Resistant
- 2.4. Aesthetic
- 2.5. Colorable
- 2.6. Nylon Alloys
-
3. End-User Industry
- 3.1. Automotive
- 3.2. Aerospace and Defense
- 3.3. Electrical and Electronics
- 3.4. Packaging and Storage
- 3.5. Extrusion
- 3.6. Textile
Polyamide Resins Industry Segmentation By Geography
-
1. Asia Pacific
- 1.1. China
- 1.2. India
- 1.3. Japan
- 1.4. South Korea
- 1.5. ASEAN Countries
- 1.6. Rest of Asia Pacific
-
2. North America
- 2.1. United States
- 2.2. Canada
- 2.3. Mexico
-
3. Europe
- 3.1. Germany
- 3.2. United Kingdom
- 3.3. Italy
- 3.4. France
- 3.5. Rest of Europe
-
4. South America
- 4.1. Brazil
- 4.2. Argentina
- 4.3. Rest of South America
-
5. Middle East and Africa
- 5.1. Saudi Arabia
- 5.2. South Africa
- 5.3. Rest of Middle East and Africa
Polyamide Resins Industry REPORT HIGHLIGHTS
| Aspects | Details |
|---|---|
| Study Period | 2019-2033 |
| Base Year | 2024 |
| Estimated Year | 2025 |
| Forecast Period | 2025-2033 |
| Historical Period | 2019-2024 |
| Growth Rate | CAGR of 4.45% from 2019-2033 |
| Segmentation |
|
Table of Contents
- 1. Introduction
- 1.1. Research Scope
- 1.2. Market Segmentation
- 1.3. Research Methodology
- 1.4. Definitions and Assumptions
- 2. Executive Summary
- 2.1. Introduction
- 3. Market Dynamics
- 3.1. Introduction
- 3.2. Market Drivers
- 3.2.1. Increasing Demand from the Automobile Industry due to its High Utilization in making Molded Parts; Rising Demand from the Packaging Sector; Other Drivers
- 3.3. Market Restrains
- 3.3.1. Strict Government Regulations for Reducing Negative Environmental Impacts; Other Restraints
- 3.4. Market Trends
- 3.4.1. Increasing Demand from Automotive Industry
- 4. Market Factor Analysis
- 4.1. Porters Five Forces
- 4.2. Supply/Value Chain
- 4.3. PESTEL analysis
- 4.4. Market Entropy
- 4.5. Patent/Trademark Analysis
- 5. Global Polyamide Resins Industry Analysis, Insights and Forecast, 2019-2031
- 5.1. Market Analysis, Insights and Forecast - by Product Type
- 5.1.1. Nylon 6
- 5.1.2. Nylon 6,6
- 5.1.3. Bio-based Nylon
- 5.1.4. Other Product Types
- 5.2. Market Analysis, Insights and Forecast - by Application
- 5.2.1. Moisture Absorbent
- 5.2.2. Chemical Resistant
- 5.2.3. Temperature Resistant
- 5.2.4. Aesthetic
- 5.2.5. Colorable
- 5.2.6. Nylon Alloys
- 5.3. Market Analysis, Insights and Forecast - by End-User Industry
- 5.3.1. Automotive
- 5.3.2. Aerospace and Defense
- 5.3.3. Electrical and Electronics
- 5.3.4. Packaging and Storage
- 5.3.5. Extrusion
- 5.3.6. Textile
- 5.4. Market Analysis, Insights and Forecast - by Region
- 5.4.1. Asia Pacific
- 5.4.2. North America
- 5.4.3. Europe
- 5.4.4. South America
- 5.4.5. Middle East and Africa
- 5.1. Market Analysis, Insights and Forecast - by Product Type
- 6. Asia Pacific Polyamide Resins Industry Analysis, Insights and Forecast, 2019-2031
- 6.1. Market Analysis, Insights and Forecast - by Product Type
- 6.1.1. Nylon 6
- 6.1.2. Nylon 6,6
- 6.1.3. Bio-based Nylon
- 6.1.4. Other Product Types
- 6.2. Market Analysis, Insights and Forecast - by Application
- 6.2.1. Moisture Absorbent
- 6.2.2. Chemical Resistant
- 6.2.3. Temperature Resistant
- 6.2.4. Aesthetic
- 6.2.5. Colorable
- 6.2.6. Nylon Alloys
- 6.3. Market Analysis, Insights and Forecast - by End-User Industry
- 6.3.1. Automotive
- 6.3.2. Aerospace and Defense
- 6.3.3. Electrical and Electronics
- 6.3.4. Packaging and Storage
- 6.3.5. Extrusion
- 6.3.6. Textile
- 6.1. Market Analysis, Insights and Forecast - by Product Type
- 7. North America Polyamide Resins Industry Analysis, Insights and Forecast, 2019-2031
- 7.1. Market Analysis, Insights and Forecast - by Product Type
- 7.1.1. Nylon 6
- 7.1.2. Nylon 6,6
- 7.1.3. Bio-based Nylon
- 7.1.4. Other Product Types
- 7.2. Market Analysis, Insights and Forecast - by Application
- 7.2.1. Moisture Absorbent
- 7.2.2. Chemical Resistant
- 7.2.3. Temperature Resistant
- 7.2.4. Aesthetic
- 7.2.5. Colorable
- 7.2.6. Nylon Alloys
- 7.3. Market Analysis, Insights and Forecast - by End-User Industry
- 7.3.1. Automotive
- 7.3.2. Aerospace and Defense
- 7.3.3. Electrical and Electronics
- 7.3.4. Packaging and Storage
- 7.3.5. Extrusion
- 7.3.6. Textile
- 7.1. Market Analysis, Insights and Forecast - by Product Type
- 8. Europe Polyamide Resins Industry Analysis, Insights and Forecast, 2019-2031
- 8.1. Market Analysis, Insights and Forecast - by Product Type
- 8.1.1. Nylon 6
- 8.1.2. Nylon 6,6
- 8.1.3. Bio-based Nylon
- 8.1.4. Other Product Types
- 8.2. Market Analysis, Insights and Forecast - by Application
- 8.2.1. Moisture Absorbent
- 8.2.2. Chemical Resistant
- 8.2.3. Temperature Resistant
- 8.2.4. Aesthetic
- 8.2.5. Colorable
- 8.2.6. Nylon Alloys
- 8.3. Market Analysis, Insights and Forecast - by End-User Industry
- 8.3.1. Automotive
- 8.3.2. Aerospace and Defense
- 8.3.3. Electrical and Electronics
- 8.3.4. Packaging and Storage
- 8.3.5. Extrusion
- 8.3.6. Textile
- 8.1. Market Analysis, Insights and Forecast - by Product Type
- 9. South America Polyamide Resins Industry Analysis, Insights and Forecast, 2019-2031
- 9.1. Market Analysis, Insights and Forecast - by Product Type
- 9.1.1. Nylon 6
- 9.1.2. Nylon 6,6
- 9.1.3. Bio-based Nylon
- 9.1.4. Other Product Types
- 9.2. Market Analysis, Insights and Forecast - by Application
- 9.2.1. Moisture Absorbent
- 9.2.2. Chemical Resistant
- 9.2.3. Temperature Resistant
- 9.2.4. Aesthetic
- 9.2.5. Colorable
- 9.2.6. Nylon Alloys
- 9.3. Market Analysis, Insights and Forecast - by End-User Industry
- 9.3.1. Automotive
- 9.3.2. Aerospace and Defense
- 9.3.3. Electrical and Electronics
- 9.3.4. Packaging and Storage
- 9.3.5. Extrusion
- 9.3.6. Textile
- 9.1. Market Analysis, Insights and Forecast - by Product Type
- 10. Middle East and Africa Polyamide Resins Industry Analysis, Insights and Forecast, 2019-2031
- 10.1. Market Analysis, Insights and Forecast - by Product Type
- 10.1.1. Nylon 6
- 10.1.2. Nylon 6,6
- 10.1.3. Bio-based Nylon
- 10.1.4. Other Product Types
- 10.2. Market Analysis, Insights and Forecast - by Application
- 10.2.1. Moisture Absorbent
- 10.2.2. Chemical Resistant
- 10.2.3. Temperature Resistant
- 10.2.4. Aesthetic
- 10.2.5. Colorable
- 10.2.6. Nylon Alloys
- 10.3. Market Analysis, Insights and Forecast - by End-User Industry
- 10.3.1. Automotive
- 10.3.2. Aerospace and Defense
- 10.3.3. Electrical and Electronics
- 10.3.4. Packaging and Storage
- 10.3.5. Extrusion
- 10.3.6. Textile
- 10.1. Market Analysis, Insights and Forecast - by Product Type
- 11. North America Polyamide Resins Industry Analysis, Insights and Forecast, 2019-2031
- 11.1. Market Analysis, Insights and Forecast - By Country/Sub-region
- 11.1.1 United States
- 11.1.2 Canada
- 11.1.3 Mexico
- 12. Europe Polyamide Resins Industry Analysis, Insights and Forecast, 2019-2031
- 12.1. Market Analysis, Insights and Forecast - By Country/Sub-region
- 12.1.1 Germany
- 12.1.2 France
- 12.1.3 Italy
- 12.1.4 United Kingdom
- 12.1.5 Netherlands
- 12.1.6 Rest of Europe
- 13. Asia Pacific Polyamide Resins Industry Analysis, Insights and Forecast, 2019-2031
- 13.1. Market Analysis, Insights and Forecast - By Country/Sub-region
- 13.1.1 China
- 13.1.2 Japan
- 13.1.3 India
- 13.1.4 South Korea
- 13.1.5 Taiwan
- 13.1.6 Australia
- 13.1.7 Rest of Asia-Pacific
- 14. South America Polyamide Resins Industry Analysis, Insights and Forecast, 2019-2031
- 14.1. Market Analysis, Insights and Forecast - By Country/Sub-region
- 14.1.1 Brazil
- 14.1.2 Argentina
- 14.1.3 Rest of South America
- 15. Middle East and Africa Polyamide Resins Industry Analysis, Insights and Forecast, 2019-2031
- 15.1. Market Analysis, Insights and Forecast - By Country/Sub-region
- 15.1.1 Middle East
- 15.1.2 Africa
- 16. Competitive Analysis
- 16.1. Global Market Share Analysis 2024
- 16.2. Company Profiles
- 16.2.1 Solvay
- 16.2.1.1. Overview
- 16.2.1.2. Products
- 16.2.1.3. SWOT Analysis
- 16.2.1.4. Recent Developments
- 16.2.1.5. Financials (Based on Availability)
- 16.2.2 Asahi Kasei Corporation
- 16.2.2.1. Overview
- 16.2.2.2. Products
- 16.2.2.3. SWOT Analysis
- 16.2.2.4. Recent Developments
- 16.2.2.5. Financials (Based on Availability)
- 16.2.3 KURARAY CO LTD
- 16.2.3.1. Overview
- 16.2.3.2. Products
- 16.2.3.3. SWOT Analysis
- 16.2.3.4. Recent Developments
- 16.2.3.5. Financials (Based on Availability)
- 16.2.4 Dupont
- 16.2.4.1. Overview
- 16.2.4.2. Products
- 16.2.4.3. SWOT Analysis
- 16.2.4.4. Recent Developments
- 16.2.4.5. Financials (Based on Availability)
- 16.2.5 Ascend Performance Materials
- 16.2.5.1. Overview
- 16.2.5.2. Products
- 16.2.5.3. SWOT Analysis
- 16.2.5.4. Recent Developments
- 16.2.5.5. Financials (Based on Availability)
- 16.2.6 INVISTA
- 16.2.6.1. Overview
- 16.2.6.2. Products
- 16.2.6.3. SWOT Analysis
- 16.2.6.4. Recent Developments
- 16.2.6.5. Financials (Based on Availability)
- 16.2.7 BASF SE
- 16.2.7.1. Overview
- 16.2.7.2. Products
- 16.2.7.3. SWOT Analysis
- 16.2.7.4. Recent Developments
- 16.2.7.5. Financials (Based on Availability)
- 16.2.8 DSM
- 16.2.8.1. Overview
- 16.2.8.2. Products
- 16.2.8.3. SWOT Analysis
- 16.2.8.4. Recent Developments
- 16.2.8.5. Financials (Based on Availability)
- 16.2.9 Aquafil S p A
- 16.2.9.1. Overview
- 16.2.9.2. Products
- 16.2.9.3. SWOT Analysis
- 16.2.9.4. Recent Developments
- 16.2.9.5. Financials (Based on Availability)
- 16.2.10 NILIT
- 16.2.10.1. Overview
- 16.2.10.2. Products
- 16.2.10.3. SWOT Analysis
- 16.2.10.4. Recent Developments
- 16.2.10.5. Financials (Based on Availability)
- 16.2.1 Solvay
List of Figures
- Figure 1: Global Polyamide Resins Industry Revenue Breakdown (Million, %) by Region 2024 & 2032
- Figure 2: Global Polyamide Resins Industry Volume Breakdown (K Tons, %) by Region 2024 & 2032
- Figure 3: North America Polyamide Resins Industry Revenue (Million), by Country 2024 & 2032
- Figure 4: North America Polyamide Resins Industry Volume (K Tons), by Country 2024 & 2032
- Figure 5: North America Polyamide Resins Industry Revenue Share (%), by Country 2024 & 2032
- Figure 6: North America Polyamide Resins Industry Volume Share (%), by Country 2024 & 2032
- Figure 7: Europe Polyamide Resins Industry Revenue (Million), by Country 2024 & 2032
- Figure 8: Europe Polyamide Resins Industry Volume (K Tons), by Country 2024 & 2032
- Figure 9: Europe Polyamide Resins Industry Revenue Share (%), by Country 2024 & 2032
- Figure 10: Europe Polyamide Resins Industry Volume Share (%), by Country 2024 & 2032
- Figure 11: Asia Pacific Polyamide Resins Industry Revenue (Million), by Country 2024 & 2032
- Figure 12: Asia Pacific Polyamide Resins Industry Volume (K Tons), by Country 2024 & 2032
- Figure 13: Asia Pacific Polyamide Resins Industry Revenue Share (%), by Country 2024 & 2032
- Figure 14: Asia Pacific Polyamide Resins Industry Volume Share (%), by Country 2024 & 2032
- Figure 15: South America Polyamide Resins Industry Revenue (Million), by Country 2024 & 2032
- Figure 16: South America Polyamide Resins Industry Volume (K Tons), by Country 2024 & 2032
- Figure 17: South America Polyamide Resins Industry Revenue Share (%), by Country 2024 & 2032
- Figure 18: South America Polyamide Resins Industry Volume Share (%), by Country 2024 & 2032
- Figure 19: Middle East and Africa Polyamide Resins Industry Revenue (Million), by Country 2024 & 2032
- Figure 20: Middle East and Africa Polyamide Resins Industry Volume (K Tons), by Country 2024 & 2032
- Figure 21: Middle East and Africa Polyamide Resins Industry Revenue Share (%), by Country 2024 & 2032
- Figure 22: Middle East and Africa Polyamide Resins Industry Volume Share (%), by Country 2024 & 2032
- Figure 23: Asia Pacific Polyamide Resins Industry Revenue (Million), by Product Type 2024 & 2032
- Figure 24: Asia Pacific Polyamide Resins Industry Volume (K Tons), by Product Type 2024 & 2032
- Figure 25: Asia Pacific Polyamide Resins Industry Revenue Share (%), by Product Type 2024 & 2032
- Figure 26: Asia Pacific Polyamide Resins Industry Volume Share (%), by Product Type 2024 & 2032
- Figure 27: Asia Pacific Polyamide Resins Industry Revenue (Million), by Application 2024 & 2032
- Figure 28: Asia Pacific Polyamide Resins Industry Volume (K Tons), by Application 2024 & 2032
- Figure 29: Asia Pacific Polyamide Resins Industry Revenue Share (%), by Application 2024 & 2032
- Figure 30: Asia Pacific Polyamide Resins Industry Volume Share (%), by Application 2024 & 2032
- Figure 31: Asia Pacific Polyamide Resins Industry Revenue (Million), by End-User Industry 2024 & 2032
- Figure 32: Asia Pacific Polyamide Resins Industry Volume (K Tons), by End-User Industry 2024 & 2032
- Figure 33: Asia Pacific Polyamide Resins Industry Revenue Share (%), by End-User Industry 2024 & 2032
- Figure 34: Asia Pacific Polyamide Resins Industry Volume Share (%), by End-User Industry 2024 & 2032
- Figure 35: Asia Pacific Polyamide Resins Industry Revenue (Million), by Country 2024 & 2032
- Figure 36: Asia Pacific Polyamide Resins Industry Volume (K Tons), by Country 2024 & 2032
- Figure 37: Asia Pacific Polyamide Resins Industry Revenue Share (%), by Country 2024 & 2032
- Figure 38: Asia Pacific Polyamide Resins Industry Volume Share (%), by Country 2024 & 2032
- Figure 39: North America Polyamide Resins Industry Revenue (Million), by Product Type 2024 & 2032
- Figure 40: North America Polyamide Resins Industry Volume (K Tons), by Product Type 2024 & 2032
- Figure 41: North America Polyamide Resins Industry Revenue Share (%), by Product Type 2024 & 2032
- Figure 42: North America Polyamide Resins Industry Volume Share (%), by Product Type 2024 & 2032
- Figure 43: North America Polyamide Resins Industry Revenue (Million), by Application 2024 & 2032
- Figure 44: North America Polyamide Resins Industry Volume (K Tons), by Application 2024 & 2032
- Figure 45: North America Polyamide Resins Industry Revenue Share (%), by Application 2024 & 2032
- Figure 46: North America Polyamide Resins Industry Volume Share (%), by Application 2024 & 2032
- Figure 47: North America Polyamide Resins Industry Revenue (Million), by End-User Industry 2024 & 2032
- Figure 48: North America Polyamide Resins Industry Volume (K Tons), by End-User Industry 2024 & 2032
- Figure 49: North America Polyamide Resins Industry Revenue Share (%), by End-User Industry 2024 & 2032
- Figure 50: North America Polyamide Resins Industry Volume Share (%), by End-User Industry 2024 & 2032
- Figure 51: North America Polyamide Resins Industry Revenue (Million), by Country 2024 & 2032
- Figure 52: North America Polyamide Resins Industry Volume (K Tons), by Country 2024 & 2032
- Figure 53: North America Polyamide Resins Industry Revenue Share (%), by Country 2024 & 2032
- Figure 54: North America Polyamide Resins Industry Volume Share (%), by Country 2024 & 2032
- Figure 55: Europe Polyamide Resins Industry Revenue (Million), by Product Type 2024 & 2032
- Figure 56: Europe Polyamide Resins Industry Volume (K Tons), by Product Type 2024 & 2032
- Figure 57: Europe Polyamide Resins Industry Revenue Share (%), by Product Type 2024 & 2032
- Figure 58: Europe Polyamide Resins Industry Volume Share (%), by Product Type 2024 & 2032
- Figure 59: Europe Polyamide Resins Industry Revenue (Million), by Application 2024 & 2032
- Figure 60: Europe Polyamide Resins Industry Volume (K Tons), by Application 2024 & 2032
- Figure 61: Europe Polyamide Resins Industry Revenue Share (%), by Application 2024 & 2032
- Figure 62: Europe Polyamide Resins Industry Volume Share (%), by Application 2024 & 2032
- Figure 63: Europe Polyamide Resins Industry Revenue (Million), by End-User Industry 2024 & 2032
- Figure 64: Europe Polyamide Resins Industry Volume (K Tons), by End-User Industry 2024 & 2032
- Figure 65: Europe Polyamide Resins Industry Revenue Share (%), by End-User Industry 2024 & 2032
- Figure 66: Europe Polyamide Resins Industry Volume Share (%), by End-User Industry 2024 & 2032
- Figure 67: Europe Polyamide Resins Industry Revenue (Million), by Country 2024 & 2032
- Figure 68: Europe Polyamide Resins Industry Volume (K Tons), by Country 2024 & 2032
- Figure 69: Europe Polyamide Resins Industry Revenue Share (%), by Country 2024 & 2032
- Figure 70: Europe Polyamide Resins Industry Volume Share (%), by Country 2024 & 2032
- Figure 71: South America Polyamide Resins Industry Revenue (Million), by Product Type 2024 & 2032
- Figure 72: South America Polyamide Resins Industry Volume (K Tons), by Product Type 2024 & 2032
- Figure 73: South America Polyamide Resins Industry Revenue Share (%), by Product Type 2024 & 2032
- Figure 74: South America Polyamide Resins Industry Volume Share (%), by Product Type 2024 & 2032
- Figure 75: South America Polyamide Resins Industry Revenue (Million), by Application 2024 & 2032
- Figure 76: South America Polyamide Resins Industry Volume (K Tons), by Application 2024 & 2032
- Figure 77: South America Polyamide Resins Industry Revenue Share (%), by Application 2024 & 2032
- Figure 78: South America Polyamide Resins Industry Volume Share (%), by Application 2024 & 2032
- Figure 79: South America Polyamide Resins Industry Revenue (Million), by End-User Industry 2024 & 2032
- Figure 80: South America Polyamide Resins Industry Volume (K Tons), by End-User Industry 2024 & 2032
- Figure 81: South America Polyamide Resins Industry Revenue Share (%), by End-User Industry 2024 & 2032
- Figure 82: South America Polyamide Resins Industry Volume Share (%), by End-User Industry 2024 & 2032
- Figure 83: South America Polyamide Resins Industry Revenue (Million), by Country 2024 & 2032
- Figure 84: South America Polyamide Resins Industry Volume (K Tons), by Country 2024 & 2032
- Figure 85: South America Polyamide Resins Industry Revenue Share (%), by Country 2024 & 2032
- Figure 86: South America Polyamide Resins Industry Volume Share (%), by Country 2024 & 2032
- Figure 87: Middle East and Africa Polyamide Resins Industry Revenue (Million), by Product Type 2024 & 2032
- Figure 88: Middle East and Africa Polyamide Resins Industry Volume (K Tons), by Product Type 2024 & 2032
- Figure 89: Middle East and Africa Polyamide Resins Industry Revenue Share (%), by Product Type 2024 & 2032
- Figure 90: Middle East and Africa Polyamide Resins Industry Volume Share (%), by Product Type 2024 & 2032
- Figure 91: Middle East and Africa Polyamide Resins Industry Revenue (Million), by Application 2024 & 2032
- Figure 92: Middle East and Africa Polyamide Resins Industry Volume (K Tons), by Application 2024 & 2032
- Figure 93: Middle East and Africa Polyamide Resins Industry Revenue Share (%), by Application 2024 & 2032
- Figure 94: Middle East and Africa Polyamide Resins Industry Volume Share (%), by Application 2024 & 2032
- Figure 95: Middle East and Africa Polyamide Resins Industry Revenue (Million), by End-User Industry 2024 & 2032
- Figure 96: Middle East and Africa Polyamide Resins Industry Volume (K Tons), by End-User Industry 2024 & 2032
- Figure 97: Middle East and Africa Polyamide Resins Industry Revenue Share (%), by End-User Industry 2024 & 2032
- Figure 98: Middle East and Africa Polyamide Resins Industry Volume Share (%), by End-User Industry 2024 & 2032
- Figure 99: Middle East and Africa Polyamide Resins Industry Revenue (Million), by Country 2024 & 2032
- Figure 100: Middle East and Africa Polyamide Resins Industry Volume (K Tons), by Country 2024 & 2032
- Figure 101: Middle East and Africa Polyamide Resins Industry Revenue Share (%), by Country 2024 & 2032
- Figure 102: Middle East and Africa Polyamide Resins Industry Volume Share (%), by Country 2024 & 2032
List of Tables
- Table 1: Global Polyamide Resins Industry Revenue Million Forecast, by Region 2019 & 2032
- Table 2: Global Polyamide Resins Industry Volume K Tons Forecast, by Region 2019 & 2032
- Table 3: Global Polyamide Resins Industry Revenue Million Forecast, by Product Type 2019 & 2032
- Table 4: Global Polyamide Resins Industry Volume K Tons Forecast, by Product Type 2019 & 2032
- Table 5: Global Polyamide Resins Industry Revenue Million Forecast, by Application 2019 & 2032
- Table 6: Global Polyamide Resins Industry Volume K Tons Forecast, by Application 2019 & 2032
- Table 7: Global Polyamide Resins Industry Revenue Million Forecast, by End-User Industry 2019 & 2032
- Table 8: Global Polyamide Resins Industry Volume K Tons Forecast, by End-User Industry 2019 & 2032
- Table 9: Global Polyamide Resins Industry Revenue Million Forecast, by Region 2019 & 2032
- Table 10: Global Polyamide Resins Industry Volume K Tons Forecast, by Region 2019 & 2032
- Table 11: Global Polyamide Resins Industry Revenue Million Forecast, by Country 2019 & 2032
- Table 12: Global Polyamide Resins Industry Volume K Tons Forecast, by Country 2019 & 2032
- Table 13: United States Polyamide Resins Industry Revenue (Million) Forecast, by Application 2019 & 2032
- Table 14: United States Polyamide Resins Industry Volume (K Tons) Forecast, by Application 2019 & 2032
- Table 15: Canada Polyamide Resins Industry Revenue (Million) Forecast, by Application 2019 & 2032
- Table 16: Canada Polyamide Resins Industry Volume (K Tons) Forecast, by Application 2019 & 2032
- Table 17: Mexico Polyamide Resins Industry Revenue (Million) Forecast, by Application 2019 & 2032
- Table 18: Mexico Polyamide Resins Industry Volume (K Tons) Forecast, by Application 2019 & 2032
- Table 19: Global Polyamide Resins Industry Revenue Million Forecast, by Country 2019 & 2032
- Table 20: Global Polyamide Resins Industry Volume K Tons Forecast, by Country 2019 & 2032
- Table 21: Germany Polyamide Resins Industry Revenue (Million) Forecast, by Application 2019 & 2032
- Table 22: Germany Polyamide Resins Industry Volume (K Tons) Forecast, by Application 2019 & 2032
- Table 23: France Polyamide Resins Industry Revenue (Million) Forecast, by Application 2019 & 2032
- Table 24: France Polyamide Resins Industry Volume (K Tons) Forecast, by Application 2019 & 2032
- Table 25: Italy Polyamide Resins Industry Revenue (Million) Forecast, by Application 2019 & 2032
- Table 26: Italy Polyamide Resins Industry Volume (K Tons) Forecast, by Application 2019 & 2032
- Table 27: United Kingdom Polyamide Resins Industry Revenue (Million) Forecast, by Application 2019 & 2032
- Table 28: United Kingdom Polyamide Resins Industry Volume (K Tons) Forecast, by Application 2019 & 2032
- Table 29: Netherlands Polyamide Resins Industry Revenue (Million) Forecast, by Application 2019 & 2032
- Table 30: Netherlands Polyamide Resins Industry Volume (K Tons) Forecast, by Application 2019 & 2032
- Table 31: Rest of Europe Polyamide Resins Industry Revenue (Million) Forecast, by Application 2019 & 2032
- Table 32: Rest of Europe Polyamide Resins Industry Volume (K Tons) Forecast, by Application 2019 & 2032
- Table 33: Global Polyamide Resins Industry Revenue Million Forecast, by Country 2019 & 2032
- Table 34: Global Polyamide Resins Industry Volume K Tons Forecast, by Country 2019 & 2032
- Table 35: China Polyamide Resins Industry Revenue (Million) Forecast, by Application 2019 & 2032
- Table 36: China Polyamide Resins Industry Volume (K Tons) Forecast, by Application 2019 & 2032
- Table 37: Japan Polyamide Resins Industry Revenue (Million) Forecast, by Application 2019 & 2032
- Table 38: Japan Polyamide Resins Industry Volume (K Tons) Forecast, by Application 2019 & 2032
- Table 39: India Polyamide Resins Industry Revenue (Million) Forecast, by Application 2019 & 2032
- Table 40: India Polyamide Resins Industry Volume (K Tons) Forecast, by Application 2019 & 2032
- Table 41: South Korea Polyamide Resins Industry Revenue (Million) Forecast, by Application 2019 & 2032
- Table 42: South Korea Polyamide Resins Industry Volume (K Tons) Forecast, by Application 2019 & 2032
- Table 43: Taiwan Polyamide Resins Industry Revenue (Million) Forecast, by Application 2019 & 2032
- Table 44: Taiwan Polyamide Resins Industry Volume (K Tons) Forecast, by Application 2019 & 2032
- Table 45: Australia Polyamide Resins Industry Revenue (Million) Forecast, by Application 2019 & 2032
- Table 46: Australia Polyamide Resins Industry Volume (K Tons) Forecast, by Application 2019 & 2032
- Table 47: Rest of Asia-Pacific Polyamide Resins Industry Revenue (Million) Forecast, by Application 2019 & 2032
- Table 48: Rest of Asia-Pacific Polyamide Resins Industry Volume (K Tons) Forecast, by Application 2019 & 2032
- Table 49: Global Polyamide Resins Industry Revenue Million Forecast, by Country 2019 & 2032
- Table 50: Global Polyamide Resins Industry Volume K Tons Forecast, by Country 2019 & 2032
- Table 51: Brazil Polyamide Resins Industry Revenue (Million) Forecast, by Application 2019 & 2032
- Table 52: Brazil Polyamide Resins Industry Volume (K Tons) Forecast, by Application 2019 & 2032
- Table 53: Argentina Polyamide Resins Industry Revenue (Million) Forecast, by Application 2019 & 2032
- Table 54: Argentina Polyamide Resins Industry Volume (K Tons) Forecast, by Application 2019 & 2032
- Table 55: Rest of South America Polyamide Resins Industry Revenue (Million) Forecast, by Application 2019 & 2032
- Table 56: Rest of South America Polyamide Resins Industry Volume (K Tons) Forecast, by Application 2019 & 2032
- Table 57: Global Polyamide Resins Industry Revenue Million Forecast, by Country 2019 & 2032
- Table 58: Global Polyamide Resins Industry Volume K Tons Forecast, by Country 2019 & 2032
- Table 59: Middle East Polyamide Resins Industry Revenue (Million) Forecast, by Application 2019 & 2032
- Table 60: Middle East Polyamide Resins Industry Volume (K Tons) Forecast, by Application 2019 & 2032
- Table 61: Africa Polyamide Resins Industry Revenue (Million) Forecast, by Application 2019 & 2032
- Table 62: Africa Polyamide Resins Industry Volume (K Tons) Forecast, by Application 2019 & 2032
- Table 63: Global Polyamide Resins Industry Revenue Million Forecast, by Product Type 2019 & 2032
- Table 64: Global Polyamide Resins Industry Volume K Tons Forecast, by Product Type 2019 & 2032
- Table 65: Global Polyamide Resins Industry Revenue Million Forecast, by Application 2019 & 2032
- Table 66: Global Polyamide Resins Industry Volume K Tons Forecast, by Application 2019 & 2032
- Table 67: Global Polyamide Resins Industry Revenue Million Forecast, by End-User Industry 2019 & 2032
- Table 68: Global Polyamide Resins Industry Volume K Tons Forecast, by End-User Industry 2019 & 2032
- Table 69: Global Polyamide Resins Industry Revenue Million Forecast, by Country 2019 & 2032
- Table 70: Global Polyamide Resins Industry Volume K Tons Forecast, by Country 2019 & 2032
- Table 71: China Polyamide Resins Industry Revenue (Million) Forecast, by Application 2019 & 2032
- Table 72: China Polyamide Resins Industry Volume (K Tons) Forecast, by Application 2019 & 2032
- Table 73: India Polyamide Resins Industry Revenue (Million) Forecast, by Application 2019 & 2032
- Table 74: India Polyamide Resins Industry Volume (K Tons) Forecast, by Application 2019 & 2032
- Table 75: Japan Polyamide Resins Industry Revenue (Million) Forecast, by Application 2019 & 2032
- Table 76: Japan Polyamide Resins Industry Volume (K Tons) Forecast, by Application 2019 & 2032
- Table 77: South Korea Polyamide Resins Industry Revenue (Million) Forecast, by Application 2019 & 2032
- Table 78: South Korea Polyamide Resins Industry Volume (K Tons) Forecast, by Application 2019 & 2032
- Table 79: ASEAN Countries Polyamide Resins Industry Revenue (Million) Forecast, by Application 2019 & 2032
- Table 80: ASEAN Countries Polyamide Resins Industry Volume (K Tons) Forecast, by Application 2019 & 2032
- Table 81: Rest of Asia Pacific Polyamide Resins Industry Revenue (Million) Forecast, by Application 2019 & 2032
- Table 82: Rest of Asia Pacific Polyamide Resins Industry Volume (K Tons) Forecast, by Application 2019 & 2032
- Table 83: Global Polyamide Resins Industry Revenue Million Forecast, by Product Type 2019 & 2032
- Table 84: Global Polyamide Resins Industry Volume K Tons Forecast, by Product Type 2019 & 2032
- Table 85: Global Polyamide Resins Industry Revenue Million Forecast, by Application 2019 & 2032
- Table 86: Global Polyamide Resins Industry Volume K Tons Forecast, by Application 2019 & 2032
- Table 87: Global Polyamide Resins Industry Revenue Million Forecast, by End-User Industry 2019 & 2032
- Table 88: Global Polyamide Resins Industry Volume K Tons Forecast, by End-User Industry 2019 & 2032
- Table 89: Global Polyamide Resins Industry Revenue Million Forecast, by Country 2019 & 2032
- Table 90: Global Polyamide Resins Industry Volume K Tons Forecast, by Country 2019 & 2032
- Table 91: United States Polyamide Resins Industry Revenue (Million) Forecast, by Application 2019 & 2032
- Table 92: United States Polyamide Resins Industry Volume (K Tons) Forecast, by Application 2019 & 2032
- Table 93: Canada Polyamide Resins Industry Revenue (Million) Forecast, by Application 2019 & 2032
- Table 94: Canada Polyamide Resins Industry Volume (K Tons) Forecast, by Application 2019 & 2032
- Table 95: Mexico Polyamide Resins Industry Revenue (Million) Forecast, by Application 2019 & 2032
- Table 96: Mexico Polyamide Resins Industry Volume (K Tons) Forecast, by Application 2019 & 2032
- Table 97: Global Polyamide Resins Industry Revenue Million Forecast, by Product Type 2019 & 2032
- Table 98: Global Polyamide Resins Industry Volume K Tons Forecast, by Product Type 2019 & 2032
- Table 99: Global Polyamide Resins Industry Revenue Million Forecast, by Application 2019 & 2032
- Table 100: Global Polyamide Resins Industry Volume K Tons Forecast, by Application 2019 & 2032
- Table 101: Global Polyamide Resins Industry Revenue Million Forecast, by End-User Industry 2019 & 2032
- Table 102: Global Polyamide Resins Industry Volume K Tons Forecast, by End-User Industry 2019 & 2032
- Table 103: Global Polyamide Resins Industry Revenue Million Forecast, by Country 2019 & 2032
- Table 104: Global Polyamide Resins Industry Volume K Tons Forecast, by Country 2019 & 2032
- Table 105: Germany Polyamide Resins Industry Revenue (Million) Forecast, by Application 2019 & 2032
- Table 106: Germany Polyamide Resins Industry Volume (K Tons) Forecast, by Application 2019 & 2032
- Table 107: United Kingdom Polyamide Resins Industry Revenue (Million) Forecast, by Application 2019 & 2032
- Table 108: United Kingdom Polyamide Resins Industry Volume (K Tons) Forecast, by Application 2019 & 2032
- Table 109: Italy Polyamide Resins Industry Revenue (Million) Forecast, by Application 2019 & 2032
- Table 110: Italy Polyamide Resins Industry Volume (K Tons) Forecast, by Application 2019 & 2032
- Table 111: France Polyamide Resins Industry Revenue (Million) Forecast, by Application 2019 & 2032
- Table 112: France Polyamide Resins Industry Volume (K Tons) Forecast, by Application 2019 & 2032
- Table 113: Rest of Europe Polyamide Resins Industry Revenue (Million) Forecast, by Application 2019 & 2032
- Table 114: Rest of Europe Polyamide Resins Industry Volume (K Tons) Forecast, by Application 2019 & 2032
- Table 115: Global Polyamide Resins Industry Revenue Million Forecast, by Product Type 2019 & 2032
- Table 116: Global Polyamide Resins Industry Volume K Tons Forecast, by Product Type 2019 & 2032
- Table 117: Global Polyamide Resins Industry Revenue Million Forecast, by Application 2019 & 2032
- Table 118: Global Polyamide Resins Industry Volume K Tons Forecast, by Application 2019 & 2032
- Table 119: Global Polyamide Resins Industry Revenue Million Forecast, by End-User Industry 2019 & 2032
- Table 120: Global Polyamide Resins Industry Volume K Tons Forecast, by End-User Industry 2019 & 2032
- Table 121: Global Polyamide Resins Industry Revenue Million Forecast, by Country 2019 & 2032
- Table 122: Global Polyamide Resins Industry Volume K Tons Forecast, by Country 2019 & 2032
- Table 123: Brazil Polyamide Resins Industry Revenue (Million) Forecast, by Application 2019 & 2032
- Table 124: Brazil Polyamide Resins Industry Volume (K Tons) Forecast, by Application 2019 & 2032
- Table 125: Argentina Polyamide Resins Industry Revenue (Million) Forecast, by Application 2019 & 2032
- Table 126: Argentina Polyamide Resins Industry Volume (K Tons) Forecast, by Application 2019 & 2032
- Table 127: Rest of South America Polyamide Resins Industry Revenue (Million) Forecast, by Application 2019 & 2032
- Table 128: Rest of South America Polyamide Resins Industry Volume (K Tons) Forecast, by Application 2019 & 2032
- Table 129: Global Polyamide Resins Industry Revenue Million Forecast, by Product Type 2019 & 2032
- Table 130: Global Polyamide Resins Industry Volume K Tons Forecast, by Product Type 2019 & 2032
- Table 131: Global Polyamide Resins Industry Revenue Million Forecast, by Application 2019 & 2032
- Table 132: Global Polyamide Resins Industry Volume K Tons Forecast, by Application 2019 & 2032
- Table 133: Global Polyamide Resins Industry Revenue Million Forecast, by End-User Industry 2019 & 2032
- Table 134: Global Polyamide Resins Industry Volume K Tons Forecast, by End-User Industry 2019 & 2032
- Table 135: Global Polyamide Resins Industry Revenue Million Forecast, by Country 2019 & 2032
- Table 136: Global Polyamide Resins Industry Volume K Tons Forecast, by Country 2019 & 2032
- Table 137: Saudi Arabia Polyamide Resins Industry Revenue (Million) Forecast, by Application 2019 & 2032
- Table 138: Saudi Arabia Polyamide Resins Industry Volume (K Tons) Forecast, by Application 2019 & 2032
- Table 139: South Africa Polyamide Resins Industry Revenue (Million) Forecast, by Application 2019 & 2032
- Table 140: South Africa Polyamide Resins Industry Volume (K Tons) Forecast, by Application 2019 & 2032
- Table 141: Rest of Middle East and Africa Polyamide Resins Industry Revenue (Million) Forecast, by Application 2019 & 2032
- Table 142: Rest of Middle East and Africa Polyamide Resins Industry Volume (K Tons) Forecast, by Application 2019 & 2032
Frequently Asked Questions
1. What is the projected Compound Annual Growth Rate (CAGR) of the Polyamide Resins Industry?
The projected CAGR is approximately 4.45%.
2. Which companies are prominent players in the Polyamide Resins Industry?
Key companies in the market include Solvay, Asahi Kasei Corporation, KURARAY CO LTD, Dupont, Ascend Performance Materials, INVISTA, BASF SE, DSM, Aquafil S p A, NILIT.
3. What are the main segments of the Polyamide Resins Industry?
The market segments include Product Type, Application, End-User Industry.
4. Can you provide details about the market size?
The market size is estimated to be USD XX Million as of 2022.
5. What are some drivers contributing to market growth?
Increasing Demand from the Automobile Industry due to its High Utilization in making Molded Parts; Rising Demand from the Packaging Sector; Other Drivers.
6. What are the notable trends driving market growth?
Increasing Demand from Automotive Industry.
7. Are there any restraints impacting market growth?
Strict Government Regulations for Reducing Negative Environmental Impacts; Other Restraints.
8. Can you provide examples of recent developments in the market?
April 2023: Asahi Kasei Corporation and Microwave Chemical launched a joint demonstration project with the objective of commercializing a chemical recycling process for polyamide 66 using microwave technology. The process utilizes microwaves to depolymerize PA66 and directly obtain the monomers hexamethylenediamine (HMD) and adipic acid (ADA), which is expected to be accomplished at a high yield with low energy consumption. The monomers obtained can then be used to manufacture new PA66.
9. What pricing options are available for accessing the report?
Pricing options include single-user, multi-user, and enterprise licenses priced at USD 4750, USD 5250, and USD 8750 respectively.
10. Is the market size provided in terms of value or volume?
The market size is provided in terms of value, measured in Million and volume, measured in K Tons.
11. Are there any specific market keywords associated with the report?
Yes, the market keyword associated with the report is "Polyamide Resins Industry," which aids in identifying and referencing the specific market segment covered.
12. How do I determine which pricing option suits my needs best?
The pricing options vary based on user requirements and access needs. Individual users may opt for single-user licenses, while businesses requiring broader access may choose multi-user or enterprise licenses for cost-effective access to the report.
13. Are there any additional resources or data provided in the Polyamide Resins Industry report?
While the report offers comprehensive insights, it's advisable to review the specific contents or supplementary materials provided to ascertain if additional resources or data are available.
14. How can I stay updated on further developments or reports in the Polyamide Resins Industry?
To stay informed about further developments, trends, and reports in the Polyamide Resins Industry, consider subscribing to industry newsletters, following relevant companies and organizations, or regularly checking reputable industry news sources and publications.
Methodology
Step 1 - Identification of Relevant Samples Size from Population Database


Step 2 - Approaches for Defining Global Market Size (Value, Volume* & Price*)

Note*: In applicable scenarios
Step 3 - Data Sources
Primary Research
- Web Analytics
- Survey Reports
- Research Institute
- Latest Research Reports
- Opinion Leaders
Secondary Research
- Annual Reports
- White Paper
- Latest Press Release
- Industry Association
- Paid Database
- Investor Presentations

Step 4 - Data Triangulation
Involves using different sources of information in order to increase the validity of a study
These sources are likely to be stakeholders in a program - participants, other researchers, program staff, other community members, and so on.
Then we put all data in single framework & apply various statistical tools to find out the dynamic on the market.
During the analysis stage, feedback from the stakeholder groups would be compared to determine areas of agreement as well as areas of divergence
