

Key Insights
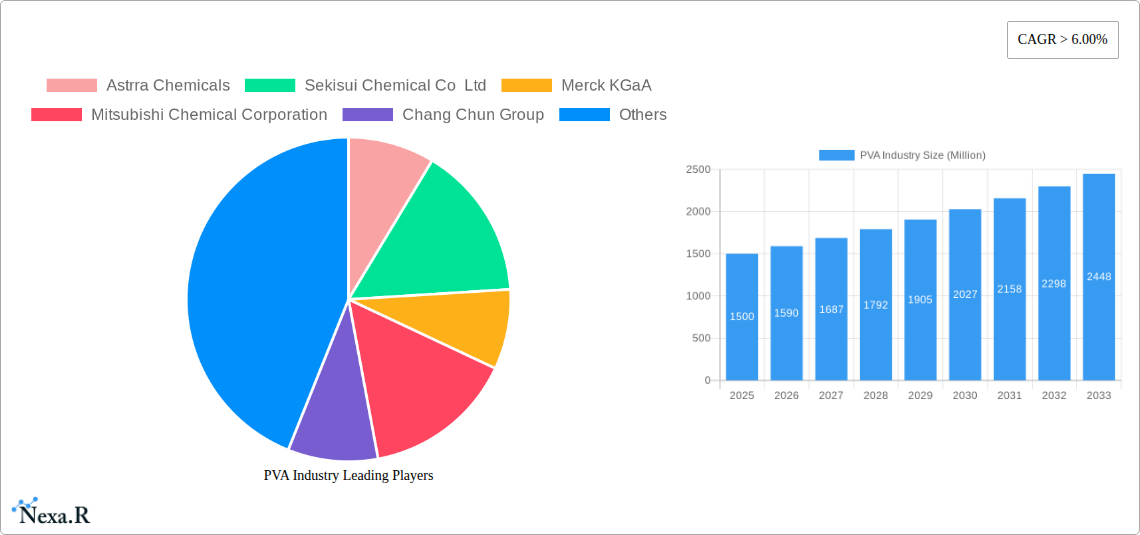
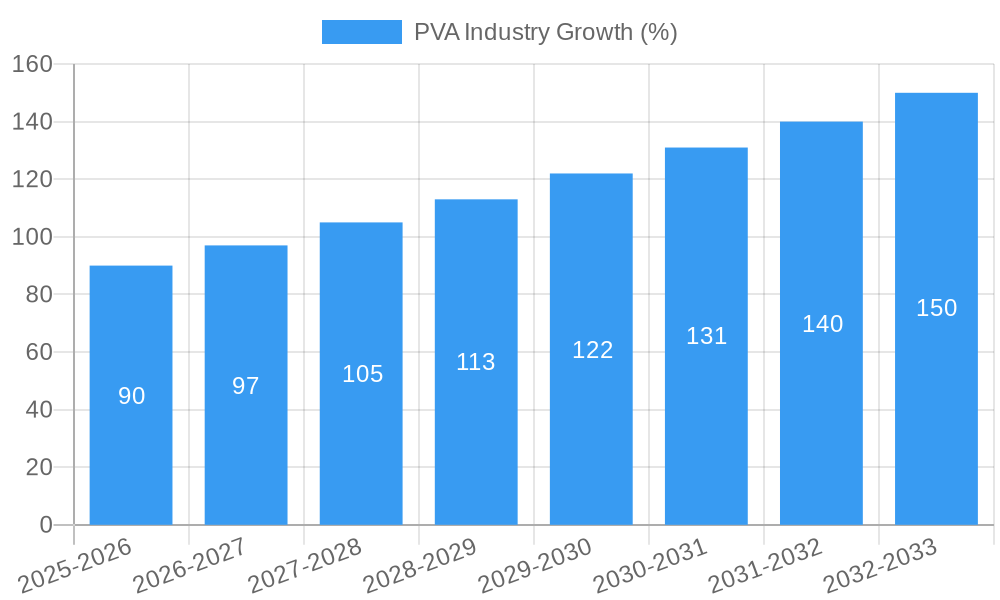
The global Polyvinyl Alcohol (PVA) market is experiencing robust growth, projected to maintain a Compound Annual Growth Rate (CAGR) exceeding 6% from 2025 to 2033. This expansion is fueled by several key drivers. The increasing demand for eco-friendly packaging materials in the food and beverage industry is a significant factor, as PVA offers biodegradability and superior barrier properties compared to traditional plastics. Furthermore, the construction sector's reliance on PVA-based adhesives and binders contributes significantly to market growth. The rising adoption of PVA in the electronics industry for applications like films and coatings further fuels market expansion. Technological advancements leading to improved PVA grades with enhanced properties like low foaming and higher tactification also contribute to this positive outlook. Segment-wise, fully hydrolyzed PVA dominates due to its broad applicability, while the partially and sub-partially hydrolyzed grades are witnessing steady growth driven by specific niche applications. Geographically, the Asia-Pacific region, particularly China and India, exhibits the highest growth potential owing to rapid industrialization and increasing disposable incomes. However, fluctuating raw material prices and potential environmental regulations pose challenges to market expansion.
Despite these challenges, the long-term outlook remains positive. The ongoing shift towards sustainable materials and the continuous innovation in PVA technology are expected to drive further market penetration across various end-use sectors. Companies like Sekisui Chemical, Merck KGaA, and Mitsubishi Chemical Corporation are major players, constantly investing in research and development to improve product quality and expand their market share. The competitive landscape is characterized by both large multinational corporations and smaller regional players, resulting in a dynamic market with diverse product offerings and pricing strategies. The forecast period will likely witness increased consolidation through mergers and acquisitions, along with a focus on developing specialized PVA grades tailored to specific end-user needs. The market's segmentation offers ample opportunities for players to capitalize on niche applications, driving further growth and innovation within the industry.
PVA Industry Market Report: 2019-2033
This comprehensive report provides a detailed analysis of the Polyvinyl Alcohol (PVA) industry, encompassing market dynamics, growth trends, regional dominance, product landscape, and key player strategies. The study period covers 2019-2033, with 2025 as the base and estimated year. The report utilizes both quantitative and qualitative data to offer actionable insights for industry professionals and investors. Parent markets include chemical manufacturing and industrial materials, while child markets span diverse sectors including food packaging, paper manufacturing, and construction. The total market size in 2025 is estimated at xx Million units.
PVA Industry Market Dynamics & Structure
The PVA industry exhibits a moderately concentrated market structure, with a few major players holding significant market share. Technological innovation, particularly in developing specialized grades like low-foaming PVA, is a key driver. Stringent regulatory frameworks related to food safety and environmental concerns influence product development and manufacturing processes. Competitive substitutes, such as other water-soluble polymers, pose a challenge. End-user demographics are diverse, spanning various industrial sectors with varying demand patterns. M&A activity has been moderate, with strategic acquisitions focused on expanding geographical reach and product portfolios.
- Market Concentration: Top 5 players account for approximately xx% of the global market in 2025.
- Technological Innovation: Focus on sustainable and high-performance PVA grades.
- Regulatory Landscape: Stringent regulations related to food safety and environmental impact.
- Competitive Substitutes: Presence of alternative water-soluble polymers.
- M&A Activity: xx deals recorded between 2019 and 2024, primarily focused on expanding capacity and market reach.
PVA Industry Growth Trends & Insights
The PVA market is projected to experience robust growth during the forecast period (2025-2033). Driven by increasing demand from key end-use sectors like packaging and construction, the market is expected to achieve a CAGR of xx% between 2025 and 2033, reaching an estimated size of xx Million units by 2033. Technological advancements leading to the development of specialized PVA grades with enhanced properties are further boosting market expansion. Increased adoption in emerging economies, coupled with shifting consumer preferences towards sustainable packaging solutions, are contributing to growth. Market penetration in certain niche applications remains relatively low, offering significant growth potential.
Dominant Regions, Countries, or Segments in PVA Industry
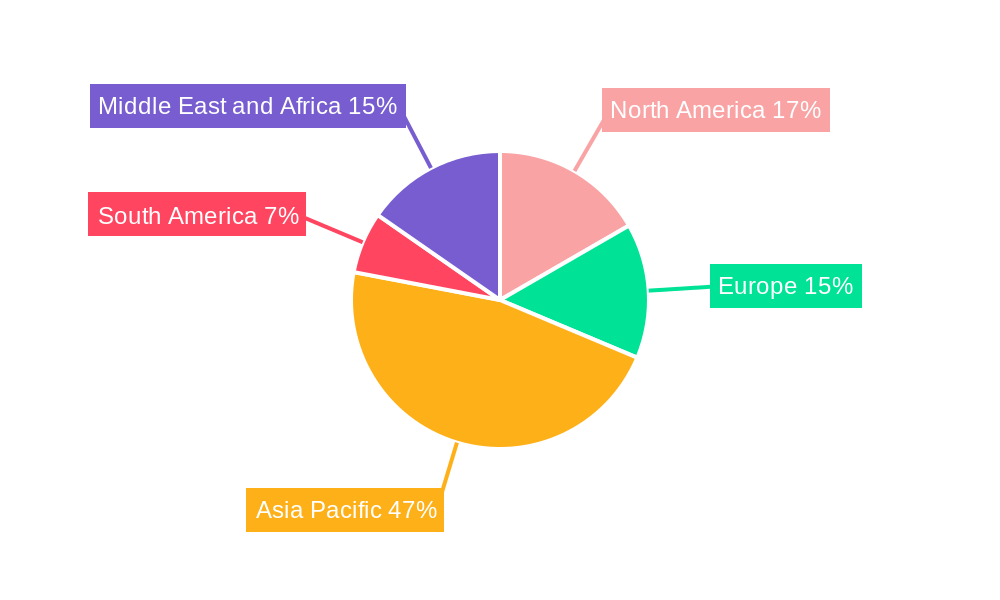
Asia-Pacific dominates the global PVA market, driven by strong growth in China and other emerging economies. This region's dominance is fueled by robust industrialization, expanding infrastructure development, and rising demand from packaging and construction sectors. Within grades, Fully Hydrolyzed PVA holds the largest market share due to its wide range of applications. In terms of end-users, the Food Packaging segment exhibits significant growth potential, driven by increasing demand for sustainable and environmentally friendly packaging solutions.
- Key Drivers (Asia-Pacific): Rapid industrialization, infrastructure development, and rising disposable incomes.
- Key Drivers (Fully Hydrolyzed PVA): Versatility and wide range of applications.
- Key Drivers (Food Packaging): Growing demand for sustainable packaging materials.
- Market Share (Asia-Pacific): xx% in 2025.
- Market Share (Fully Hydrolyzed PVA): xx% in 2025.
- Market Share (Food Packaging): xx% in 2025.
PVA Industry Product Landscape
The PVA product landscape is characterized by a wide range of grades tailored to specific applications, including fully hydrolyzed, partially hydrolyzed, sub-partially hydrolyzed, low-foaming, and other specialized grades like tactified and fine particle grades. Product innovations focus on improving properties such as film strength, water solubility, and biodegradability. These advancements cater to the evolving needs of diverse end-user industries, enhancing the performance and functionality of PVA in various applications.
Key Drivers, Barriers & Challenges in PVA Industry
Key Drivers: Growing demand from packaging and construction; technological advancements leading to improved product properties; and increasing focus on sustainable materials.
Key Challenges: Fluctuations in raw material prices; stringent environmental regulations; and competitive pressure from alternative polymers. Supply chain disruptions can lead to production delays and price volatility, impacting market stability. The estimated impact of supply chain issues on market growth is a reduction of xx% in 2024.
Emerging Opportunities in PVA Industry
Emerging opportunities lie in developing biodegradable and compostable PVA grades to meet growing sustainability concerns. Expansion into niche applications, such as biomedical devices and advanced electronics, offers significant growth potential. The exploration of innovative applications within emerging economies with expanding industrial sectors presents further opportunities.
Growth Accelerators in the PVA Industry
Technological breakthroughs in PVA synthesis and modification are key catalysts for long-term growth. Strategic partnerships and collaborations between PVA manufacturers and end-user industries are driving market expansion. Market expansion strategies focused on emerging economies and niche applications will significantly contribute to sustained growth.
Key Players Shaping the PVA Industry Market
- Astrra Chemicals
- Sekisui Chemical Co Ltd
- Merck KGaA
- Mitsubishi Chemical Corporation
- Chang Chun Group
- SNP Inc
- Kemipex
- Kuraray Europe GmbH
- Anhui Wanwei Group
- Japan Vam & Poval Co Ltd
- Polysciences Inc
Notable Milestones in PVA Industry Sector
- August 2022: Sekisui Specialty Chemicals (SSC) announced feasibility studies for a 25% expansion of its PVOH supply network.
- November 2021: Kuraray Poval launched a new sales organization in Iberia to enhance customer proximity and service.
In-Depth PVA Industry Market Outlook
The PVA industry is poised for sustained growth, driven by ongoing technological advancements and increasing demand from diverse end-use sectors. Strategic opportunities lie in developing specialized PVA grades, expanding into untapped markets, and fostering collaborations to enhance supply chain efficiency and sustainability. The long-term outlook remains positive, with the market projected to witness significant expansion throughout the forecast period.
PVA Industry Segmentation
-
1. Grade
- 1.1. Fully Hydrolyzed
- 1.2. Partially Hydrolyzed
- 1.3. Sub-partially Hydrolyzed
- 1.4. Low Foaming Grades
- 1.5. Other Gr
-
2. End User
- 2.1. Food Packaging
- 2.2. Paper Manufacturing
- 2.3. Construction
- 2.4. Electronics
- 2.5. Textile Manufacturing
- 2.6. Other End User Industries
PVA Industry Segmentation By Geography
-
1. Asia Pacific
- 1.1. China
- 1.2. India
- 1.3. Japan
- 1.4. South Korea
- 1.5. Rest of Asia Pacific
-
2. North America
- 2.1. United States
- 2.2. Canada
- 2.3. Mexico
-
3. Europe
- 3.1. Germany
- 3.2. United Kingdom
- 3.3. Italy
- 3.4. France
- 3.5. Rest of Europe
-
4. South America
- 4.1. Brazil
- 4.2. Argentina
- 4.3. Rest of South America
-
5. Middle East and Africa
- 5.1. Saudi Arabia
- 5.2. South Africa
- 5.3. Rest of Middle East and Africa
PVA Industry REPORT HIGHLIGHTS
| Aspects | Details |
|---|---|
| Study Period | 2019-2033 |
| Base Year | 2024 |
| Estimated Year | 2025 |
| Forecast Period | 2025-2033 |
| Historical Period | 2019-2024 |
| Growth Rate | CAGR of > 6.00% from 2019-2033 |
| Segmentation |
|
Table of Contents
- 1. Introduction
- 1.1. Research Scope
- 1.2. Market Segmentation
- 1.3. Research Methodology
- 1.4. Definitions and Assumptions
- 2. Executive Summary
- 2.1. Introduction
- 3. Market Dynamics
- 3.1. Introduction
- 3.2. Market Drivers
- 3.2.1. Increasing Use in the Construction Industry; Growing Food Packaging Industry
- 3.3. Market Restrains
- 3.3.1. Hazardous Health Effects While Manufacturing
- 3.4. Market Trends
- 3.4.1. Food Packaging to Dominate the Market
- 4. Market Factor Analysis
- 4.1. Porters Five Forces
- 4.2. Supply/Value Chain
- 4.3. PESTEL analysis
- 4.4. Market Entropy
- 4.5. Patent/Trademark Analysis
- 5. Global PVA Industry Analysis, Insights and Forecast, 2019-2031
- 5.1. Market Analysis, Insights and Forecast - by Grade
- 5.1.1. Fully Hydrolyzed
- 5.1.2. Partially Hydrolyzed
- 5.1.3. Sub-partially Hydrolyzed
- 5.1.4. Low Foaming Grades
- 5.1.5. Other Gr
- 5.2. Market Analysis, Insights and Forecast - by End User
- 5.2.1. Food Packaging
- 5.2.2. Paper Manufacturing
- 5.2.3. Construction
- 5.2.4. Electronics
- 5.2.5. Textile Manufacturing
- 5.2.6. Other End User Industries
- 5.3. Market Analysis, Insights and Forecast - by Region
- 5.3.1. Asia Pacific
- 5.3.2. North America
- 5.3.3. Europe
- 5.3.4. South America
- 5.3.5. Middle East and Africa
- 5.1. Market Analysis, Insights and Forecast - by Grade
- 6. Asia Pacific PVA Industry Analysis, Insights and Forecast, 2019-2031
- 6.1. Market Analysis, Insights and Forecast - by Grade
- 6.1.1. Fully Hydrolyzed
- 6.1.2. Partially Hydrolyzed
- 6.1.3. Sub-partially Hydrolyzed
- 6.1.4. Low Foaming Grades
- 6.1.5. Other Gr
- 6.2. Market Analysis, Insights and Forecast - by End User
- 6.2.1. Food Packaging
- 6.2.2. Paper Manufacturing
- 6.2.3. Construction
- 6.2.4. Electronics
- 6.2.5. Textile Manufacturing
- 6.2.6. Other End User Industries
- 6.1. Market Analysis, Insights and Forecast - by Grade
- 7. North America PVA Industry Analysis, Insights and Forecast, 2019-2031
- 7.1. Market Analysis, Insights and Forecast - by Grade
- 7.1.1. Fully Hydrolyzed
- 7.1.2. Partially Hydrolyzed
- 7.1.3. Sub-partially Hydrolyzed
- 7.1.4. Low Foaming Grades
- 7.1.5. Other Gr
- 7.2. Market Analysis, Insights and Forecast - by End User
- 7.2.1. Food Packaging
- 7.2.2. Paper Manufacturing
- 7.2.3. Construction
- 7.2.4. Electronics
- 7.2.5. Textile Manufacturing
- 7.2.6. Other End User Industries
- 7.1. Market Analysis, Insights and Forecast - by Grade
- 8. Europe PVA Industry Analysis, Insights and Forecast, 2019-2031
- 8.1. Market Analysis, Insights and Forecast - by Grade
- 8.1.1. Fully Hydrolyzed
- 8.1.2. Partially Hydrolyzed
- 8.1.3. Sub-partially Hydrolyzed
- 8.1.4. Low Foaming Grades
- 8.1.5. Other Gr
- 8.2. Market Analysis, Insights and Forecast - by End User
- 8.2.1. Food Packaging
- 8.2.2. Paper Manufacturing
- 8.2.3. Construction
- 8.2.4. Electronics
- 8.2.5. Textile Manufacturing
- 8.2.6. Other End User Industries
- 8.1. Market Analysis, Insights and Forecast - by Grade
- 9. South America PVA Industry Analysis, Insights and Forecast, 2019-2031
- 9.1. Market Analysis, Insights and Forecast - by Grade
- 9.1.1. Fully Hydrolyzed
- 9.1.2. Partially Hydrolyzed
- 9.1.3. Sub-partially Hydrolyzed
- 9.1.4. Low Foaming Grades
- 9.1.5. Other Gr
- 9.2. Market Analysis, Insights and Forecast - by End User
- 9.2.1. Food Packaging
- 9.2.2. Paper Manufacturing
- 9.2.3. Construction
- 9.2.4. Electronics
- 9.2.5. Textile Manufacturing
- 9.2.6. Other End User Industries
- 9.1. Market Analysis, Insights and Forecast - by Grade
- 10. Middle East and Africa PVA Industry Analysis, Insights and Forecast, 2019-2031
- 10.1. Market Analysis, Insights and Forecast - by Grade
- 10.1.1. Fully Hydrolyzed
- 10.1.2. Partially Hydrolyzed
- 10.1.3. Sub-partially Hydrolyzed
- 10.1.4. Low Foaming Grades
- 10.1.5. Other Gr
- 10.2. Market Analysis, Insights and Forecast - by End User
- 10.2.1. Food Packaging
- 10.2.2. Paper Manufacturing
- 10.2.3. Construction
- 10.2.4. Electronics
- 10.2.5. Textile Manufacturing
- 10.2.6. Other End User Industries
- 10.1. Market Analysis, Insights and Forecast - by Grade
- 11. Asia Pacific PVA Industry Analysis, Insights and Forecast, 2019-2031
- 11.1. Market Analysis, Insights and Forecast - By Country/Sub-region
- 11.1.1 China
- 11.1.2 India
- 11.1.3 Japan
- 11.1.4 South Korea
- 11.1.5 Rest of Asia Pacific
- 12. North America PVA Industry Analysis, Insights and Forecast, 2019-2031
- 12.1. Market Analysis, Insights and Forecast - By Country/Sub-region
- 12.1.1 United States
- 12.1.2 Canada
- 12.1.3 Mexico
- 13. Europe PVA Industry Analysis, Insights and Forecast, 2019-2031
- 13.1. Market Analysis, Insights and Forecast - By Country/Sub-region
- 13.1.1 Germany
- 13.1.2 United Kingdom
- 13.1.3 Italy
- 13.1.4 France
- 13.1.5 Rest of Europe
- 14. South America PVA Industry Analysis, Insights and Forecast, 2019-2031
- 14.1. Market Analysis, Insights and Forecast - By Country/Sub-region
- 14.1.1 Brazil
- 14.1.2 Argentina
- 14.1.3 Rest of South America
- 15. Middle East and Africa PVA Industry Analysis, Insights and Forecast, 2019-2031
- 15.1. Market Analysis, Insights and Forecast - By Country/Sub-region
- 15.1.1 Saudi Arabia
- 15.1.2 South Africa
- 15.1.3 Rest of Middle East and Africa
- 16. Competitive Analysis
- 16.1. Global Market Share Analysis 2024
- 16.2. Company Profiles
- 16.2.1 Astrra Chemicals
- 16.2.1.1. Overview
- 16.2.1.2. Products
- 16.2.1.3. SWOT Analysis
- 16.2.1.4. Recent Developments
- 16.2.1.5. Financials (Based on Availability)
- 16.2.2 Sekisui Chemical Co Ltd
- 16.2.2.1. Overview
- 16.2.2.2. Products
- 16.2.2.3. SWOT Analysis
- 16.2.2.4. Recent Developments
- 16.2.2.5. Financials (Based on Availability)
- 16.2.3 Merck KGaA
- 16.2.3.1. Overview
- 16.2.3.2. Products
- 16.2.3.3. SWOT Analysis
- 16.2.3.4. Recent Developments
- 16.2.3.5. Financials (Based on Availability)
- 16.2.4 Mitsubishi Chemical Corporation
- 16.2.4.1. Overview
- 16.2.4.2. Products
- 16.2.4.3. SWOT Analysis
- 16.2.4.4. Recent Developments
- 16.2.4.5. Financials (Based on Availability)
- 16.2.5 Chang Chun Group
- 16.2.5.1. Overview
- 16.2.5.2. Products
- 16.2.5.3. SWOT Analysis
- 16.2.5.4. Recent Developments
- 16.2.5.5. Financials (Based on Availability)
- 16.2.6 SNP Inc *List Not Exhaustive
- 16.2.6.1. Overview
- 16.2.6.2. Products
- 16.2.6.3. SWOT Analysis
- 16.2.6.4. Recent Developments
- 16.2.6.5. Financials (Based on Availability)
- 16.2.7 Kemipex
- 16.2.7.1. Overview
- 16.2.7.2. Products
- 16.2.7.3. SWOT Analysis
- 16.2.7.4. Recent Developments
- 16.2.7.5. Financials (Based on Availability)
- 16.2.8 Kuraray Europe GmbH
- 16.2.8.1. Overview
- 16.2.8.2. Products
- 16.2.8.3. SWOT Analysis
- 16.2.8.4. Recent Developments
- 16.2.8.5. Financials (Based on Availability)
- 16.2.9 Anhui Wanwei Group
- 16.2.9.1. Overview
- 16.2.9.2. Products
- 16.2.9.3. SWOT Analysis
- 16.2.9.4. Recent Developments
- 16.2.9.5. Financials (Based on Availability)
- 16.2.10 Japan Vam & Poval Co Ltd
- 16.2.10.1. Overview
- 16.2.10.2. Products
- 16.2.10.3. SWOT Analysis
- 16.2.10.4. Recent Developments
- 16.2.10.5. Financials (Based on Availability)
- 16.2.11 Polysciences Inc
- 16.2.11.1. Overview
- 16.2.11.2. Products
- 16.2.11.3. SWOT Analysis
- 16.2.11.4. Recent Developments
- 16.2.11.5. Financials (Based on Availability)
- 16.2.1 Astrra Chemicals
List of Figures
- Figure 1: Global PVA Industry Revenue Breakdown (Million, %) by Region 2024 & 2032
- Figure 2: Asia Pacific PVA Industry Revenue (Million), by Country 2024 & 2032
- Figure 3: Asia Pacific PVA Industry Revenue Share (%), by Country 2024 & 2032
- Figure 4: North America PVA Industry Revenue (Million), by Country 2024 & 2032
- Figure 5: North America PVA Industry Revenue Share (%), by Country 2024 & 2032
- Figure 6: Europe PVA Industry Revenue (Million), by Country 2024 & 2032
- Figure 7: Europe PVA Industry Revenue Share (%), by Country 2024 & 2032
- Figure 8: South America PVA Industry Revenue (Million), by Country 2024 & 2032
- Figure 9: South America PVA Industry Revenue Share (%), by Country 2024 & 2032
- Figure 10: Middle East and Africa PVA Industry Revenue (Million), by Country 2024 & 2032
- Figure 11: Middle East and Africa PVA Industry Revenue Share (%), by Country 2024 & 2032
- Figure 12: Asia Pacific PVA Industry Revenue (Million), by Grade 2024 & 2032
- Figure 13: Asia Pacific PVA Industry Revenue Share (%), by Grade 2024 & 2032
- Figure 14: Asia Pacific PVA Industry Revenue (Million), by End User 2024 & 2032
- Figure 15: Asia Pacific PVA Industry Revenue Share (%), by End User 2024 & 2032
- Figure 16: Asia Pacific PVA Industry Revenue (Million), by Country 2024 & 2032
- Figure 17: Asia Pacific PVA Industry Revenue Share (%), by Country 2024 & 2032
- Figure 18: North America PVA Industry Revenue (Million), by Grade 2024 & 2032
- Figure 19: North America PVA Industry Revenue Share (%), by Grade 2024 & 2032
- Figure 20: North America PVA Industry Revenue (Million), by End User 2024 & 2032
- Figure 21: North America PVA Industry Revenue Share (%), by End User 2024 & 2032
- Figure 22: North America PVA Industry Revenue (Million), by Country 2024 & 2032
- Figure 23: North America PVA Industry Revenue Share (%), by Country 2024 & 2032
- Figure 24: Europe PVA Industry Revenue (Million), by Grade 2024 & 2032
- Figure 25: Europe PVA Industry Revenue Share (%), by Grade 2024 & 2032
- Figure 26: Europe PVA Industry Revenue (Million), by End User 2024 & 2032
- Figure 27: Europe PVA Industry Revenue Share (%), by End User 2024 & 2032
- Figure 28: Europe PVA Industry Revenue (Million), by Country 2024 & 2032
- Figure 29: Europe PVA Industry Revenue Share (%), by Country 2024 & 2032
- Figure 30: South America PVA Industry Revenue (Million), by Grade 2024 & 2032
- Figure 31: South America PVA Industry Revenue Share (%), by Grade 2024 & 2032
- Figure 32: South America PVA Industry Revenue (Million), by End User 2024 & 2032
- Figure 33: South America PVA Industry Revenue Share (%), by End User 2024 & 2032
- Figure 34: South America PVA Industry Revenue (Million), by Country 2024 & 2032
- Figure 35: South America PVA Industry Revenue Share (%), by Country 2024 & 2032
- Figure 36: Middle East and Africa PVA Industry Revenue (Million), by Grade 2024 & 2032
- Figure 37: Middle East and Africa PVA Industry Revenue Share (%), by Grade 2024 & 2032
- Figure 38: Middle East and Africa PVA Industry Revenue (Million), by End User 2024 & 2032
- Figure 39: Middle East and Africa PVA Industry Revenue Share (%), by End User 2024 & 2032
- Figure 40: Middle East and Africa PVA Industry Revenue (Million), by Country 2024 & 2032
- Figure 41: Middle East and Africa PVA Industry Revenue Share (%), by Country 2024 & 2032
List of Tables
- Table 1: Global PVA Industry Revenue Million Forecast, by Region 2019 & 2032
- Table 2: Global PVA Industry Revenue Million Forecast, by Grade 2019 & 2032
- Table 3: Global PVA Industry Revenue Million Forecast, by End User 2019 & 2032
- Table 4: Global PVA Industry Revenue Million Forecast, by Region 2019 & 2032
- Table 5: Global PVA Industry Revenue Million Forecast, by Country 2019 & 2032
- Table 6: China PVA Industry Revenue (Million) Forecast, by Application 2019 & 2032
- Table 7: India PVA Industry Revenue (Million) Forecast, by Application 2019 & 2032
- Table 8: Japan PVA Industry Revenue (Million) Forecast, by Application 2019 & 2032
- Table 9: South Korea PVA Industry Revenue (Million) Forecast, by Application 2019 & 2032
- Table 10: Rest of Asia Pacific PVA Industry Revenue (Million) Forecast, by Application 2019 & 2032
- Table 11: Global PVA Industry Revenue Million Forecast, by Country 2019 & 2032
- Table 12: United States PVA Industry Revenue (Million) Forecast, by Application 2019 & 2032
- Table 13: Canada PVA Industry Revenue (Million) Forecast, by Application 2019 & 2032
- Table 14: Mexico PVA Industry Revenue (Million) Forecast, by Application 2019 & 2032
- Table 15: Global PVA Industry Revenue Million Forecast, by Country 2019 & 2032
- Table 16: Germany PVA Industry Revenue (Million) Forecast, by Application 2019 & 2032
- Table 17: United Kingdom PVA Industry Revenue (Million) Forecast, by Application 2019 & 2032
- Table 18: Italy PVA Industry Revenue (Million) Forecast, by Application 2019 & 2032
- Table 19: France PVA Industry Revenue (Million) Forecast, by Application 2019 & 2032
- Table 20: Rest of Europe PVA Industry Revenue (Million) Forecast, by Application 2019 & 2032
- Table 21: Global PVA Industry Revenue Million Forecast, by Country 2019 & 2032
- Table 22: Brazil PVA Industry Revenue (Million) Forecast, by Application 2019 & 2032
- Table 23: Argentina PVA Industry Revenue (Million) Forecast, by Application 2019 & 2032
- Table 24: Rest of South America PVA Industry Revenue (Million) Forecast, by Application 2019 & 2032
- Table 25: Global PVA Industry Revenue Million Forecast, by Country 2019 & 2032
- Table 26: Saudi Arabia PVA Industry Revenue (Million) Forecast, by Application 2019 & 2032
- Table 27: South Africa PVA Industry Revenue (Million) Forecast, by Application 2019 & 2032
- Table 28: Rest of Middle East and Africa PVA Industry Revenue (Million) Forecast, by Application 2019 & 2032
- Table 29: Global PVA Industry Revenue Million Forecast, by Grade 2019 & 2032
- Table 30: Global PVA Industry Revenue Million Forecast, by End User 2019 & 2032
- Table 31: Global PVA Industry Revenue Million Forecast, by Country 2019 & 2032
- Table 32: China PVA Industry Revenue (Million) Forecast, by Application 2019 & 2032
- Table 33: India PVA Industry Revenue (Million) Forecast, by Application 2019 & 2032
- Table 34: Japan PVA Industry Revenue (Million) Forecast, by Application 2019 & 2032
- Table 35: South Korea PVA Industry Revenue (Million) Forecast, by Application 2019 & 2032
- Table 36: Rest of Asia Pacific PVA Industry Revenue (Million) Forecast, by Application 2019 & 2032
- Table 37: Global PVA Industry Revenue Million Forecast, by Grade 2019 & 2032
- Table 38: Global PVA Industry Revenue Million Forecast, by End User 2019 & 2032
- Table 39: Global PVA Industry Revenue Million Forecast, by Country 2019 & 2032
- Table 40: United States PVA Industry Revenue (Million) Forecast, by Application 2019 & 2032
- Table 41: Canada PVA Industry Revenue (Million) Forecast, by Application 2019 & 2032
- Table 42: Mexico PVA Industry Revenue (Million) Forecast, by Application 2019 & 2032
- Table 43: Global PVA Industry Revenue Million Forecast, by Grade 2019 & 2032
- Table 44: Global PVA Industry Revenue Million Forecast, by End User 2019 & 2032
- Table 45: Global PVA Industry Revenue Million Forecast, by Country 2019 & 2032
- Table 46: Germany PVA Industry Revenue (Million) Forecast, by Application 2019 & 2032
- Table 47: United Kingdom PVA Industry Revenue (Million) Forecast, by Application 2019 & 2032
- Table 48: Italy PVA Industry Revenue (Million) Forecast, by Application 2019 & 2032
- Table 49: France PVA Industry Revenue (Million) Forecast, by Application 2019 & 2032
- Table 50: Rest of Europe PVA Industry Revenue (Million) Forecast, by Application 2019 & 2032
- Table 51: Global PVA Industry Revenue Million Forecast, by Grade 2019 & 2032
- Table 52: Global PVA Industry Revenue Million Forecast, by End User 2019 & 2032
- Table 53: Global PVA Industry Revenue Million Forecast, by Country 2019 & 2032
- Table 54: Brazil PVA Industry Revenue (Million) Forecast, by Application 2019 & 2032
- Table 55: Argentina PVA Industry Revenue (Million) Forecast, by Application 2019 & 2032
- Table 56: Rest of South America PVA Industry Revenue (Million) Forecast, by Application 2019 & 2032
- Table 57: Global PVA Industry Revenue Million Forecast, by Grade 2019 & 2032
- Table 58: Global PVA Industry Revenue Million Forecast, by End User 2019 & 2032
- Table 59: Global PVA Industry Revenue Million Forecast, by Country 2019 & 2032
- Table 60: Saudi Arabia PVA Industry Revenue (Million) Forecast, by Application 2019 & 2032
- Table 61: South Africa PVA Industry Revenue (Million) Forecast, by Application 2019 & 2032
- Table 62: Rest of Middle East and Africa PVA Industry Revenue (Million) Forecast, by Application 2019 & 2032
Frequently Asked Questions
1. What is the projected Compound Annual Growth Rate (CAGR) of the PVA Industry?
The projected CAGR is approximately > 6.00%.
2. Which companies are prominent players in the PVA Industry?
Key companies in the market include Astrra Chemicals, Sekisui Chemical Co Ltd, Merck KGaA, Mitsubishi Chemical Corporation, Chang Chun Group, SNP Inc *List Not Exhaustive, Kemipex, Kuraray Europe GmbH, Anhui Wanwei Group, Japan Vam & Poval Co Ltd, Polysciences Inc.
3. What are the main segments of the PVA Industry?
The market segments include Grade, End User.
4. Can you provide details about the market size?
The market size is estimated to be USD XX Million as of 2022.
5. What are some drivers contributing to market growth?
Increasing Use in the Construction Industry; Growing Food Packaging Industry.
6. What are the notable trends driving market growth?
Food Packaging to Dominate the Market.
7. Are there any restraints impacting market growth?
Hazardous Health Effects While Manufacturing.
8. Can you provide examples of recent developments in the market?
August 2022: Sekisui Specialty Chemicals (SSC) began the feasibility studies for expanding its Polyvinyl Alcohol (PVOH) supply network to meet the growing needs of its downstream customers. It will increase Sekisui's PVOH capacity by as much as 25%.
9. What pricing options are available for accessing the report?
Pricing options include single-user, multi-user, and enterprise licenses priced at USD 4750, USD 5250, and USD 8750 respectively.
10. Is the market size provided in terms of value or volume?
The market size is provided in terms of value, measured in Million.
11. Are there any specific market keywords associated with the report?
Yes, the market keyword associated with the report is "PVA Industry," which aids in identifying and referencing the specific market segment covered.
12. How do I determine which pricing option suits my needs best?
The pricing options vary based on user requirements and access needs. Individual users may opt for single-user licenses, while businesses requiring broader access may choose multi-user or enterprise licenses for cost-effective access to the report.
13. Are there any additional resources or data provided in the PVA Industry report?
While the report offers comprehensive insights, it's advisable to review the specific contents or supplementary materials provided to ascertain if additional resources or data are available.
14. How can I stay updated on further developments or reports in the PVA Industry?
To stay informed about further developments, trends, and reports in the PVA Industry, consider subscribing to industry newsletters, following relevant companies and organizations, or regularly checking reputable industry news sources and publications.
Methodology
Step 1 - Identification of Relevant Samples Size from Population Database


Step 2 - Approaches for Defining Global Market Size (Value, Volume* & Price*)

Note*: In applicable scenarios
Step 3 - Data Sources
Primary Research
- Web Analytics
- Survey Reports
- Research Institute
- Latest Research Reports
- Opinion Leaders
Secondary Research
- Annual Reports
- White Paper
- Latest Press Release
- Industry Association
- Paid Database
- Investor Presentations

Step 4 - Data Triangulation
Involves using different sources of information in order to increase the validity of a study
These sources are likely to be stakeholders in a program - participants, other researchers, program staff, other community members, and so on.
Then we put all data in single framework & apply various statistical tools to find out the dynamic on the market.
During the analysis stage, feedback from the stakeholder groups would be compared to determine areas of agreement as well as areas of divergence
