

Key Insights
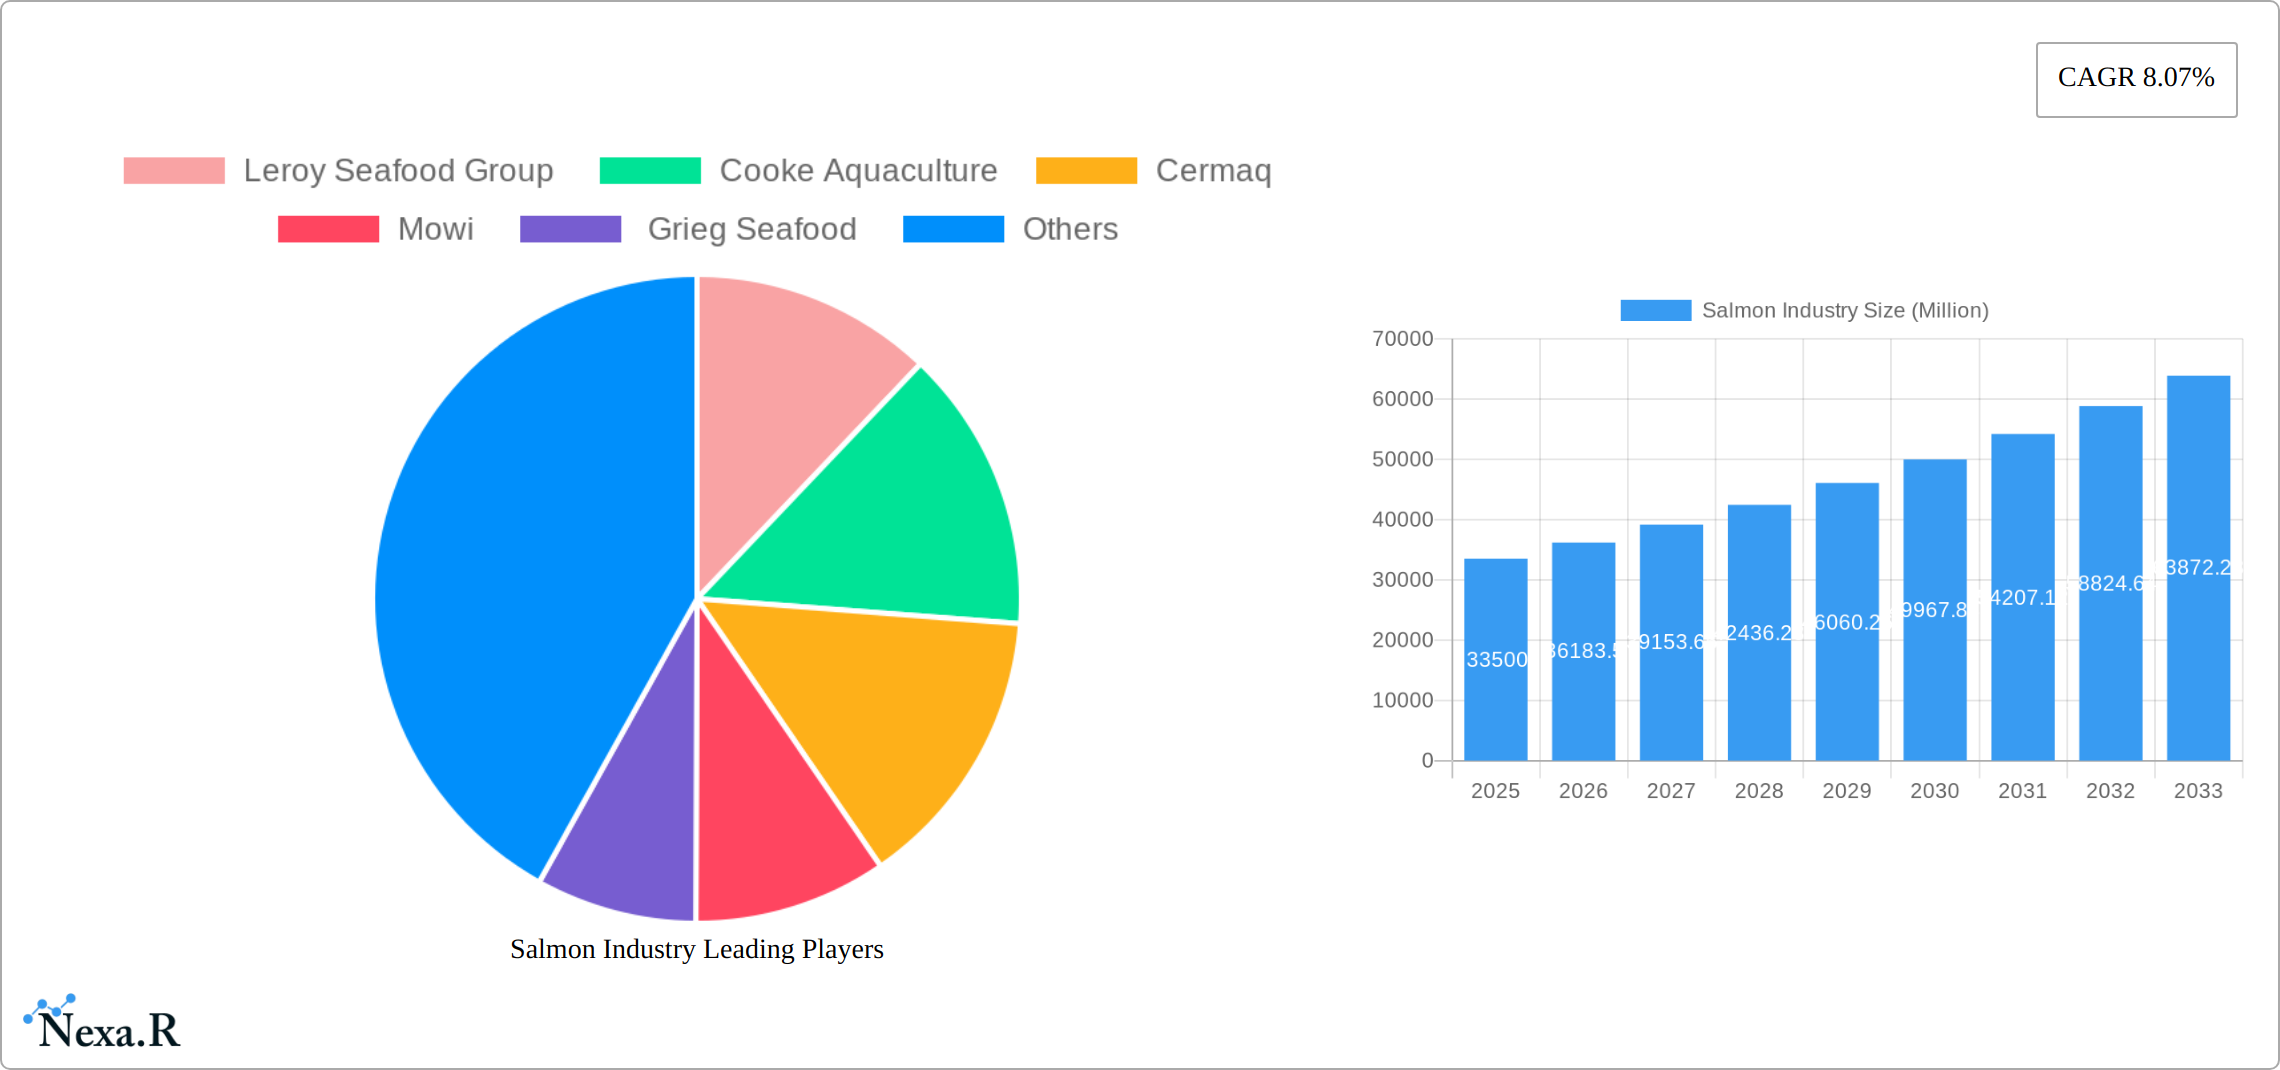
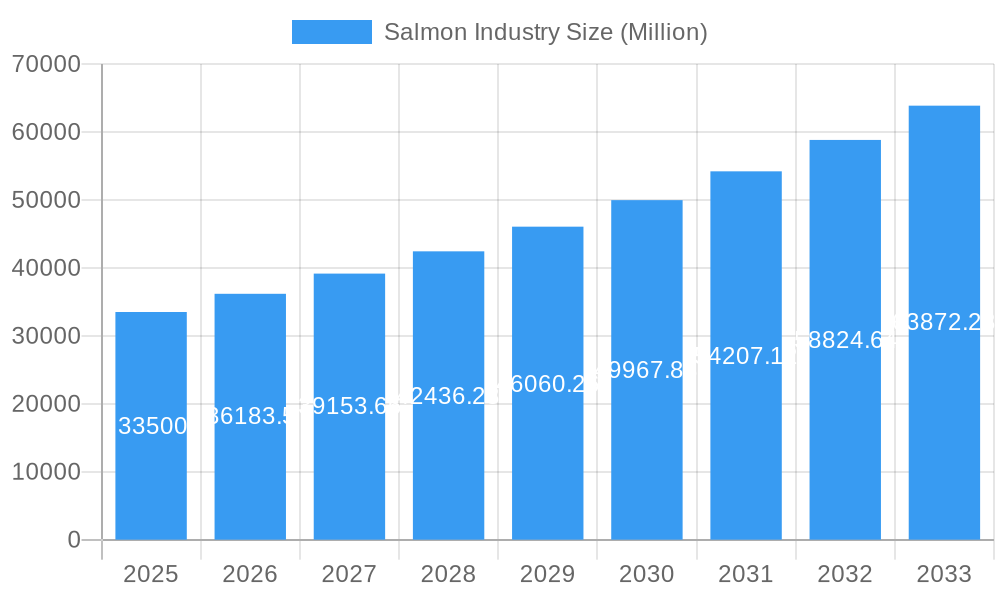
The global salmon industry, valued at $33.5 billion in 2025, is projected to experience robust growth, exhibiting a compound annual growth rate (CAGR) of 8.07% from 2025 to 2033. This expansion is driven by several factors. Increasing consumer demand for healthy, protein-rich seafood fuels market growth, particularly in developed nations with established aquaculture industries and a growing awareness of sustainable food choices. The rising popularity of salmon in diverse culinary applications, from sushi and sashimi to grilled fillets and smoked preparations, further contributes to this demand. Technological advancements in aquaculture practices, such as selective breeding for improved growth rates and disease resistance, are enhancing efficiency and production capacity. Furthermore, growing investment in sustainable aquaculture initiatives, aiming to minimize environmental impact, is bolstering the industry's positive image and consumer confidence.
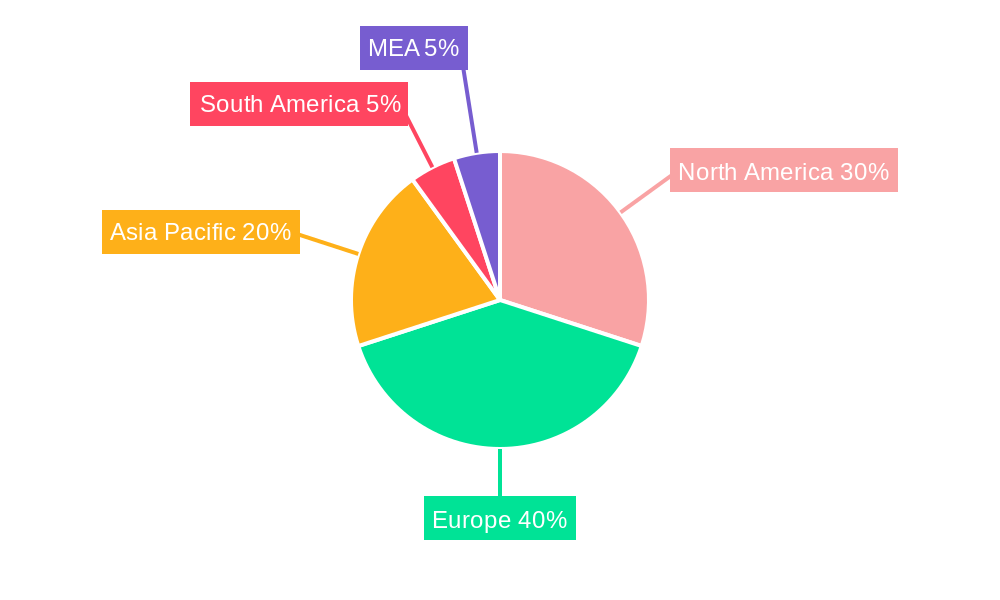
Salmon Industry Market Size (In Billion)
However, challenges remain. Fluctuations in global supply due to factors like disease outbreaks, climate change impacting water temperatures and fish health, and regulatory changes concerning aquaculture practices present potential obstacles to consistent growth. Price volatility linked to feed costs and global economic conditions also impacts profitability. The market is segmented by farming method (farmed vs. wild-caught) and species type (Atlantic Salmon, Coho Salmon, Masu Salmon, Chinook Salmon, and others). Key players like Leroy Seafood Group, Cooke Aquaculture, Cermaq, Mowi, and Grieg Seafood dominate the market, competing on price, quality, and sustainability credentials. Significant regional variations exist, with North America, Europe, and the Asia-Pacific region representing the largest markets, fueled by distinct consumer preferences and economic conditions. Continued innovation in farming techniques and a commitment to sustainability will be crucial for the industry to meet the growing global demand while ensuring environmental responsibility.
Salmon Industry Company Market Share
Comprehensive Salmon Industry Report: 2019-2033
This in-depth report provides a comprehensive analysis of the global salmon industry, encompassing market dynamics, growth trends, regional performance, and key player strategies. Covering the period 2019-2033, with a focus on 2025, this report is an indispensable resource for industry professionals, investors, and stakeholders seeking to understand and navigate this dynamic market.
Salmon Industry Market Dynamics & Structure
The global salmon market, a significant contributor to the seafood industry, is characterized by a moderately concentrated structure. Key global players such as Mowi, Leroy Seafood Group, Cooke Aquaculture, Cermaq, and Grieg Seafood collectively hold a substantial portion of the market share, demonstrating the established presence of leading entities. The industry is in a constant state of evolution, driven by continuous technological innovation. A primary focus is on advancing aquaculture techniques to not only enhance production efficiency but also to bolster sustainability. Stringent regulatory frameworks are a defining aspect of industry operations, encompassing crucial areas like food safety, minimizing environmental impact, and upholding sustainable farming practices. Beyond internal factors, the salmon industry faces competitive pressures from a growing array of substitute protein sources and an ever-changing landscape of consumer preferences, necessitating ongoing adaptation and strategic foresight. The past few years have also witnessed notable mergers and acquisitions (M&A) activity, with numerous deals occurring between 2019 and 2024. These transactions have been primarily propelled by ambitious expansion strategies and a drive for consolidation within the sector, aiming to achieve greater economies of scale and market control.
- Market Concentration: Mowi continues to lead with an estimated xx% market share in 2025, closely followed by Leroy Seafood Group (xx%), Cooke Aquaculture (xx%), Cermaq (xx%), and Grieg Seafood (xx%). These top players underscore the industry's consolidated nature.
- Technological Innovation: The industry is heavily invested in advancements such as Recirculating Aquaculture Systems (RAS) for controlled environments, sophisticated automation in farming and processing, and the development of improved, nutrient-rich feed formulations to optimize growth and health.
- Regulatory Framework: Regulations are becoming increasingly stringent, with a heightened focus on the responsible use of antibiotics, comprehensive environmental impact assessments for new and existing farms, and robust traceability systems from farm to fork.
- Competitive Substitutes: The market faces increasing competition from the rising popularity of plant-based proteins and a diverse range of other seafood options, requiring the industry to highlight its unique benefits.
- End-User Demographics: A significant driver of demand is the growing segment of health-conscious consumers actively seeking nutritious food options, particularly those rich in high-quality protein and beneficial omega-3 fatty acids.
- M&A Trends: Consolidation is anticipated to persist, driven by the pursuit of economies of scale, enhanced market access through strategic acquisitions, and the integration of advanced technologies.
Salmon Industry Growth Trends & Insights
The global salmon market has demonstrated robust growth, exhibiting a Compound Annual Growth Rate (CAGR) of xx% during the historical period spanning 2019 to 2024. This growth culminated in a market valuation of xx Million in 2024. Looking ahead, the market is projected to maintain a steady and sustained growth trajectory throughout the forecast period from 2025 to 2033. This positive outlook is underpinned by a combination of factors, including persistently rising consumer demand for salmon and continuous advancements in aquaculture production capabilities. Technological innovation plays a pivotal role, with systems like RAS and advancements in selective breeding contributing significantly to higher production efficiency, improved product quality, and reduced environmental footprint. Furthermore, a pronounced shift in consumer preferences towards sustainable and traceable seafood is actively reshaping industry dynamics and influencing purchasing decisions. The market penetration of farmed salmon continues its upward trend, increasingly outperforming wild-caught salmon in numerous regional markets due to its reliability and volume.
- Market Size (Million): Reflecting consistent expansion, the market was valued at xx in 2019, reaching xx in 2024, with projections to hit xx in 2025 and a substantial xx by 2033.
- CAGR (2019-2024): The historical growth rate highlights the market's strong performance at xx%.
- CAGR (2025-2033): The projected growth rate indicates continued dynamism and expansion at xx%.
- Market Penetration (Farmed Salmon): Farmed salmon's dominance is evident, holding xx% of the market in 2025 and is forecast to ascend to xx% by 2033, signifying its increasing preference and accessibility.
Dominant Regions, Countries, or Segments in Salmon Industry
Geographically, Norway stands as the undisputed leader in the global farmed salmon production landscape, commanding an impressive approximate xx% of the total global output in 2025. Following Norway are Chile, contributing approximately xx%, and Canada with around xx% of the production share. Within the species market, Atlantic salmon overwhelmingly dominates, accounting for approximately xx% of total salmon production in 2025. This segment's strength is driven by consistently high consumer demand across major markets and well-established, sophisticated farming practices. The farmed salmon segment, in general, holds a significantly larger market share compared to wild-caught salmon. This is primarily attributed to higher, more predictable production volumes and relatively lower operational and market costs, making it a more accessible and consistent supply option for global consumers.
- Key Drivers for Norway's Dominance: Norway's leadership is sustained by its deeply ingrained aquaculture infrastructure, cutting-edge technological adoption, supportive government policies that foster innovation and growth, and a highly experienced and skilled workforce dedicated to the industry.
- Key Drivers for Farmed Salmon Growth: The expansion of farmed salmon is propelled by its inherent production efficiency, cost-effectiveness compared to wild-caught alternatives, and the ability of farmers to exert greater control over supply chains, ensuring consistency and quality.
- Market Share (2025): The leading regions in salmon production for 2025 are Norway (xx%), Chile (xx%), and Canada (xx%).
- Species Market Share (2025): Atlantic Salmon is the clear leader with xx% of the market, followed by Coho Salmon (xx%), Chinook Salmon (xx%), and Other Species collectively representing xx%.
Salmon Industry Product Landscape
The salmon industry offers a diverse and evolving range of products designed to meet various consumer needs and preferences. This includes the staple offerings of fresh, frozen, and smoked salmon, alongside an increasing variety of value-added products such as pre-portioned fillets, steaks, and marinated options. A key focus of ongoing innovation is on elevating product quality, extending shelf life without compromising nutritional value, and enhancing consumer convenience. Technological advancements in processing techniques and modern packaging solutions play a crucial role in maintaining product freshness, preserving taste and texture, and minimizing food waste throughout the supply chain. To capture the attention of discerning consumers, unique selling propositions increasingly emphasize sustainability certifications, transparent traceability from farm to table, and guarantees of product origin, resonating strongly with environmentally and health-conscious buyers.
Key Drivers, Barriers & Challenges in Salmon Industry
Key Drivers: Increasing consumer demand for healthy protein sources, advancements in aquaculture technology, and supportive government policies promoting sustainable aquaculture practices. Growing global middle class and increasing disposable income fuels consumption.
Key Challenges: Fluctuations in feed costs, disease outbreaks, volatile market prices, environmental concerns related to aquaculture, and competition from other protein sources impact profitability and sustainability. Regulatory compliance and securing sustainable sourcing of feed ingredients are also ongoing challenges. Estimated impact of feed cost volatility on profit margins: xx%
Emerging Opportunities in Salmon Industry
Emerging opportunities include expanding into new markets, particularly in Asia and Africa, developing innovative value-added products, and increasing the adoption of sustainable aquaculture practices. Growing demand for convenient and ready-to-eat products presents opportunities for product diversification. Exploring alternative feed sources and reducing the environmental impact of aquaculture will be key for long-term sustainability.
Growth Accelerators in the Salmon Industry
Technological advancements in aquaculture, strategic partnerships between producers and retailers, and market expansion into emerging economies will be key growth drivers for the salmon industry. Investments in sustainable and responsible aquaculture practices to meet increasing consumer demand for transparency and traceability will also boost the market's future growth.
Key Players Shaping the Salmon Industry Market
Notable Milestones in Salmon Industry Sector
- 2020: Introduction of new, more sustainable feed formulations by Mowi.
- 2021: Cooke Aquaculture invests in a large-scale RAS facility in Canada.
- 2022: Leroy Seafood Group acquires a smaller salmon producer in Norway.
- 2023: Significant investments in traceability technology across the industry.
- 2024: New regulations on antibiotic use implemented in several key salmon-producing countries.
In-Depth Salmon Industry Market Outlook
The global salmon market is strongly positioned for continued robust growth in the foreseeable future. This optimism is fueled by a confluence of factors, including sustained and increasing consumer demand for this nutritious and versatile protein, ongoing advancements in aquaculture technology, and a growing global emphasis on sustainability initiatives across all industries. To thrive and succeed in the coming years, companies will need to focus on strategic partnerships, substantial investments in research and development for innovative solutions, and proactive expansion into emerging and untapped markets. Ultimately, the industry's long-term growth trajectory will be significantly shaped by its ability to effectively address environmental concerns, adapt to evolving consumer demands for ethical and sustainable sourcing, and consistently deliver high-quality products that meet the expectations of a global marketplace.
Salmon Industry Segmentation
-
1. Species Type
- 1.1. Atlantic Salmon
- 1.2. Coho Salmon
- 1.3. Masu Salmon
- 1.4. Chinook Salmon
- 1.5. Other Species Types
-
2. Type
- 2.1. Farmed
- 2.2. Wild Captured
-
3. Species Type
- 3.1. Atlantic Salmon
- 3.2. Coho Salmon
- 3.3. Masu Salmon
- 3.4. Chinook Salmon
- 3.5. Other Species Types
-
4. Type
- 4.1. Farmed
- 4.2. Wild Captured
Salmon Industry Segmentation By Geography
-
1. North America
- 1.1. United States
- 1.2. Canada
-
2. Europe
- 2.1. Norway
- 2.2. Spain
- 2.3. Netherlands
- 2.4. France
- 2.5. Italy
- 2.6. Greece
- 2.7. United Kingdom
- 2.8. Scotland
-
3. Asia Pacific
- 3.1. China
- 3.2. Japan
- 3.3. Australia
-
4. South America
- 4.1. Chile
Salmon Industry Regional Market Share
Geographic Coverage of Salmon Industry
Salmon Industry REPORT HIGHLIGHTS
| Aspects | Details |
|---|---|
| Study Period | 2020-2034 |
| Base Year | 2025 |
| Estimated Year | 2026 |
| Forecast Period | 2026-2034 |
| Historical Period | 2020-2025 |
| Growth Rate | CAGR of 8.07% from 2020-2034 |
| Segmentation |
|
Table of Contents
- 1. Introduction
- 1.1. Research Scope
- 1.2. Market Segmentation
- 1.3. Research Methodology
- 1.4. Definitions and Assumptions
- 2. Executive Summary
- 2.1. Introduction
- 3. Market Dynamics
- 3.1. Introduction
- 3.2. Market Drivers
- 3.2.1. ; Awareness About Health Benefits Associated With Pecan Consumption; Wide Application of Pecan
- 3.3. Market Restrains
- 3.3.1. ; Volatility in the Prices; Adverse Weather Conditions Affecting Yield
- 3.4. Market Trends
- 3.4.1. Healthy Boost in the Salmon Production
- 4. Market Factor Analysis
- 4.1. Porters Five Forces
- 4.2. Supply/Value Chain
- 4.3. PESTEL analysis
- 4.4. Market Entropy
- 4.5. Patent/Trademark Analysis
- 5. Global Salmon Industry Analysis, Insights and Forecast, 2020-2032
- 5.1. Market Analysis, Insights and Forecast - by Species Type
- 5.1.1. Atlantic Salmon
- 5.1.2. Coho Salmon
- 5.1.3. Masu Salmon
- 5.1.4. Chinook Salmon
- 5.1.5. Other Species Types
- 5.2. Market Analysis, Insights and Forecast - by Type
- 5.2.1. Farmed
- 5.2.2. Wild Captured
- 5.3. Market Analysis, Insights and Forecast - by Species Type
- 5.3.1. Atlantic Salmon
- 5.3.2. Coho Salmon
- 5.3.3. Masu Salmon
- 5.3.4. Chinook Salmon
- 5.3.5. Other Species Types
- 5.4. Market Analysis, Insights and Forecast - by Type
- 5.4.1. Farmed
- 5.4.2. Wild Captured
- 5.5. Market Analysis, Insights and Forecast - by Region
- 5.5.1. North America
- 5.5.2. Europe
- 5.5.3. Asia Pacific
- 5.5.4. South America
- 5.1. Market Analysis, Insights and Forecast - by Species Type
- 6. North America Salmon Industry Analysis, Insights and Forecast, 2020-2032
- 6.1. Market Analysis, Insights and Forecast - by Species Type
- 6.1.1. Atlantic Salmon
- 6.1.2. Coho Salmon
- 6.1.3. Masu Salmon
- 6.1.4. Chinook Salmon
- 6.1.5. Other Species Types
- 6.2. Market Analysis, Insights and Forecast - by Type
- 6.2.1. Farmed
- 6.2.2. Wild Captured
- 6.3. Market Analysis, Insights and Forecast - by Species Type
- 6.3.1. Atlantic Salmon
- 6.3.2. Coho Salmon
- 6.3.3. Masu Salmon
- 6.3.4. Chinook Salmon
- 6.3.5. Other Species Types
- 6.4. Market Analysis, Insights and Forecast - by Type
- 6.4.1. Farmed
- 6.4.2. Wild Captured
- 6.1. Market Analysis, Insights and Forecast - by Species Type
- 7. Europe Salmon Industry Analysis, Insights and Forecast, 2020-2032
- 7.1. Market Analysis, Insights and Forecast - by Species Type
- 7.1.1. Atlantic Salmon
- 7.1.2. Coho Salmon
- 7.1.3. Masu Salmon
- 7.1.4. Chinook Salmon
- 7.1.5. Other Species Types
- 7.2. Market Analysis, Insights and Forecast - by Type
- 7.2.1. Farmed
- 7.2.2. Wild Captured
- 7.3. Market Analysis, Insights and Forecast - by Species Type
- 7.3.1. Atlantic Salmon
- 7.3.2. Coho Salmon
- 7.3.3. Masu Salmon
- 7.3.4. Chinook Salmon
- 7.3.5. Other Species Types
- 7.4. Market Analysis, Insights and Forecast - by Type
- 7.4.1. Farmed
- 7.4.2. Wild Captured
- 7.1. Market Analysis, Insights and Forecast - by Species Type
- 8. Asia Pacific Salmon Industry Analysis, Insights and Forecast, 2020-2032
- 8.1. Market Analysis, Insights and Forecast - by Species Type
- 8.1.1. Atlantic Salmon
- 8.1.2. Coho Salmon
- 8.1.3. Masu Salmon
- 8.1.4. Chinook Salmon
- 8.1.5. Other Species Types
- 8.2. Market Analysis, Insights and Forecast - by Type
- 8.2.1. Farmed
- 8.2.2. Wild Captured
- 8.3. Market Analysis, Insights and Forecast - by Species Type
- 8.3.1. Atlantic Salmon
- 8.3.2. Coho Salmon
- 8.3.3. Masu Salmon
- 8.3.4. Chinook Salmon
- 8.3.5. Other Species Types
- 8.4. Market Analysis, Insights and Forecast - by Type
- 8.4.1. Farmed
- 8.4.2. Wild Captured
- 8.1. Market Analysis, Insights and Forecast - by Species Type
- 9. South America Salmon Industry Analysis, Insights and Forecast, 2020-2032
- 9.1. Market Analysis, Insights and Forecast - by Species Type
- 9.1.1. Atlantic Salmon
- 9.1.2. Coho Salmon
- 9.1.3. Masu Salmon
- 9.1.4. Chinook Salmon
- 9.1.5. Other Species Types
- 9.2. Market Analysis, Insights and Forecast - by Type
- 9.2.1. Farmed
- 9.2.2. Wild Captured
- 9.3. Market Analysis, Insights and Forecast - by Species Type
- 9.3.1. Atlantic Salmon
- 9.3.2. Coho Salmon
- 9.3.3. Masu Salmon
- 9.3.4. Chinook Salmon
- 9.3.5. Other Species Types
- 9.4. Market Analysis, Insights and Forecast - by Type
- 9.4.1. Farmed
- 9.4.2. Wild Captured
- 9.1. Market Analysis, Insights and Forecast - by Species Type
- 10. Competitive Analysis
- 10.1. Global Market Share Analysis 2025
- 10.2. Company Profiles
- 10.2.1 Leroy Seafood Group
- 10.2.1.1. Overview
- 10.2.1.2. Products
- 10.2.1.3. SWOT Analysis
- 10.2.1.4. Recent Developments
- 10.2.1.5. Financials (Based on Availability)
- 10.2.2 Cooke Aquaculture
- 10.2.2.1. Overview
- 10.2.2.2. Products
- 10.2.2.3. SWOT Analysis
- 10.2.2.4. Recent Developments
- 10.2.2.5. Financials (Based on Availability)
- 10.2.3 Cermaq
- 10.2.3.1. Overview
- 10.2.3.2. Products
- 10.2.3.3. SWOT Analysis
- 10.2.3.4. Recent Developments
- 10.2.3.5. Financials (Based on Availability)
- 10.2.4 Mowi
- 10.2.4.1. Overview
- 10.2.4.2. Products
- 10.2.4.3. SWOT Analysis
- 10.2.4.4. Recent Developments
- 10.2.4.5. Financials (Based on Availability)
- 10.2.5 Grieg Seafood
- 10.2.5.1. Overview
- 10.2.5.2. Products
- 10.2.5.3. SWOT Analysis
- 10.2.5.4. Recent Developments
- 10.2.5.5. Financials (Based on Availability)
- 10.2.1 Leroy Seafood Group
List of Figures
- Figure 1: Global Salmon Industry Revenue Breakdown (Million, %) by Region 2025 & 2033
- Figure 2: North America Salmon Industry Revenue (Million), by Species Type 2025 & 2033
- Figure 3: North America Salmon Industry Revenue Share (%), by Species Type 2025 & 2033
- Figure 4: North America Salmon Industry Revenue (Million), by Type 2025 & 2033
- Figure 5: North America Salmon Industry Revenue Share (%), by Type 2025 & 2033
- Figure 6: North America Salmon Industry Revenue (Million), by Species Type 2025 & 2033
- Figure 7: North America Salmon Industry Revenue Share (%), by Species Type 2025 & 2033
- Figure 8: North America Salmon Industry Revenue (Million), by Type 2025 & 2033
- Figure 9: North America Salmon Industry Revenue Share (%), by Type 2025 & 2033
- Figure 10: North America Salmon Industry Revenue (Million), by Country 2025 & 2033
- Figure 11: North America Salmon Industry Revenue Share (%), by Country 2025 & 2033
- Figure 12: Europe Salmon Industry Revenue (Million), by Species Type 2025 & 2033
- Figure 13: Europe Salmon Industry Revenue Share (%), by Species Type 2025 & 2033
- Figure 14: Europe Salmon Industry Revenue (Million), by Type 2025 & 2033
- Figure 15: Europe Salmon Industry Revenue Share (%), by Type 2025 & 2033
- Figure 16: Europe Salmon Industry Revenue (Million), by Species Type 2025 & 2033
- Figure 17: Europe Salmon Industry Revenue Share (%), by Species Type 2025 & 2033
- Figure 18: Europe Salmon Industry Revenue (Million), by Type 2025 & 2033
- Figure 19: Europe Salmon Industry Revenue Share (%), by Type 2025 & 2033
- Figure 20: Europe Salmon Industry Revenue (Million), by Country 2025 & 2033
- Figure 21: Europe Salmon Industry Revenue Share (%), by Country 2025 & 2033
- Figure 22: Asia Pacific Salmon Industry Revenue (Million), by Species Type 2025 & 2033
- Figure 23: Asia Pacific Salmon Industry Revenue Share (%), by Species Type 2025 & 2033
- Figure 24: Asia Pacific Salmon Industry Revenue (Million), by Type 2025 & 2033
- Figure 25: Asia Pacific Salmon Industry Revenue Share (%), by Type 2025 & 2033
- Figure 26: Asia Pacific Salmon Industry Revenue (Million), by Species Type 2025 & 2033
- Figure 27: Asia Pacific Salmon Industry Revenue Share (%), by Species Type 2025 & 2033
- Figure 28: Asia Pacific Salmon Industry Revenue (Million), by Type 2025 & 2033
- Figure 29: Asia Pacific Salmon Industry Revenue Share (%), by Type 2025 & 2033
- Figure 30: Asia Pacific Salmon Industry Revenue (Million), by Country 2025 & 2033
- Figure 31: Asia Pacific Salmon Industry Revenue Share (%), by Country 2025 & 2033
- Figure 32: South America Salmon Industry Revenue (Million), by Species Type 2025 & 2033
- Figure 33: South America Salmon Industry Revenue Share (%), by Species Type 2025 & 2033
- Figure 34: South America Salmon Industry Revenue (Million), by Type 2025 & 2033
- Figure 35: South America Salmon Industry Revenue Share (%), by Type 2025 & 2033
- Figure 36: South America Salmon Industry Revenue (Million), by Species Type 2025 & 2033
- Figure 37: South America Salmon Industry Revenue Share (%), by Species Type 2025 & 2033
- Figure 38: South America Salmon Industry Revenue (Million), by Type 2025 & 2033
- Figure 39: South America Salmon Industry Revenue Share (%), by Type 2025 & 2033
- Figure 40: South America Salmon Industry Revenue (Million), by Country 2025 & 2033
- Figure 41: South America Salmon Industry Revenue Share (%), by Country 2025 & 2033
List of Tables
- Table 1: Global Salmon Industry Revenue Million Forecast, by Species Type 2020 & 2033
- Table 2: Global Salmon Industry Revenue Million Forecast, by Type 2020 & 2033
- Table 3: Global Salmon Industry Revenue Million Forecast, by Species Type 2020 & 2033
- Table 4: Global Salmon Industry Revenue Million Forecast, by Type 2020 & 2033
- Table 5: Global Salmon Industry Revenue Million Forecast, by Region 2020 & 2033
- Table 6: Global Salmon Industry Revenue Million Forecast, by Species Type 2020 & 2033
- Table 7: Global Salmon Industry Revenue Million Forecast, by Type 2020 & 2033
- Table 8: Global Salmon Industry Revenue Million Forecast, by Species Type 2020 & 2033
- Table 9: Global Salmon Industry Revenue Million Forecast, by Type 2020 & 2033
- Table 10: Global Salmon Industry Revenue Million Forecast, by Country 2020 & 2033
- Table 11: United States Salmon Industry Revenue (Million) Forecast, by Application 2020 & 2033
- Table 12: Canada Salmon Industry Revenue (Million) Forecast, by Application 2020 & 2033
- Table 13: Global Salmon Industry Revenue Million Forecast, by Species Type 2020 & 2033
- Table 14: Global Salmon Industry Revenue Million Forecast, by Type 2020 & 2033
- Table 15: Global Salmon Industry Revenue Million Forecast, by Species Type 2020 & 2033
- Table 16: Global Salmon Industry Revenue Million Forecast, by Type 2020 & 2033
- Table 17: Global Salmon Industry Revenue Million Forecast, by Country 2020 & 2033
- Table 18: Norway Salmon Industry Revenue (Million) Forecast, by Application 2020 & 2033
- Table 19: Spain Salmon Industry Revenue (Million) Forecast, by Application 2020 & 2033
- Table 20: Netherlands Salmon Industry Revenue (Million) Forecast, by Application 2020 & 2033
- Table 21: France Salmon Industry Revenue (Million) Forecast, by Application 2020 & 2033
- Table 22: Italy Salmon Industry Revenue (Million) Forecast, by Application 2020 & 2033
- Table 23: Greece Salmon Industry Revenue (Million) Forecast, by Application 2020 & 2033
- Table 24: United Kingdom Salmon Industry Revenue (Million) Forecast, by Application 2020 & 2033
- Table 25: Scotland Salmon Industry Revenue (Million) Forecast, by Application 2020 & 2033
- Table 26: Global Salmon Industry Revenue Million Forecast, by Species Type 2020 & 2033
- Table 27: Global Salmon Industry Revenue Million Forecast, by Type 2020 & 2033
- Table 28: Global Salmon Industry Revenue Million Forecast, by Species Type 2020 & 2033
- Table 29: Global Salmon Industry Revenue Million Forecast, by Type 2020 & 2033
- Table 30: Global Salmon Industry Revenue Million Forecast, by Country 2020 & 2033
- Table 31: China Salmon Industry Revenue (Million) Forecast, by Application 2020 & 2033
- Table 32: Japan Salmon Industry Revenue (Million) Forecast, by Application 2020 & 2033
- Table 33: Australia Salmon Industry Revenue (Million) Forecast, by Application 2020 & 2033
- Table 34: Global Salmon Industry Revenue Million Forecast, by Species Type 2020 & 2033
- Table 35: Global Salmon Industry Revenue Million Forecast, by Type 2020 & 2033
- Table 36: Global Salmon Industry Revenue Million Forecast, by Species Type 2020 & 2033
- Table 37: Global Salmon Industry Revenue Million Forecast, by Type 2020 & 2033
- Table 38: Global Salmon Industry Revenue Million Forecast, by Country 2020 & 2033
- Table 39: Chile Salmon Industry Revenue (Million) Forecast, by Application 2020 & 2033
Frequently Asked Questions
1. What is the projected Compound Annual Growth Rate (CAGR) of the Salmon Industry?
The projected CAGR is approximately 8.07%.
2. Which companies are prominent players in the Salmon Industry?
Key companies in the market include Leroy Seafood Group , Cooke Aquaculture , Cermaq, Mowi , Grieg Seafood .
3. What are the main segments of the Salmon Industry?
The market segments include Species Type, Type, Species Type, Type.
4. Can you provide details about the market size?
The market size is estimated to be USD 33.50 Million as of 2022.
5. What are some drivers contributing to market growth?
; Awareness About Health Benefits Associated With Pecan Consumption; Wide Application of Pecan.
6. What are the notable trends driving market growth?
Healthy Boost in the Salmon Production.
7. Are there any restraints impacting market growth?
; Volatility in the Prices; Adverse Weather Conditions Affecting Yield.
8. Can you provide examples of recent developments in the market?
N/A
9. What pricing options are available for accessing the report?
Pricing options include single-user, multi-user, and enterprise licenses priced at USD 4750, USD 5250, and USD 8750 respectively.
10. Is the market size provided in terms of value or volume?
The market size is provided in terms of value, measured in Million.
11. Are there any specific market keywords associated with the report?
Yes, the market keyword associated with the report is "Salmon Industry," which aids in identifying and referencing the specific market segment covered.
12. How do I determine which pricing option suits my needs best?
The pricing options vary based on user requirements and access needs. Individual users may opt for single-user licenses, while businesses requiring broader access may choose multi-user or enterprise licenses for cost-effective access to the report.
13. Are there any additional resources or data provided in the Salmon Industry report?
While the report offers comprehensive insights, it's advisable to review the specific contents or supplementary materials provided to ascertain if additional resources or data are available.
14. How can I stay updated on further developments or reports in the Salmon Industry?
To stay informed about further developments, trends, and reports in the Salmon Industry, consider subscribing to industry newsletters, following relevant companies and organizations, or regularly checking reputable industry news sources and publications.
Methodology
Step 1 - Identification of Relevant Samples Size from Population Database


Step 2 - Approaches for Defining Global Market Size (Value, Volume* & Price*)

Note*: In applicable scenarios
Step 3 - Data Sources
Primary Research
- Web Analytics
- Survey Reports
- Research Institute
- Latest Research Reports
- Opinion Leaders
Secondary Research
- Annual Reports
- White Paper
- Latest Press Release
- Industry Association
- Paid Database
- Investor Presentations

Step 4 - Data Triangulation
Involves using different sources of information in order to increase the validity of a study
These sources are likely to be stakeholders in a program - participants, other researchers, program staff, other community members, and so on.
Then we put all data in single framework & apply various statistical tools to find out the dynamic on the market.
During the analysis stage, feedback from the stakeholder groups would be compared to determine areas of agreement as well as areas of divergence