

Key Insights
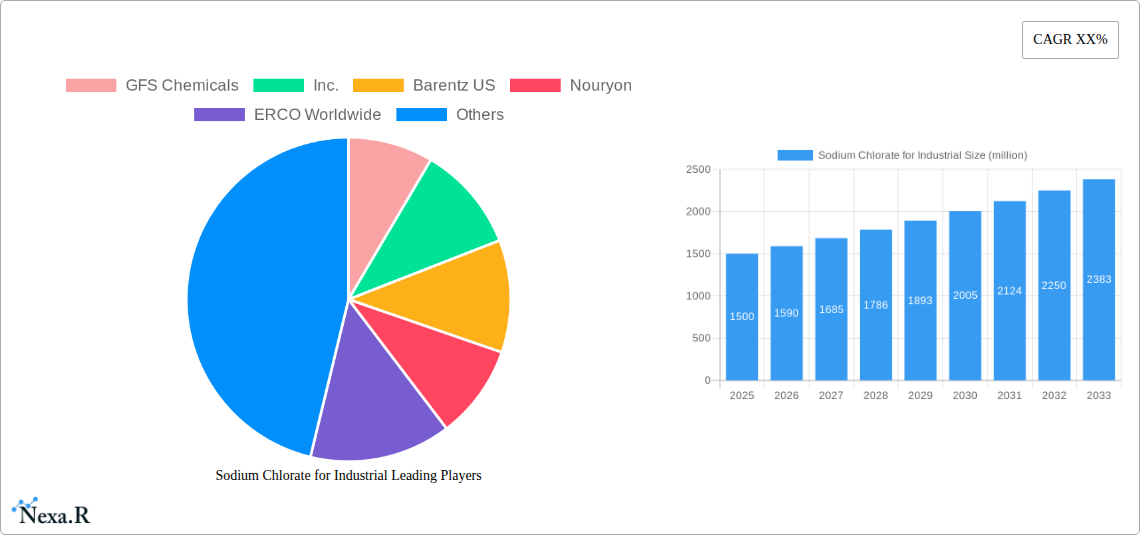
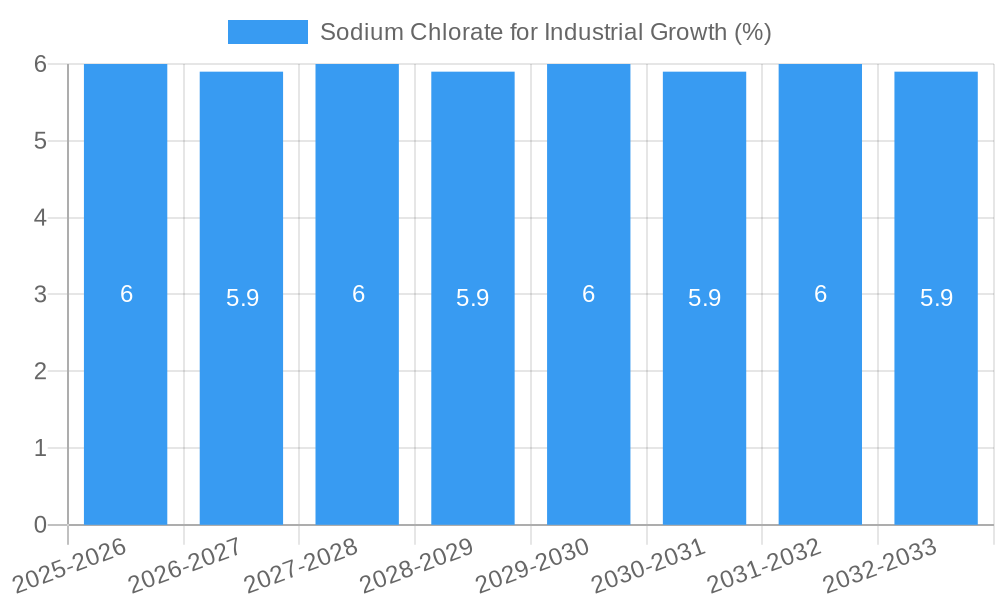
The global Sodium Chlorate for Industrial market is poised for robust expansion, projected to reach an estimated market size of approximately $1,500 million by 2025, with a compound annual growth rate (CAGR) of around 6%. This significant growth trajectory is primarily fueled by the escalating demand from the pulp and paper industry, where sodium chlorate is a crucial bleaching agent. The increasing global consumption of paper products, driven by e-commerce growth and packaging needs, directly translates to higher demand for sodium chlorate. Furthermore, its application in chemical synthesis, particularly for the production of chlorine dioxide, a vital disinfectant and oxidizing agent, is another key growth driver. Emerging economies, with their expanding industrial bases and increasing investments in water treatment and chemical manufacturing, represent significant growth opportunities.
Despite the positive outlook, the market faces certain restraints. Fluctuations in energy prices, as the production of sodium chlorate is energy-intensive, can impact profitability. Stringent environmental regulations concerning the discharge of effluents from production facilities also pose a challenge, necessitating investments in advanced pollution control technologies. However, ongoing technological advancements in production processes, aimed at improving efficiency and reducing environmental impact, are expected to mitigate these challenges. The market is segmented into various applications, with Chemical Synthesis and Papermaking dominating, and also categorized by types, with Type I and Type II holding significant market presence. Key players such as GFS Chemicals, Inc., Nouryon, and ERCO Worldwide are actively engaged in research and development to enhance product offerings and expand their global reach, further shaping the competitive landscape.
Report Title: Global Sodium Chlorate for Industrial Market: Trends, Forecasts, and Opportunities (2019-2033)
Report Description:
This comprehensive report provides an in-depth analysis of the global Sodium Chlorate for Industrial market, a critical component in various industrial applications. Spanning the historical period of 2019-2024 and extending to a detailed forecast through 2033, this study offers unparalleled insights into market dynamics, growth trajectories, and emerging opportunities. With a focus on key segments including Chemical Synthesis, Papermaking, Printing and Dyeing, and Others, alongside product types like Type I and Type II sodium chlorate, this report is an essential resource for stakeholders. We meticulously analyze the market's structure, technological advancements, regulatory landscapes, and competitive environment, providing quantitative data and qualitative assessments. Discover the dominant regions and countries driving growth, understand the product innovations shaping the industry, and identify the key drivers, barriers, and emerging opportunities. This report also highlights significant milestones and the influential players who are actively shaping the future of the Sodium Chlorate for Industrial market. For industry professionals, manufacturers, suppliers, and investors, this report is indispensable for strategic decision-making and navigating the evolving global marketplace.
Sodium Chlorate for Industrial Market Dynamics & Structure
The global Sodium Chlorate for Industrial market exhibits a moderately consolidated structure, with a few key players holding significant market shares. Technological innovation remains a pivotal driver, particularly in enhancing production efficiency and developing safer handling procedures. The primary technological advancements revolve around optimizing electrochemical processes for sodium chlorate production, leading to reduced energy consumption and environmental impact. Regulatory frameworks, especially concerning environmental protection and workplace safety, play a crucial role in market development and can influence production costs and market entry barriers. For instance, stringent regulations on wastewater discharge impact manufacturing processes.
Competitive product substitutes, though not direct replacements for all its core applications, exist in niche areas. However, sodium chlorate's efficacy in pulp bleaching and chemical synthesis often makes it the preferred choice. End-user demographics are largely driven by the health of the paper and pulp industry, alongside demand from chemical manufacturers. Mergers and acquisitions (M&A) activity, while not excessively high, has been observed as companies seek to expand their geographical reach, integrate upstream or downstream operations, and leverage economies of scale.
- Market Concentration: Moderately consolidated with key players dominating production.
- Technological Innovation Drivers: Enhanced production efficiency, reduced energy consumption, improved safety.
- Regulatory Frameworks: Focus on environmental compliance and workplace safety, influencing production costs.
- Competitive Product Substitutes: Limited direct substitutes in core applications; niche alternatives exist.
- End-User Demographics: Primarily driven by paper & pulp and chemical manufacturing sectors.
- M&A Trends: Strategic acquisitions for market expansion and integration.
Sodium Chlorate for Industrial Growth Trends & Insights
The global Sodium Chlorate for Industrial market is projected to witness steady growth over the forecast period. The market size, estimated at approximately $2,500 million in the base year 2025, is anticipated to expand at a Compound Annual Growth Rate (CAGR) of around 3.5% from 2025 to 2033. This growth is underpinned by several key factors, including the sustained demand from the paper and pulp industry, which relies heavily on sodium chlorate for bleaching processes. As global demand for paper products, particularly packaging and tissue, continues to rise, so too will the consumption of sodium chlorate.
Technological disruptions, while not revolutionary, are continuously improving production efficiency and environmental sustainability. Innovations in electrolysis technology are leading to reduced energy costs and lower carbon footprints, making sodium chlorate production more economically viable and environmentally responsible. Consumer behavior shifts, though indirect, also influence this market. For instance, the increasing consumer preference for recycled paper products can impact virgin pulp demand, thereby indirectly affecting sodium chlorate consumption. However, the growth in e-commerce and digital media, which often necessitates paper-based packaging and printed materials, acts as a counterbalancing force.
The adoption rate of sodium chlorate is closely tied to the industrialization and economic development of various regions. Emerging economies, with their expanding manufacturing sectors and growing paper production capacities, represent significant growth opportunities. Furthermore, the application of sodium chlorate in chemical synthesis, for producing various compounds like perchlorates, also contributes to its market expansion. The increasing utilization of these derivatives in specialized applications, such as rocket propellants and explosives, further bolsters demand. Market penetration is already high in developed regions, with growth in these areas primarily driven by efficiency improvements and niche applications.
Dominant Regions, Countries, or Segments in Sodium Chlorate for Industrial
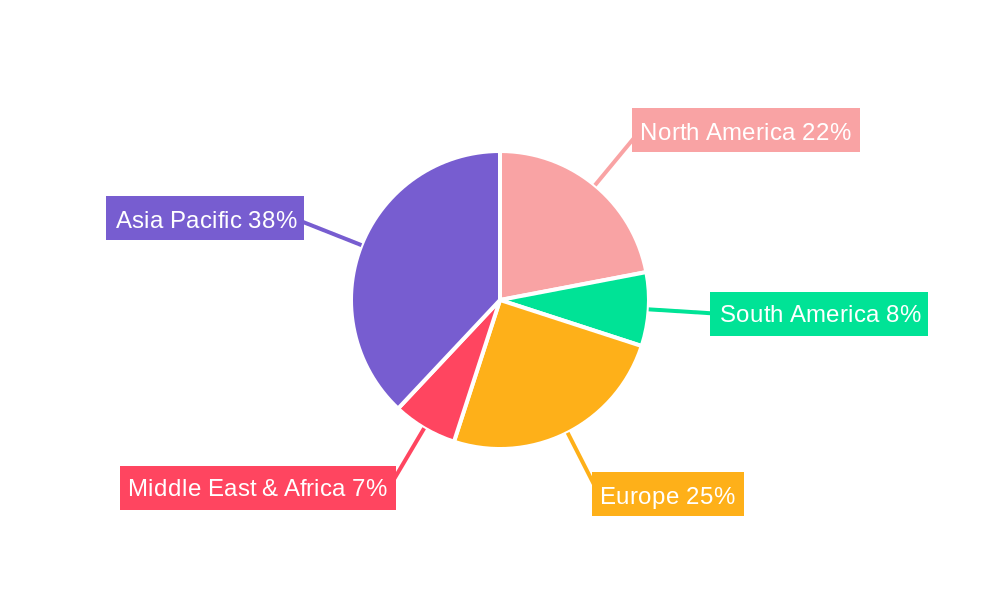
The Papermaking segment is poised to remain the dominant force in the global Sodium Chlorate for Industrial market, driven by its indispensable role in the pulp and paper industry. In the base year of 2025, this segment is estimated to account for over 55% of the total market value, projected at approximately $1,375 million. The Asia-Pacific region, particularly China and Southeast Asian nations, is identified as the leading geographical hub driving this dominance. Strong economic policies supporting industrial growth, coupled with massive investments in pulp and paper manufacturing infrastructure, are key contributors to the region's leading position.
The increasing demand for paper and paperboard products, fueled by a growing population and expanding e-commerce sectors, directly translates into higher consumption of sodium chlorate for bleaching processes. Furthermore, the region's robust manufacturing capabilities and a large domestic market allow for economies of scale in production. The market share of the Papermaking segment is expected to grow at a CAGR of approximately 3.8% from 2025 to 2033, outperforming other application segments.
Within the Papermaking segment, the demand for Type I sodium chlorate is generally higher due to its established efficacy and cost-effectiveness in traditional bleaching methods. However, advancements in bleaching technologies are also leading to increased consideration for Type II in specific, higher-grade pulp production.
Key Drivers for Dominance:
- Asia-Pacific's Economic Policies: Pro-growth industrial policies and significant foreign investment in manufacturing.
- Infrastructure Development: Extensive investments in pulp and paper mills and logistics networks.
- Growing Paper Demand: Rapidly expanding domestic markets for paper and packaging materials.
- Manufacturing Capabilities: Large-scale production facilities offering cost advantages.
- Evolving Consumer Preferences: Increased demand for sustainable packaging and tissue products.
Sodium Chlorate for Industrial Product Landscape
The Sodium Chlorate for Industrial product landscape is characterized by high purity grades and standardized production methods essential for its diverse industrial applications. Type I and Type II sodium chlorate are the primary product categories, differing in their impurity profiles and suitability for specific processes. Innovations in this sector are primarily focused on optimizing the electrochemical production process to enhance purity, reduce energy consumption, and minimize by-product formation. Performance metrics are evaluated based on purity, solubility, and reactivity, which are critical for achieving desired outcomes in chemical synthesis and pulp bleaching. Unique selling propositions often revolve around consistent quality, reliable supply chains, and adherence to stringent safety and environmental standards.
Key Drivers, Barriers & Challenges in Sodium Chlorate for Industrial
Key Drivers:
- Growing Demand from Pulp & Paper Industry: The consistent need for bleaching agents in paper production is a primary growth driver.
- Expanding Chemical Synthesis Applications: Increasing use of sodium chlorate in the production of perchlorates and other industrial chemicals.
- Technological Advancements in Production: Efficiency improvements and cost reductions in electrochemical processes.
- Economic Growth in Emerging Economies: Increased industrialization fuels demand for base chemicals.
Barriers & Challenges:
- Environmental Regulations: Stringent regulations on effluent discharge and energy consumption can increase operational costs.
- Energy Intensity of Production: The electrochemical process is energy-intensive, making it susceptible to fluctuations in energy prices.
- Supply Chain Volatility: Global supply chain disruptions can impact raw material availability and delivery timelines.
- Safety Concerns: Handling and transportation of sodium chlorate require strict safety protocols due to its oxidizing properties.
Emerging Opportunities in Sodium Chlorate for Industrial
Emerging opportunities in the Sodium Chlorate for Industrial market are increasingly leaning towards sustainable production methods and specialized applications. The development of greener electrolysis technologies that consume less energy and produce fewer emissions presents a significant opportunity for manufacturers to differentiate themselves and meet evolving environmental mandates. Furthermore, exploring new applications for sodium chlorate derivatives in niche areas such as advanced materials or specialized water treatment processes could unlock new revenue streams. The growing emphasis on circular economy principles might also lead to innovations in recycling or by-product utilization from sodium chlorate production.
Growth Accelerators in the Sodium Chlorate for Industrial Industry
Growth accelerators in the Sodium Chlorate for Industrial industry are primarily driven by ongoing technological advancements and strategic market expansions. The relentless pursuit of more energy-efficient electrolysis methods not only reduces operational costs but also enhances the environmental profile of sodium chlorate production, making it more attractive to environmentally conscious industries. Strategic partnerships between manufacturers and end-users, particularly in the pulp and paper sector, can lead to tailored product development and more stable demand. Furthermore, the expansion of manufacturing capacities in emerging economies, supported by favorable government policies and growing domestic demand, acts as a significant catalyst for overall market growth.
Key Players Shaping the Sodium Chlorate for Industrial Market
- GFS Chemicals, Inc.
- Barentz US
- Nouryon
- ERCO Worldwide
- Alpure
- Balaji Minechem
- Wego
- Ataman Kimya
- Kanto Chemical
- Junsei Chemical
- Kishida Chemical
Notable Milestones in Sodium Chlorate for Industrial Sector
- 2019: Increased investment in R&D for energy-efficient electrolysis technologies by major manufacturers.
- 2020: Introduction of enhanced safety protocols for sodium chlorate transportation in several key regions.
- 2021: Growing adoption of Type II sodium chlorate in specific niche paper bleaching applications.
- 2022: Emergence of regional supply chain initiatives to mitigate global disruptions.
- 2023: Focus on digitalization and automation in sodium chlorate production facilities to improve efficiency.
- 2024: Increased regulatory scrutiny on environmental impact, driving innovation in waste reduction.
In-Depth Sodium Chlorate for Industrial Market Outlook
The in-depth Sodium Chlorate for Industrial market outlook reveals a promising trajectory fueled by continuous innovation and strategic expansion. Growth accelerators such as advanced, energy-efficient production technologies and collaborative partnerships between suppliers and key industry players are expected to sustain momentum. The increasing adoption of sustainable manufacturing practices will further enhance the market's appeal. Moreover, the expanding industrial base in developing regions presents significant untapped potential for market penetration. Strategic opportunities lie in leveraging these growth drivers to build resilient supply chains and cater to evolving application demands, ensuring continued market expansion and profitability through 2033.
Sodium Chlorate for Industrial Segmentation
-
1. Application
- 1.1. Chemical Synthesis
- 1.2. Papermaking
- 1.3. Printing and Dyeing
- 1.4. Others
-
2. Types
- 2.1. Type I
- 2.2. Type II
Sodium Chlorate for Industrial Segmentation By Geography
-
1. North America
- 1.1. United States
- 1.2. Canada
- 1.3. Mexico
-
2. South America
- 2.1. Brazil
- 2.2. Argentina
- 2.3. Rest of South America
-
3. Europe
- 3.1. United Kingdom
- 3.2. Germany
- 3.3. France
- 3.4. Italy
- 3.5. Spain
- 3.6. Russia
- 3.7. Benelux
- 3.8. Nordics
- 3.9. Rest of Europe
-
4. Middle East & Africa
- 4.1. Turkey
- 4.2. Israel
- 4.3. GCC
- 4.4. North Africa
- 4.5. South Africa
- 4.6. Rest of Middle East & Africa
-
5. Asia Pacific
- 5.1. China
- 5.2. India
- 5.3. Japan
- 5.4. South Korea
- 5.5. ASEAN
- 5.6. Oceania
- 5.7. Rest of Asia Pacific
Sodium Chlorate for Industrial REPORT HIGHLIGHTS
| Aspects | Details |
|---|---|
| Study Period | 2019-2033 |
| Base Year | 2024 |
| Estimated Year | 2025 |
| Forecast Period | 2025-2033 |
| Historical Period | 2019-2024 |
| Growth Rate | CAGR of XX% from 2019-2033 |
| Segmentation |
|
Table of Contents
- 1. Introduction
- 1.1. Research Scope
- 1.2. Market Segmentation
- 1.3. Research Methodology
- 1.4. Definitions and Assumptions
- 2. Executive Summary
- 2.1. Introduction
- 3. Market Dynamics
- 3.1. Introduction
- 3.2. Market Drivers
- 3.3. Market Restrains
- 3.4. Market Trends
- 4. Market Factor Analysis
- 4.1. Porters Five Forces
- 4.2. Supply/Value Chain
- 4.3. PESTEL analysis
- 4.4. Market Entropy
- 4.5. Patent/Trademark Analysis
- 5. Global Sodium Chlorate for Industrial Analysis, Insights and Forecast, 2019-2031
- 5.1. Market Analysis, Insights and Forecast - by Application
- 5.1.1. Chemical Synthesis
- 5.1.2. Papermaking
- 5.1.3. Printing and Dyeing
- 5.1.4. Others
- 5.2. Market Analysis, Insights and Forecast - by Types
- 5.2.1. Type I
- 5.2.2. Type II
- 5.3. Market Analysis, Insights and Forecast - by Region
- 5.3.1. North America
- 5.3.2. South America
- 5.3.3. Europe
- 5.3.4. Middle East & Africa
- 5.3.5. Asia Pacific
- 5.1. Market Analysis, Insights and Forecast - by Application
- 6. North America Sodium Chlorate for Industrial Analysis, Insights and Forecast, 2019-2031
- 6.1. Market Analysis, Insights and Forecast - by Application
- 6.1.1. Chemical Synthesis
- 6.1.2. Papermaking
- 6.1.3. Printing and Dyeing
- 6.1.4. Others
- 6.2. Market Analysis, Insights and Forecast - by Types
- 6.2.1. Type I
- 6.2.2. Type II
- 6.1. Market Analysis, Insights and Forecast - by Application
- 7. South America Sodium Chlorate for Industrial Analysis, Insights and Forecast, 2019-2031
- 7.1. Market Analysis, Insights and Forecast - by Application
- 7.1.1. Chemical Synthesis
- 7.1.2. Papermaking
- 7.1.3. Printing and Dyeing
- 7.1.4. Others
- 7.2. Market Analysis, Insights and Forecast - by Types
- 7.2.1. Type I
- 7.2.2. Type II
- 7.1. Market Analysis, Insights and Forecast - by Application
- 8. Europe Sodium Chlorate for Industrial Analysis, Insights and Forecast, 2019-2031
- 8.1. Market Analysis, Insights and Forecast - by Application
- 8.1.1. Chemical Synthesis
- 8.1.2. Papermaking
- 8.1.3. Printing and Dyeing
- 8.1.4. Others
- 8.2. Market Analysis, Insights and Forecast - by Types
- 8.2.1. Type I
- 8.2.2. Type II
- 8.1. Market Analysis, Insights and Forecast - by Application
- 9. Middle East & Africa Sodium Chlorate for Industrial Analysis, Insights and Forecast, 2019-2031
- 9.1. Market Analysis, Insights and Forecast - by Application
- 9.1.1. Chemical Synthesis
- 9.1.2. Papermaking
- 9.1.3. Printing and Dyeing
- 9.1.4. Others
- 9.2. Market Analysis, Insights and Forecast - by Types
- 9.2.1. Type I
- 9.2.2. Type II
- 9.1. Market Analysis, Insights and Forecast - by Application
- 10. Asia Pacific Sodium Chlorate for Industrial Analysis, Insights and Forecast, 2019-2031
- 10.1. Market Analysis, Insights and Forecast - by Application
- 10.1.1. Chemical Synthesis
- 10.1.2. Papermaking
- 10.1.3. Printing and Dyeing
- 10.1.4. Others
- 10.2. Market Analysis, Insights and Forecast - by Types
- 10.2.1. Type I
- 10.2.2. Type II
- 10.1. Market Analysis, Insights and Forecast - by Application
- 11. Competitive Analysis
- 11.1. Global Market Share Analysis 2024
- 11.2. Company Profiles
- 11.2.1 GFS Chemicals
- 11.2.1.1. Overview
- 11.2.1.2. Products
- 11.2.1.3. SWOT Analysis
- 11.2.1.4. Recent Developments
- 11.2.1.5. Financials (Based on Availability)
- 11.2.2 Inc.
- 11.2.2.1. Overview
- 11.2.2.2. Products
- 11.2.2.3. SWOT Analysis
- 11.2.2.4. Recent Developments
- 11.2.2.5. Financials (Based on Availability)
- 11.2.3 Barentz US
- 11.2.3.1. Overview
- 11.2.3.2. Products
- 11.2.3.3. SWOT Analysis
- 11.2.3.4. Recent Developments
- 11.2.3.5. Financials (Based on Availability)
- 11.2.4 Nouryon
- 11.2.4.1. Overview
- 11.2.4.2. Products
- 11.2.4.3. SWOT Analysis
- 11.2.4.4. Recent Developments
- 11.2.4.5. Financials (Based on Availability)
- 11.2.5 ERCO Worldwide
- 11.2.5.1. Overview
- 11.2.5.2. Products
- 11.2.5.3. SWOT Analysis
- 11.2.5.4. Recent Developments
- 11.2.5.5. Financials (Based on Availability)
- 11.2.6 Alpure
- 11.2.6.1. Overview
- 11.2.6.2. Products
- 11.2.6.3. SWOT Analysis
- 11.2.6.4. Recent Developments
- 11.2.6.5. Financials (Based on Availability)
- 11.2.7 Balaji Minechem
- 11.2.7.1. Overview
- 11.2.7.2. Products
- 11.2.7.3. SWOT Analysis
- 11.2.7.4. Recent Developments
- 11.2.7.5. Financials (Based on Availability)
- 11.2.8 Wego
- 11.2.8.1. Overview
- 11.2.8.2. Products
- 11.2.8.3. SWOT Analysis
- 11.2.8.4. Recent Developments
- 11.2.8.5. Financials (Based on Availability)
- 11.2.9 Ataman Kimya
- 11.2.9.1. Overview
- 11.2.9.2. Products
- 11.2.9.3. SWOT Analysis
- 11.2.9.4. Recent Developments
- 11.2.9.5. Financials (Based on Availability)
- 11.2.10 Kanto Chemical
- 11.2.10.1. Overview
- 11.2.10.2. Products
- 11.2.10.3. SWOT Analysis
- 11.2.10.4. Recent Developments
- 11.2.10.5. Financials (Based on Availability)
- 11.2.11 Junsei Chemical
- 11.2.11.1. Overview
- 11.2.11.2. Products
- 11.2.11.3. SWOT Analysis
- 11.2.11.4. Recent Developments
- 11.2.11.5. Financials (Based on Availability)
- 11.2.12 Kishida Chemical
- 11.2.12.1. Overview
- 11.2.12.2. Products
- 11.2.12.3. SWOT Analysis
- 11.2.12.4. Recent Developments
- 11.2.12.5. Financials (Based on Availability)
- 11.2.1 GFS Chemicals
List of Figures
- Figure 1: Global Sodium Chlorate for Industrial Revenue Breakdown (million, %) by Region 2024 & 2032
- Figure 2: Global Sodium Chlorate for Industrial Volume Breakdown (K, %) by Region 2024 & 2032
- Figure 3: North America Sodium Chlorate for Industrial Revenue (million), by Application 2024 & 2032
- Figure 4: North America Sodium Chlorate for Industrial Volume (K), by Application 2024 & 2032
- Figure 5: North America Sodium Chlorate for Industrial Revenue Share (%), by Application 2024 & 2032
- Figure 6: North America Sodium Chlorate for Industrial Volume Share (%), by Application 2024 & 2032
- Figure 7: North America Sodium Chlorate for Industrial Revenue (million), by Types 2024 & 2032
- Figure 8: North America Sodium Chlorate for Industrial Volume (K), by Types 2024 & 2032
- Figure 9: North America Sodium Chlorate for Industrial Revenue Share (%), by Types 2024 & 2032
- Figure 10: North America Sodium Chlorate for Industrial Volume Share (%), by Types 2024 & 2032
- Figure 11: North America Sodium Chlorate for Industrial Revenue (million), by Country 2024 & 2032
- Figure 12: North America Sodium Chlorate for Industrial Volume (K), by Country 2024 & 2032
- Figure 13: North America Sodium Chlorate for Industrial Revenue Share (%), by Country 2024 & 2032
- Figure 14: North America Sodium Chlorate for Industrial Volume Share (%), by Country 2024 & 2032
- Figure 15: South America Sodium Chlorate for Industrial Revenue (million), by Application 2024 & 2032
- Figure 16: South America Sodium Chlorate for Industrial Volume (K), by Application 2024 & 2032
- Figure 17: South America Sodium Chlorate for Industrial Revenue Share (%), by Application 2024 & 2032
- Figure 18: South America Sodium Chlorate for Industrial Volume Share (%), by Application 2024 & 2032
- Figure 19: South America Sodium Chlorate for Industrial Revenue (million), by Types 2024 & 2032
- Figure 20: South America Sodium Chlorate for Industrial Volume (K), by Types 2024 & 2032
- Figure 21: South America Sodium Chlorate for Industrial Revenue Share (%), by Types 2024 & 2032
- Figure 22: South America Sodium Chlorate for Industrial Volume Share (%), by Types 2024 & 2032
- Figure 23: South America Sodium Chlorate for Industrial Revenue (million), by Country 2024 & 2032
- Figure 24: South America Sodium Chlorate for Industrial Volume (K), by Country 2024 & 2032
- Figure 25: South America Sodium Chlorate for Industrial Revenue Share (%), by Country 2024 & 2032
- Figure 26: South America Sodium Chlorate for Industrial Volume Share (%), by Country 2024 & 2032
- Figure 27: Europe Sodium Chlorate for Industrial Revenue (million), by Application 2024 & 2032
- Figure 28: Europe Sodium Chlorate for Industrial Volume (K), by Application 2024 & 2032
- Figure 29: Europe Sodium Chlorate for Industrial Revenue Share (%), by Application 2024 & 2032
- Figure 30: Europe Sodium Chlorate for Industrial Volume Share (%), by Application 2024 & 2032
- Figure 31: Europe Sodium Chlorate for Industrial Revenue (million), by Types 2024 & 2032
- Figure 32: Europe Sodium Chlorate for Industrial Volume (K), by Types 2024 & 2032
- Figure 33: Europe Sodium Chlorate for Industrial Revenue Share (%), by Types 2024 & 2032
- Figure 34: Europe Sodium Chlorate for Industrial Volume Share (%), by Types 2024 & 2032
- Figure 35: Europe Sodium Chlorate for Industrial Revenue (million), by Country 2024 & 2032
- Figure 36: Europe Sodium Chlorate for Industrial Volume (K), by Country 2024 & 2032
- Figure 37: Europe Sodium Chlorate for Industrial Revenue Share (%), by Country 2024 & 2032
- Figure 38: Europe Sodium Chlorate for Industrial Volume Share (%), by Country 2024 & 2032
- Figure 39: Middle East & Africa Sodium Chlorate for Industrial Revenue (million), by Application 2024 & 2032
- Figure 40: Middle East & Africa Sodium Chlorate for Industrial Volume (K), by Application 2024 & 2032
- Figure 41: Middle East & Africa Sodium Chlorate for Industrial Revenue Share (%), by Application 2024 & 2032
- Figure 42: Middle East & Africa Sodium Chlorate for Industrial Volume Share (%), by Application 2024 & 2032
- Figure 43: Middle East & Africa Sodium Chlorate for Industrial Revenue (million), by Types 2024 & 2032
- Figure 44: Middle East & Africa Sodium Chlorate for Industrial Volume (K), by Types 2024 & 2032
- Figure 45: Middle East & Africa Sodium Chlorate for Industrial Revenue Share (%), by Types 2024 & 2032
- Figure 46: Middle East & Africa Sodium Chlorate for Industrial Volume Share (%), by Types 2024 & 2032
- Figure 47: Middle East & Africa Sodium Chlorate for Industrial Revenue (million), by Country 2024 & 2032
- Figure 48: Middle East & Africa Sodium Chlorate for Industrial Volume (K), by Country 2024 & 2032
- Figure 49: Middle East & Africa Sodium Chlorate for Industrial Revenue Share (%), by Country 2024 & 2032
- Figure 50: Middle East & Africa Sodium Chlorate for Industrial Volume Share (%), by Country 2024 & 2032
- Figure 51: Asia Pacific Sodium Chlorate for Industrial Revenue (million), by Application 2024 & 2032
- Figure 52: Asia Pacific Sodium Chlorate for Industrial Volume (K), by Application 2024 & 2032
- Figure 53: Asia Pacific Sodium Chlorate for Industrial Revenue Share (%), by Application 2024 & 2032
- Figure 54: Asia Pacific Sodium Chlorate for Industrial Volume Share (%), by Application 2024 & 2032
- Figure 55: Asia Pacific Sodium Chlorate for Industrial Revenue (million), by Types 2024 & 2032
- Figure 56: Asia Pacific Sodium Chlorate for Industrial Volume (K), by Types 2024 & 2032
- Figure 57: Asia Pacific Sodium Chlorate for Industrial Revenue Share (%), by Types 2024 & 2032
- Figure 58: Asia Pacific Sodium Chlorate for Industrial Volume Share (%), by Types 2024 & 2032
- Figure 59: Asia Pacific Sodium Chlorate for Industrial Revenue (million), by Country 2024 & 2032
- Figure 60: Asia Pacific Sodium Chlorate for Industrial Volume (K), by Country 2024 & 2032
- Figure 61: Asia Pacific Sodium Chlorate for Industrial Revenue Share (%), by Country 2024 & 2032
- Figure 62: Asia Pacific Sodium Chlorate for Industrial Volume Share (%), by Country 2024 & 2032
List of Tables
- Table 1: Global Sodium Chlorate for Industrial Revenue million Forecast, by Region 2019 & 2032
- Table 2: Global Sodium Chlorate for Industrial Volume K Forecast, by Region 2019 & 2032
- Table 3: Global Sodium Chlorate for Industrial Revenue million Forecast, by Application 2019 & 2032
- Table 4: Global Sodium Chlorate for Industrial Volume K Forecast, by Application 2019 & 2032
- Table 5: Global Sodium Chlorate for Industrial Revenue million Forecast, by Types 2019 & 2032
- Table 6: Global Sodium Chlorate for Industrial Volume K Forecast, by Types 2019 & 2032
- Table 7: Global Sodium Chlorate for Industrial Revenue million Forecast, by Region 2019 & 2032
- Table 8: Global Sodium Chlorate for Industrial Volume K Forecast, by Region 2019 & 2032
- Table 9: Global Sodium Chlorate for Industrial Revenue million Forecast, by Application 2019 & 2032
- Table 10: Global Sodium Chlorate for Industrial Volume K Forecast, by Application 2019 & 2032
- Table 11: Global Sodium Chlorate for Industrial Revenue million Forecast, by Types 2019 & 2032
- Table 12: Global Sodium Chlorate for Industrial Volume K Forecast, by Types 2019 & 2032
- Table 13: Global Sodium Chlorate for Industrial Revenue million Forecast, by Country 2019 & 2032
- Table 14: Global Sodium Chlorate for Industrial Volume K Forecast, by Country 2019 & 2032
- Table 15: United States Sodium Chlorate for Industrial Revenue (million) Forecast, by Application 2019 & 2032
- Table 16: United States Sodium Chlorate for Industrial Volume (K) Forecast, by Application 2019 & 2032
- Table 17: Canada Sodium Chlorate for Industrial Revenue (million) Forecast, by Application 2019 & 2032
- Table 18: Canada Sodium Chlorate for Industrial Volume (K) Forecast, by Application 2019 & 2032
- Table 19: Mexico Sodium Chlorate for Industrial Revenue (million) Forecast, by Application 2019 & 2032
- Table 20: Mexico Sodium Chlorate for Industrial Volume (K) Forecast, by Application 2019 & 2032
- Table 21: Global Sodium Chlorate for Industrial Revenue million Forecast, by Application 2019 & 2032
- Table 22: Global Sodium Chlorate for Industrial Volume K Forecast, by Application 2019 & 2032
- Table 23: Global Sodium Chlorate for Industrial Revenue million Forecast, by Types 2019 & 2032
- Table 24: Global Sodium Chlorate for Industrial Volume K Forecast, by Types 2019 & 2032
- Table 25: Global Sodium Chlorate for Industrial Revenue million Forecast, by Country 2019 & 2032
- Table 26: Global Sodium Chlorate for Industrial Volume K Forecast, by Country 2019 & 2032
- Table 27: Brazil Sodium Chlorate for Industrial Revenue (million) Forecast, by Application 2019 & 2032
- Table 28: Brazil Sodium Chlorate for Industrial Volume (K) Forecast, by Application 2019 & 2032
- Table 29: Argentina Sodium Chlorate for Industrial Revenue (million) Forecast, by Application 2019 & 2032
- Table 30: Argentina Sodium Chlorate for Industrial Volume (K) Forecast, by Application 2019 & 2032
- Table 31: Rest of South America Sodium Chlorate for Industrial Revenue (million) Forecast, by Application 2019 & 2032
- Table 32: Rest of South America Sodium Chlorate for Industrial Volume (K) Forecast, by Application 2019 & 2032
- Table 33: Global Sodium Chlorate for Industrial Revenue million Forecast, by Application 2019 & 2032
- Table 34: Global Sodium Chlorate for Industrial Volume K Forecast, by Application 2019 & 2032
- Table 35: Global Sodium Chlorate for Industrial Revenue million Forecast, by Types 2019 & 2032
- Table 36: Global Sodium Chlorate for Industrial Volume K Forecast, by Types 2019 & 2032
- Table 37: Global Sodium Chlorate for Industrial Revenue million Forecast, by Country 2019 & 2032
- Table 38: Global Sodium Chlorate for Industrial Volume K Forecast, by Country 2019 & 2032
- Table 39: United Kingdom Sodium Chlorate for Industrial Revenue (million) Forecast, by Application 2019 & 2032
- Table 40: United Kingdom Sodium Chlorate for Industrial Volume (K) Forecast, by Application 2019 & 2032
- Table 41: Germany Sodium Chlorate for Industrial Revenue (million) Forecast, by Application 2019 & 2032
- Table 42: Germany Sodium Chlorate for Industrial Volume (K) Forecast, by Application 2019 & 2032
- Table 43: France Sodium Chlorate for Industrial Revenue (million) Forecast, by Application 2019 & 2032
- Table 44: France Sodium Chlorate for Industrial Volume (K) Forecast, by Application 2019 & 2032
- Table 45: Italy Sodium Chlorate for Industrial Revenue (million) Forecast, by Application 2019 & 2032
- Table 46: Italy Sodium Chlorate for Industrial Volume (K) Forecast, by Application 2019 & 2032
- Table 47: Spain Sodium Chlorate for Industrial Revenue (million) Forecast, by Application 2019 & 2032
- Table 48: Spain Sodium Chlorate for Industrial Volume (K) Forecast, by Application 2019 & 2032
- Table 49: Russia Sodium Chlorate for Industrial Revenue (million) Forecast, by Application 2019 & 2032
- Table 50: Russia Sodium Chlorate for Industrial Volume (K) Forecast, by Application 2019 & 2032
- Table 51: Benelux Sodium Chlorate for Industrial Revenue (million) Forecast, by Application 2019 & 2032
- Table 52: Benelux Sodium Chlorate for Industrial Volume (K) Forecast, by Application 2019 & 2032
- Table 53: Nordics Sodium Chlorate for Industrial Revenue (million) Forecast, by Application 2019 & 2032
- Table 54: Nordics Sodium Chlorate for Industrial Volume (K) Forecast, by Application 2019 & 2032
- Table 55: Rest of Europe Sodium Chlorate for Industrial Revenue (million) Forecast, by Application 2019 & 2032
- Table 56: Rest of Europe Sodium Chlorate for Industrial Volume (K) Forecast, by Application 2019 & 2032
- Table 57: Global Sodium Chlorate for Industrial Revenue million Forecast, by Application 2019 & 2032
- Table 58: Global Sodium Chlorate for Industrial Volume K Forecast, by Application 2019 & 2032
- Table 59: Global Sodium Chlorate for Industrial Revenue million Forecast, by Types 2019 & 2032
- Table 60: Global Sodium Chlorate for Industrial Volume K Forecast, by Types 2019 & 2032
- Table 61: Global Sodium Chlorate for Industrial Revenue million Forecast, by Country 2019 & 2032
- Table 62: Global Sodium Chlorate for Industrial Volume K Forecast, by Country 2019 & 2032
- Table 63: Turkey Sodium Chlorate for Industrial Revenue (million) Forecast, by Application 2019 & 2032
- Table 64: Turkey Sodium Chlorate for Industrial Volume (K) Forecast, by Application 2019 & 2032
- Table 65: Israel Sodium Chlorate for Industrial Revenue (million) Forecast, by Application 2019 & 2032
- Table 66: Israel Sodium Chlorate for Industrial Volume (K) Forecast, by Application 2019 & 2032
- Table 67: GCC Sodium Chlorate for Industrial Revenue (million) Forecast, by Application 2019 & 2032
- Table 68: GCC Sodium Chlorate for Industrial Volume (K) Forecast, by Application 2019 & 2032
- Table 69: North Africa Sodium Chlorate for Industrial Revenue (million) Forecast, by Application 2019 & 2032
- Table 70: North Africa Sodium Chlorate for Industrial Volume (K) Forecast, by Application 2019 & 2032
- Table 71: South Africa Sodium Chlorate for Industrial Revenue (million) Forecast, by Application 2019 & 2032
- Table 72: South Africa Sodium Chlorate for Industrial Volume (K) Forecast, by Application 2019 & 2032
- Table 73: Rest of Middle East & Africa Sodium Chlorate for Industrial Revenue (million) Forecast, by Application 2019 & 2032
- Table 74: Rest of Middle East & Africa Sodium Chlorate for Industrial Volume (K) Forecast, by Application 2019 & 2032
- Table 75: Global Sodium Chlorate for Industrial Revenue million Forecast, by Application 2019 & 2032
- Table 76: Global Sodium Chlorate for Industrial Volume K Forecast, by Application 2019 & 2032
- Table 77: Global Sodium Chlorate for Industrial Revenue million Forecast, by Types 2019 & 2032
- Table 78: Global Sodium Chlorate for Industrial Volume K Forecast, by Types 2019 & 2032
- Table 79: Global Sodium Chlorate for Industrial Revenue million Forecast, by Country 2019 & 2032
- Table 80: Global Sodium Chlorate for Industrial Volume K Forecast, by Country 2019 & 2032
- Table 81: China Sodium Chlorate for Industrial Revenue (million) Forecast, by Application 2019 & 2032
- Table 82: China Sodium Chlorate for Industrial Volume (K) Forecast, by Application 2019 & 2032
- Table 83: India Sodium Chlorate for Industrial Revenue (million) Forecast, by Application 2019 & 2032
- Table 84: India Sodium Chlorate for Industrial Volume (K) Forecast, by Application 2019 & 2032
- Table 85: Japan Sodium Chlorate for Industrial Revenue (million) Forecast, by Application 2019 & 2032
- Table 86: Japan Sodium Chlorate for Industrial Volume (K) Forecast, by Application 2019 & 2032
- Table 87: South Korea Sodium Chlorate for Industrial Revenue (million) Forecast, by Application 2019 & 2032
- Table 88: South Korea Sodium Chlorate for Industrial Volume (K) Forecast, by Application 2019 & 2032
- Table 89: ASEAN Sodium Chlorate for Industrial Revenue (million) Forecast, by Application 2019 & 2032
- Table 90: ASEAN Sodium Chlorate for Industrial Volume (K) Forecast, by Application 2019 & 2032
- Table 91: Oceania Sodium Chlorate for Industrial Revenue (million) Forecast, by Application 2019 & 2032
- Table 92: Oceania Sodium Chlorate for Industrial Volume (K) Forecast, by Application 2019 & 2032
- Table 93: Rest of Asia Pacific Sodium Chlorate for Industrial Revenue (million) Forecast, by Application 2019 & 2032
- Table 94: Rest of Asia Pacific Sodium Chlorate for Industrial Volume (K) Forecast, by Application 2019 & 2032
Frequently Asked Questions
1. What is the projected Compound Annual Growth Rate (CAGR) of the Sodium Chlorate for Industrial?
The projected CAGR is approximately XX%.
2. Which companies are prominent players in the Sodium Chlorate for Industrial?
Key companies in the market include GFS Chemicals, Inc., Barentz US, Nouryon, ERCO Worldwide, Alpure, Balaji Minechem, Wego, Ataman Kimya, Kanto Chemical, Junsei Chemical, Kishida Chemical.
3. What are the main segments of the Sodium Chlorate for Industrial?
The market segments include Application, Types.
4. Can you provide details about the market size?
The market size is estimated to be USD XXX million as of 2022.
5. What are some drivers contributing to market growth?
N/A
6. What are the notable trends driving market growth?
N/A
7. Are there any restraints impacting market growth?
N/A
8. Can you provide examples of recent developments in the market?
N/A
9. What pricing options are available for accessing the report?
Pricing options include single-user, multi-user, and enterprise licenses priced at USD 3950.00, USD 5925.00, and USD 7900.00 respectively.
10. Is the market size provided in terms of value or volume?
The market size is provided in terms of value, measured in million and volume, measured in K.
11. Are there any specific market keywords associated with the report?
Yes, the market keyword associated with the report is "Sodium Chlorate for Industrial," which aids in identifying and referencing the specific market segment covered.
12. How do I determine which pricing option suits my needs best?
The pricing options vary based on user requirements and access needs. Individual users may opt for single-user licenses, while businesses requiring broader access may choose multi-user or enterprise licenses for cost-effective access to the report.
13. Are there any additional resources or data provided in the Sodium Chlorate for Industrial report?
While the report offers comprehensive insights, it's advisable to review the specific contents or supplementary materials provided to ascertain if additional resources or data are available.
14. How can I stay updated on further developments or reports in the Sodium Chlorate for Industrial?
To stay informed about further developments, trends, and reports in the Sodium Chlorate for Industrial, consider subscribing to industry newsletters, following relevant companies and organizations, or regularly checking reputable industry news sources and publications.
Methodology
Step 1 - Identification of Relevant Samples Size from Population Database


Step 2 - Approaches for Defining Global Market Size (Value, Volume* & Price*)

Note*: In applicable scenarios
Step 3 - Data Sources
Primary Research
- Web Analytics
- Survey Reports
- Research Institute
- Latest Research Reports
- Opinion Leaders
Secondary Research
- Annual Reports
- White Paper
- Latest Press Release
- Industry Association
- Paid Database
- Investor Presentations

Step 4 - Data Triangulation
Involves using different sources of information in order to increase the validity of a study
These sources are likely to be stakeholders in a program - participants, other researchers, program staff, other community members, and so on.
Then we put all data in single framework & apply various statistical tools to find out the dynamic on the market.
During the analysis stage, feedback from the stakeholder groups would be compared to determine areas of agreement as well as areas of divergence
