

Key Insights
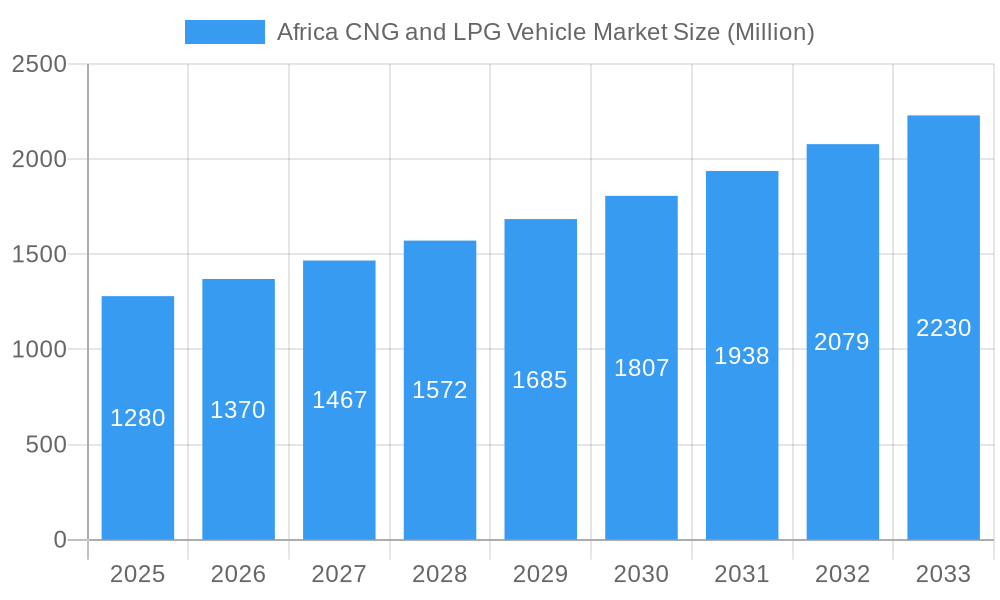
The Africa CNG and LPG vehicle market presents a significant growth opportunity, projected to reach a market size of $1.28 billion in 2025 and exhibit a Compound Annual Growth Rate (CAGR) of 6.78% from 2025 to 2033. This expansion is driven by several key factors. Firstly, increasing fuel prices and fluctuating oil markets are pushing governments and consumers towards more affordable and environmentally friendly alternatives like CNG and LPG. Secondly, several African nations are actively promoting the adoption of cleaner fuels to improve air quality in rapidly urbanizing areas, thus incentivizing the use of CNG and LPG vehicles. Furthermore, the growth of commercial vehicle fleets, particularly in transportation and logistics, significantly contributes to market demand, along with supportive government policies and infrastructure development aimed at expanding CNG and LPG dispensing stations. However, challenges remain, including the limited availability of CNG and LPG refueling infrastructure in certain regions, a lack of consumer awareness about the benefits of these fuels, and the high initial cost of converting vehicles to run on CNG and LPG. South Africa, Nigeria, and Egypt currently dominate the market, but significant growth potential exists in other developing economies like Ethiopia and Morocco as their transportation sectors expand. The OEM segment holds a considerable market share but the aftermarket segment is expected to witness growth due to the increasing number of vehicles requiring conversions.
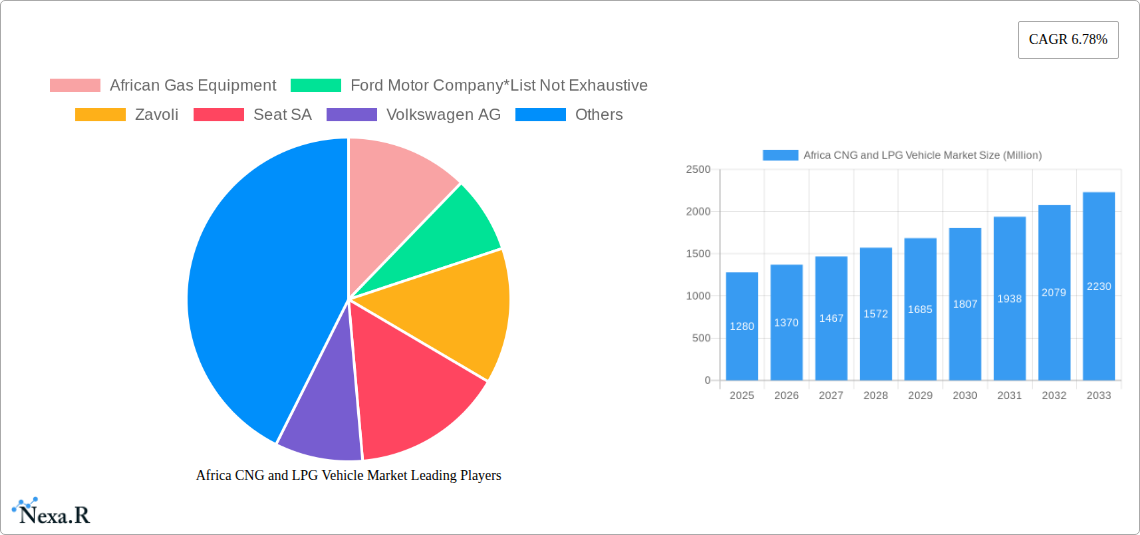
Africa CNG and LPG Vehicle Market Market Size (In Billion)
The market segmentation reveals that Passenger Cars currently hold a larger market share than Commercial Vehicles, though both segments are poised for substantial growth over the forecast period. Compressed Natural Gas (CNG) is expected to witness stronger growth compared to Liquified Petroleum Gas (LPG) due to its comparatively lower cost and availability in certain regions. The continuous expansion of the automotive industry in Africa, coupled with a focus on sustainable transportation solutions, further fuels the market's positive outlook. Continued investments in infrastructure and awareness campaigns targeting both consumers and businesses are crucial for unlocking the full potential of this promising market segment.
Africa CNG and LPG Vehicle Market Company Market Share
Africa CNG and LPG Vehicle Market: A Comprehensive Market Report (2019-2033)
This comprehensive report provides an in-depth analysis of the burgeoning Africa CNG and LPG vehicle market, offering invaluable insights for industry professionals, investors, and policymakers. Spanning the period from 2019 to 2033, with a focus on the 2025-2033 forecast, this study unravels market dynamics, growth trends, and key opportunities across various segments. The report covers a market expected to reach xx Million units by 2033, driven by increasing environmental concerns and government initiatives promoting cleaner fuel alternatives.
Africa CNG and LPG Vehicle Market Dynamics & Structure
The African CNG and LPG vehicle market is characterized by a fragmented landscape with a mix of international and local players. Market concentration is relatively low, with no single dominant player. Technological innovation is driven by the need for improved fuel efficiency, reduced emissions, and cost-effective solutions. Regulatory frameworks vary across countries, influencing adoption rates. Competitive product substitutes include gasoline and diesel vehicles, while the rising cost of these fuels is fueling demand for CNG and LPG alternatives. End-user demographics are diverse, spanning passenger car and commercial vehicle segments across urban and rural areas. M&A activity remains relatively low, but strategic partnerships are increasingly common.
- Market Concentration: Low, with several players competing across various segments.
- Technological Innovation: Focus on improved CNG/LPG technology, fuel efficiency, and emissions reduction.
- Regulatory Landscape: Varies across countries; supportive policies in some regions drive market growth.
- Competitive Substitutes: Gasoline and diesel vehicles pose a competitive threat.
- End-User Demographics: Diverse, including passenger car and commercial vehicle owners across diverse income levels and geographic locations.
- M&A Activity: Relatively low but strategic partnerships are prominent. xx M&A deals recorded in the historical period.
Africa CNG and LPG Vehicle Market Growth Trends & Insights
The African CNG and LPG vehicle market exhibits significant growth potential, driven by rising fuel prices, environmental concerns, and government support for cleaner fuels. The market size is projected to experience substantial growth during the forecast period, fueled by increasing adoption rates across various vehicle types and segments. Technological advancements, such as improved engine technology and refueling infrastructure, are further accelerating market expansion. Shifting consumer preferences towards eco-friendly transportation options also play a significant role. The CAGR for the market during the forecast period (2025-2033) is estimated to be xx%, with market penetration reaching xx% by 2033. Specific growth drivers include increasing urbanization and expanding transportation networks, governmental incentives promoting CNG and LPG adoption, and cost-effectiveness of these fuel types compared to gasoline or diesel, especially in regions with abundant natural gas and LPG resources.
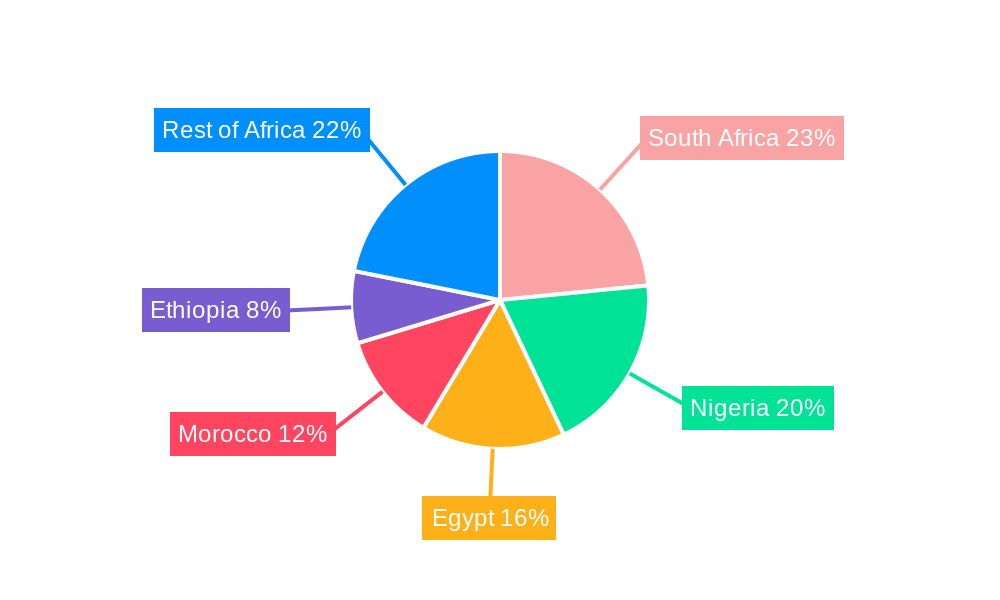
Dominant Regions, Countries, or Segments in Africa CNG and LPG Vehicle Market
South Africa, Nigeria, and Egypt currently dominate the African CNG and LPG vehicle market, driven by factors such as robust government support, relatively developed infrastructure, and a larger automotive market. However, other countries are quickly emerging, demonstrating significant growth potential. Within the segments, the passenger car segment is currently the largest, but commercial vehicles display strong growth. The OEM sales channel dominates currently, but the aftermarket segment is expected to gain significant traction.
- Leading Countries: South Africa, Nigeria, and Egypt.
- Key Drivers (South Africa): Established automotive industry, supportive government policies, and improved infrastructure.
- Key Drivers (Nigeria): Large population and growing economy, increasing urbanization, and rising demand for affordable transportation.
- Key Drivers (Egypt): Government initiatives promoting CNG adoption and significant natural gas reserves.
- Fuel Type: CNG and LPG markets are experiencing a nearly equal share.
- Vehicle Type: Passenger cars lead, with commercial vehicles showing faster growth.
- Sales Channel: OEM dominates currently, with the aftermarket segment exhibiting increasing growth.
Africa CNG and LPG Vehicle Market Product Landscape
The product landscape encompasses a wide range of CNG and LPG vehicles, including passenger cars and commercial vehicles. Innovations focus on improving fuel efficiency, reducing emissions, and enhancing vehicle performance. Unique selling propositions include cost savings compared to gasoline/diesel alternatives and reduced environmental impact. Technological advancements include the development of advanced CNG/LPG injection systems, improved fuel tank technology, and more efficient engines.
Key Drivers, Barriers & Challenges in Africa CNG and LPG Vehicle Market
Key Drivers:
- Rising fuel prices for gasoline and diesel.
- Government initiatives and policies promoting the use of cleaner fuels.
- Increasing environmental concerns and the need for reduced emissions.
- Cost-effectiveness of CNG and LPG compared to traditional fuels.
Key Challenges:
- Limited infrastructure for CNG and LPG refueling in many regions.
- High initial investment costs for CNG/LPG vehicle conversion and refueling stations.
- Lack of awareness among consumers about the benefits of CNG/LPG vehicles.
- Regulatory hurdles and inconsistencies across different countries. xx% of countries lack sufficient regulatory frameworks for CNG/LPG adoption.
Emerging Opportunities in Africa CNG and LPG Vehicle Market
- Expansion into untapped markets in rural areas.
- Development of innovative CNG/LPG vehicle technologies.
- Growing demand for commercial CNG and LPG vehicles for transportation.
- Increasing government support through incentives and infrastructure development.
Growth Accelerators in the Africa CNG and LPG Vehicle Market Industry
Long-term growth will be driven by technological advancements, including improved fuel efficiency and reduced emissions. Strategic partnerships between vehicle manufacturers, fuel suppliers, and infrastructure developers will be crucial. Market expansion into new regions with abundant natural gas and LPG resources will further accelerate growth.
Key Players Shaping the Africa CNG and LPG Vehicle Market Market
- African Gas Equipment
- Ford Motor Company
- Zavoli
- Seat SA
- Volkswagen AG
- Valtec
- ExoGas
- Cummins Inc
- Iveco S p A
- BRC Gas Equipments
- AB Volvo
Notable Milestones in Africa CNG and LPG Vehicle Market Sector
- November 2023: Tanzania launches its first integrated CNG facility.
- September 2023: Asiko opens a 300-metric-tonne LPG and CNG depot in Nigeria.
- May 2022: TAQA Arabia delivers CNG vehicles to Equatorial Guinea.
- March 2022: Suzuki launches its second-generation Celerio with an OE CNG kit in South Africa.
In-Depth Africa CNG and LPG Vehicle Market Market Outlook
The future of the African CNG and LPG vehicle market is bright, with substantial growth potential driven by continued economic development, increasing urbanization, and strong government support. Strategic investments in infrastructure development, coupled with technological advancements, will unlock significant market opportunities. The focus on cost-effective, environmentally friendly transportation solutions will continue to drive demand. Furthermore, the potential for regional cooperation to standardize regulations and facilitate cross-border trade presents a compelling opportunity for growth.
Africa CNG and LPG Vehicle Market Segmentation
-
1. Fuel Type
- 1.1. Compressed Natural Gas
- 1.2. Liquified Petroleum Gas
-
2. Vehicle Type
- 2.1. Passenger Cars
- 2.2. Commercial Vehicles
-
3. Sales Channel
- 3.1. OEM
- 3.2. Aftermarket
Africa CNG and LPG Vehicle Market Segmentation By Geography
-
1. Africa
- 1.1. Nigeria
- 1.2. South Africa
- 1.3. Egypt
- 1.4. Kenya
- 1.5. Ethiopia
- 1.6. Morocco
- 1.7. Ghana
- 1.8. Algeria
- 1.9. Tanzania
- 1.10. Ivory Coast
Africa CNG and LPG Vehicle Market Regional Market Share
Geographic Coverage of Africa CNG and LPG Vehicle Market
Africa CNG and LPG Vehicle Market REPORT HIGHLIGHTS
| Aspects | Details |
|---|---|
| Study Period | 2020-2034 |
| Base Year | 2025 |
| Estimated Year | 2026 |
| Forecast Period | 2026-2034 |
| Historical Period | 2020-2025 |
| Growth Rate | CAGR of 6.78% from 2020-2034 |
| Segmentation |
|
Table of Contents
- 1. Introduction
- 1.1. Research Scope
- 1.2. Market Segmentation
- 1.3. Research Objective
- 1.4. Definitions and Assumptions
- 2. Executive Summary
- 2.1. Market Snapshot
- 3. Market Dynamics
- 3.1. Market Drivers
- 3.2. Market Restrains
- 3.3. Market Trends
- 3.4. Market Opportunities
- 4. Market Factor Analysis
- 4.1. Porters Five Forces
- 4.1.1. Bargaining Power of Suppliers
- 4.1.2. Bargaining Power of Buyers
- 4.1.3. Threat of New Entrants
- 4.1.4. Threat of Substitutes
- 4.1.5. Competitive Rivalry
- 4.2. PESTEL analysis
- 4.3. BCG Analysis
- 4.3.1. Stars (High Growth, High Market Share)
- 4.3.2. Cash Cows (Low Growth, High Market Share)
- 4.3.3. Question Mark (High Growth, Low Market Share)
- 4.3.4. Dogs (Low Growth, Low Market Share)
- 4.4. Ansoff Matrix Analysis
- 4.5. Supply Chain Analysis
- 4.6. Regulatory Landscape
- 4.7. Current Market Potential and Opportunity Assessment (TAM–SAM–SOM Framework)
- 4.8. NRP Analyst Note
- 4.1. Porters Five Forces
- 5. Market Analysis, Insights and Forecast 2021-2033
- 5.1. Market Analysis, Insights and Forecast - by Fuel Type
- 5.1.1. Compressed Natural Gas
- 5.1.2. Liquified Petroleum Gas
- 5.2. Market Analysis, Insights and Forecast - by Vehicle Type
- 5.2.1. Passenger Cars
- 5.2.2. Commercial Vehicles
- 5.3. Market Analysis, Insights and Forecast - by Sales Channel
- 5.3.1. OEM
- 5.3.2. Aftermarket
- 5.4. Market Analysis, Insights and Forecast - by Region
- 5.4.1. Africa
- 5.1. Market Analysis, Insights and Forecast - by Fuel Type
- 6. Africa CNG and LPG Vehicle Market Analysis, Insights and Forecast, 2021-2033
- 6.1. Market Analysis, Insights and Forecast - by Fuel Type
- 6.1.1. Compressed Natural Gas
- 6.1.2. Liquified Petroleum Gas
- 6.2. Market Analysis, Insights and Forecast - by Vehicle Type
- 6.2.1. Passenger Cars
- 6.2.2. Commercial Vehicles
- 6.3. Market Analysis, Insights and Forecast - by Sales Channel
- 6.3.1. OEM
- 6.3.2. Aftermarket
- 6.1. Market Analysis, Insights and Forecast - by Fuel Type
- 7. Competitive Analysis
- 7.1. Company Profiles
- 7.1.1 African Gas Equipment
- 7.1.1.1. Company Overview
- 7.1.1.2. Products
- 7.1.1.3. Company Financials
- 7.1.1.4. SWOT Analysis
- 7.1.2 Ford Motor Company*List Not Exhaustive
- 7.1.2.1. Company Overview
- 7.1.2.2. Products
- 7.1.2.3. Company Financials
- 7.1.2.4. SWOT Analysis
- 7.1.3 Zavoli
- 7.1.3.1. Company Overview
- 7.1.3.2. Products
- 7.1.3.3. Company Financials
- 7.1.3.4. SWOT Analysis
- 7.1.4 Seat SA
- 7.1.4.1. Company Overview
- 7.1.4.2. Products
- 7.1.4.3. Company Financials
- 7.1.4.4. SWOT Analysis
- 7.1.5 Volkswagen AG
- 7.1.5.1. Company Overview
- 7.1.5.2. Products
- 7.1.5.3. Company Financials
- 7.1.5.4. SWOT Analysis
- 7.1.6 Valtec
- 7.1.6.1. Company Overview
- 7.1.6.2. Products
- 7.1.6.3. Company Financials
- 7.1.6.4. SWOT Analysis
- 7.1.7 ExoGas
- 7.1.7.1. Company Overview
- 7.1.7.2. Products
- 7.1.7.3. Company Financials
- 7.1.7.4. SWOT Analysis
- 7.1.8 Cummins Inc
- 7.1.8.1. Company Overview
- 7.1.8.2. Products
- 7.1.8.3. Company Financials
- 7.1.8.4. SWOT Analysis
- 7.1.9 Iveco S p A
- 7.1.9.1. Company Overview
- 7.1.9.2. Products
- 7.1.9.3. Company Financials
- 7.1.9.4. SWOT Analysis
- 7.1.10 BRC Gas Equipments
- 7.1.10.1. Company Overview
- 7.1.10.2. Products
- 7.1.10.3. Company Financials
- 7.1.10.4. SWOT Analysis
- 7.1.11 AB Volvo
- 7.1.11.1. Company Overview
- 7.1.11.2. Products
- 7.1.11.3. Company Financials
- 7.1.11.4. SWOT Analysis
- 7.1.1 African Gas Equipment
- 7.2. Market Entropy
- 7.2.1 Company's Key Areas Served
- 7.2.2 Recent Developments
- 7.3. Company Market Share Analysis 2025
- 7.3.1 Top 5 Companies Market Share Analysis
- 7.3.2 Top 3 Companies Market Share Analysis
- 7.4. List of Potential Customers
- 8. Research Methodology
List of Figures
- Figure 1: Africa CNG and LPG Vehicle Market Revenue Breakdown (Million, %) by Product 2025 & 2033
- Figure 2: Africa CNG and LPG Vehicle Market Share (%) by Company 2025
List of Tables
- Table 1: Africa CNG and LPG Vehicle Market Revenue Million Forecast, by Fuel Type 2020 & 2033
- Table 2: Africa CNG and LPG Vehicle Market Revenue Million Forecast, by Vehicle Type 2020 & 2033
- Table 3: Africa CNG and LPG Vehicle Market Revenue Million Forecast, by Sales Channel 2020 & 2033
- Table 4: Africa CNG and LPG Vehicle Market Revenue Million Forecast, by Region 2020 & 2033
- Table 5: Africa CNG and LPG Vehicle Market Revenue Million Forecast, by Fuel Type 2020 & 2033
- Table 6: Africa CNG and LPG Vehicle Market Revenue Million Forecast, by Vehicle Type 2020 & 2033
- Table 7: Africa CNG and LPG Vehicle Market Revenue Million Forecast, by Sales Channel 2020 & 2033
- Table 8: Africa CNG and LPG Vehicle Market Revenue Million Forecast, by Country 2020 & 2033
- Table 9: Nigeria Africa CNG and LPG Vehicle Market Revenue (Million) Forecast, by Application 2020 & 2033
- Table 10: South Africa Africa CNG and LPG Vehicle Market Revenue (Million) Forecast, by Application 2020 & 2033
- Table 11: Egypt Africa CNG and LPG Vehicle Market Revenue (Million) Forecast, by Application 2020 & 2033
- Table 12: Kenya Africa CNG and LPG Vehicle Market Revenue (Million) Forecast, by Application 2020 & 2033
- Table 13: Ethiopia Africa CNG and LPG Vehicle Market Revenue (Million) Forecast, by Application 2020 & 2033
- Table 14: Morocco Africa CNG and LPG Vehicle Market Revenue (Million) Forecast, by Application 2020 & 2033
- Table 15: Ghana Africa CNG and LPG Vehicle Market Revenue (Million) Forecast, by Application 2020 & 2033
- Table 16: Algeria Africa CNG and LPG Vehicle Market Revenue (Million) Forecast, by Application 2020 & 2033
- Table 17: Tanzania Africa CNG and LPG Vehicle Market Revenue (Million) Forecast, by Application 2020 & 2033
- Table 18: Ivory Coast Africa CNG and LPG Vehicle Market Revenue (Million) Forecast, by Application 2020 & 2033
Frequently Asked Questions
1. What is the projected Compound Annual Growth Rate (CAGR) of the Africa CNG and LPG Vehicle Market?
The projected CAGR is approximately 6.78%.
2. Which companies are prominent players in the Africa CNG and LPG Vehicle Market?
Key companies in the market include African Gas Equipment, Ford Motor Company*List Not Exhaustive, Zavoli, Seat SA, Volkswagen AG, Valtec, ExoGas, Cummins Inc, Iveco S p A, BRC Gas Equipments, AB Volvo.
3. What are the main segments of the Africa CNG and LPG Vehicle Market?
The market segments include Fuel Type, Vehicle Type, Sales Channel.
4. Can you provide details about the market size?
The market size is estimated to be USD 1.28 Million as of 2022.
5. What are some drivers contributing to market growth?
Investments in Refueling Infrastructure Is Driving the Market Growth.
6. What are the notable trends driving market growth?
Compressed Natural Gas will Hold Highest Growth Potential.
7. Are there any restraints impacting market growth?
Inadequate Regulatory Frameworks is Anticipated to Restrain the Market Growth.
8. Can you provide examples of recent developments in the market?
November 2023: Tanzania introduced its inaugural integrated facility for compressed natural gas (CNG), marking the country's debut of a combined CNG filling station and conversion center.
9. What pricing options are available for accessing the report?
Pricing options include single-user, multi-user, and enterprise licenses priced at USD 4750, USD 4950, and USD 6800 respectively.
10. Is the market size provided in terms of value or volume?
The market size is provided in terms of value, measured in Million.
11. Are there any specific market keywords associated with the report?
Yes, the market keyword associated with the report is "Africa CNG and LPG Vehicle Market," which aids in identifying and referencing the specific market segment covered.
12. How do I determine which pricing option suits my needs best?
The pricing options vary based on user requirements and access needs. Individual users may opt for single-user licenses, while businesses requiring broader access may choose multi-user or enterprise licenses for cost-effective access to the report.
13. Are there any additional resources or data provided in the Africa CNG and LPG Vehicle Market report?
While the report offers comprehensive insights, it's advisable to review the specific contents or supplementary materials provided to ascertain if additional resources or data are available.
14. How can I stay updated on further developments or reports in the Africa CNG and LPG Vehicle Market?
To stay informed about further developments, trends, and reports in the Africa CNG and LPG Vehicle Market, consider subscribing to industry newsletters, following relevant companies and organizations, or regularly checking reputable industry news sources and publications.
Methodology
Step 1 - Identification of Relevant Samples Size from Population Database


Step 2 - Approaches for Defining Global Market Size (Value, Volume* & Price*)

Note*: In applicable scenarios
Step 3 - Data Sources
Primary Research
- Web Analytics
- Survey Reports
- Research Institute
- Latest Research Reports
- Opinion Leaders
Secondary Research
- Annual Reports
- White Paper
- Latest Press Release
- Industry Association
- Paid Database
- Investor Presentations

Step 4 - Data Triangulation
Involves using different sources of information in order to increase the validity of a study
These sources are likely to be stakeholders in a program - participants, other researchers, program staff, other community members, and so on.
Then we put all data in single framework & apply various statistical tools to find out the dynamic on the market.
During the analysis stage, feedback from the stakeholder groups would be compared to determine areas of agreement as well as areas of divergence