

Key Insights
The marine battery market is poised for substantial expansion, propelled by the escalating adoption of electric and hybrid vessels in commercial and defense sectors. Projected to reach $1.54 billion by 2025, the market is anticipated to grow at a robust Compound Annual Growth Rate (CAGR) of 17.89% from 2025 to 2033. This growth is underpinned by several critical drivers: stringent environmental regulations mandating reduced maritime emissions, the increasing integration of sustainable propulsion systems, and continuous technological advancements in battery energy density, longevity, and cost-effectiveness. Lithium-ion batteries currently lead market share due to their superior performance over conventional lead-acid and nickel-cadmium technologies, with fuel cells also emerging as a significant contender for their enhanced energy efficiency. The commercial shipping segment represents the largest market share owing to the extensive fleet size, while defense applications are experiencing notable growth driven by increased defense spending and the demand for stealthier, more efficient naval operations. Geographically, North America and Europe exhibit strong market presence, with Asia-Pacific demonstrating rapid growth fueled by its burgeoning shipbuilding industry. Key challenges include high initial investment, limited battery lifespan, and the development of comprehensive charging infrastructure.
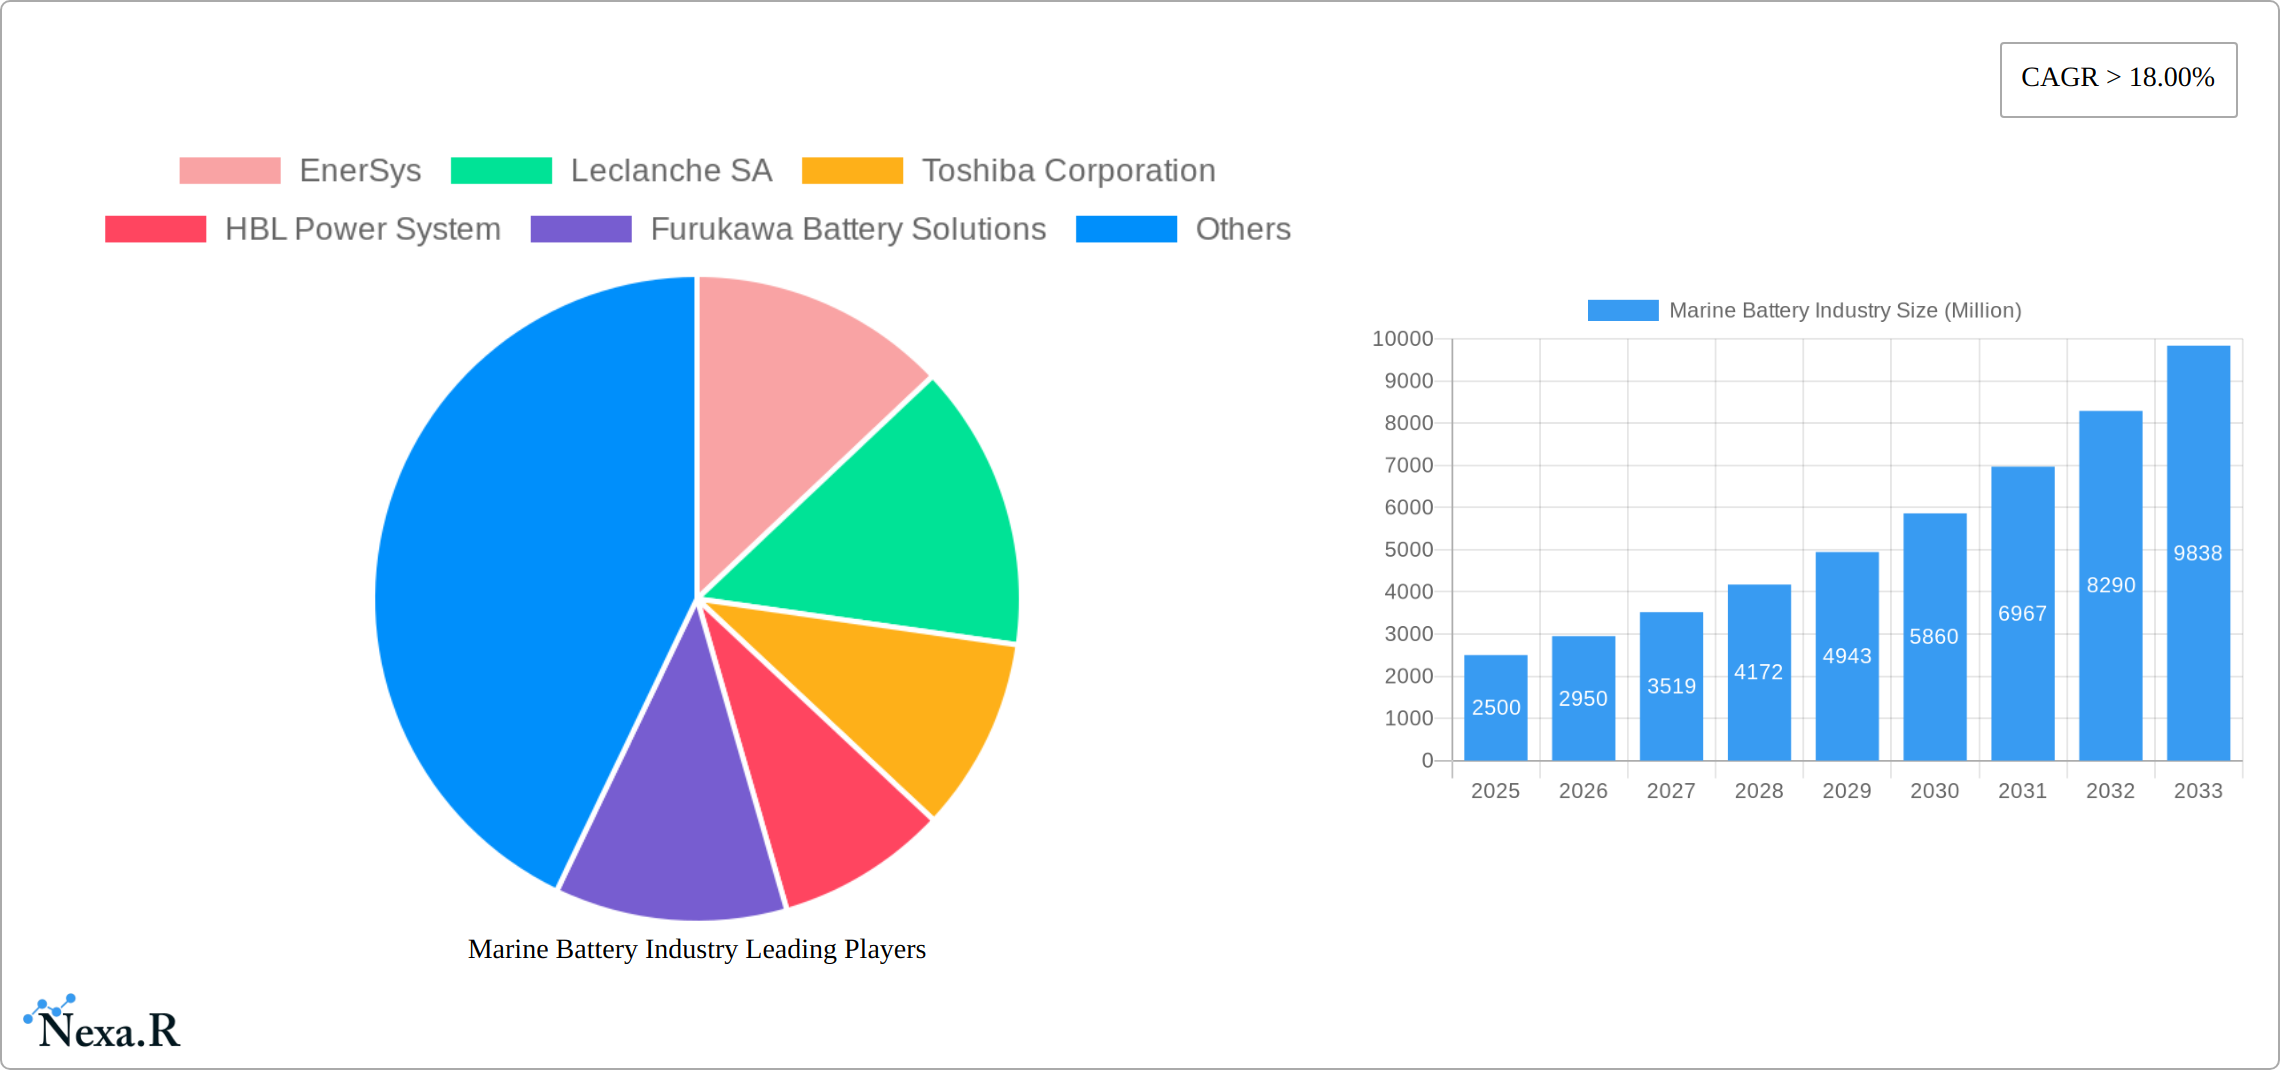
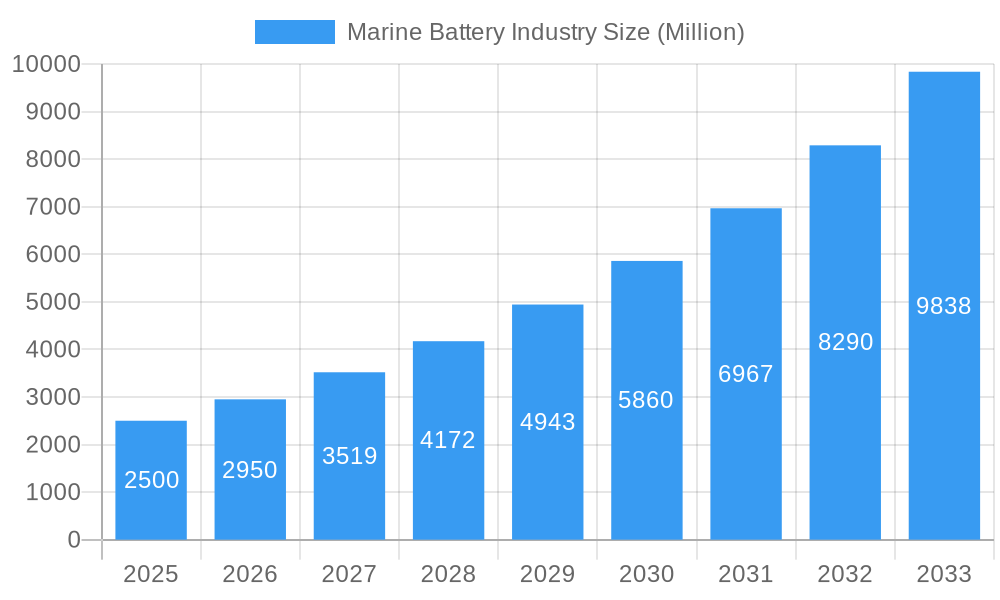
Marine Battery Industry Market Size (In Billion)
Despite these hurdles, the long-term outlook for the marine battery sector remains highly promising. Ongoing technological innovation, government incentives for green shipping, and heightened environmental consciousness are set to accelerate market growth. The industry is characterized by intense competition among key players such as EnerSys, Leclanche SA, and Toshiba Corporation, fostering innovation and price optimization. The diverse array of battery technologies and vessel types contributes to the market's complexity and dynamism, creating opportunities for specialized companies and strategic alliances. The ongoing transition to electric and hybrid vessels will fundamentally transform maritime transportation, catalyzing significant growth and innovation within the marine battery industry.
Marine Battery Industry Company Market Share
Marine Battery Industry Market Report: 2019-2033
This comprehensive report provides an in-depth analysis of the Marine Battery Industry, encompassing market dynamics, growth trends, regional segmentation, and key players. With a study period spanning 2019-2033, a base year of 2025, and a forecast period of 2025-2033, this report is an essential resource for industry professionals, investors, and strategic decision-makers. The report covers both parent markets (renewable energy, marine transportation) and child markets (commercial shipping, defense vessels, recreational boating) for a complete view. Market values are presented in million units.
Marine Battery Industry Market Dynamics & Structure
The marine battery market is undergoing a significant transformation fueled by stricter environmental regulations, the burgeoning adoption of electric and hybrid propulsion systems, and groundbreaking advancements in battery technologies. While market concentration remains moderate, with key players like EnerSys, Leclanche SA, and Toshiba Corporation holding substantial market share, a vibrant ecosystem of smaller companies also contributes significantly. This dynamic landscape is shaped by several key factors:
- Market Concentration: Moderate, with the top 5 players estimated to hold approximately [Insert Updated Percentage]% of the market share in 2024. This suggests opportunities for both established players and emerging innovators.
- Technological Innovation: The relentless pursuit of higher energy density, extended lifespan, enhanced safety features (especially crucial for lithium-ion batteries), and reduced costs is driving rapid innovation. Research into solid-state batteries and improved battery management systems is also gaining traction.
- Regulatory Frameworks: The International Maritime Organization's (IMO) increasingly stringent regulations on greenhouse gas emissions are a powerful catalyst, compelling the industry to embrace cleaner energy solutions, including battery-powered vessels. This regulatory pressure is expected to intensify in the coming years.
- Competitive Product Substitutes: While fuel cells and alternative energy sources present some competition, battery technology continues to dominate many marine applications due to its current maturity and cost-effectiveness. However, the competitive landscape is evolving.
- End-User Demographics: The market is diverse, segmented by vessel type (commercial, defense, recreational, fishing). Currently, commercial shipping represents the largest segment, but growth is anticipated in other sectors, particularly in the recreational boating market driven by increased consumer demand for eco-friendly options.
- M&A Trends: A notable level of M&A activity has been observed in recent years ([Insert Updated Number] deals in the last 5 years), largely focused on expanding product portfolios, geographic reach, and securing access to critical technologies. High R&D costs and stringent safety certification requirements remain significant innovation barriers.
Marine Battery Industry Growth Trends & Insights
The marine battery market witnessed robust growth during the historical period (2019-2024), with a CAGR of xx%. This growth is anticipated to continue during the forecast period (2025-2033), driven by increasing demand for electric and hybrid vessels, particularly in the commercial shipping sector. The market size in 2024 is estimated at xx million units and is projected to reach xx million units by 2033. The adoption rate of lithium-ion batteries is significantly increasing, replacing traditional lead-acid batteries due to superior performance and environmental benefits. Technological disruptions, such as advancements in solid-state battery technology, are expected to further accelerate market growth. Consumer behavior is shifting towards environmentally friendly options, boosting the demand for marine batteries.
Dominant Regions, Countries, or Segments in Marine Battery Industry
The North American and European regions currently dominate the marine battery market, driven by stringent environmental regulations and a high concentration of shipbuilding activities. However, Asia-Pacific is expected to witness the fastest growth during the forecast period due to increasing investments in marine infrastructure and expanding shipbuilding capacity.
- Leading Segment: Lithium-ion batteries are the fastest-growing segment, driven by their higher energy density and longer lifespan.
- Leading Ship Type: Commercial ships contribute the largest share of the market due to the high number of vessels requiring power solutions.
- Key Drivers: Stringent emission regulations, government incentives for green shipping, and advancements in battery technology.
Marine Battery Industry Product Landscape
The marine battery market presents a diverse range of technologies, including lithium-ion, nickel-cadmium, lead-acid, and fuel cell batteries, each catering to specific applications and performance requirements. While lead-acid batteries maintain a presence due to their established cost-effectiveness, lithium-ion batteries are rapidly gaining dominance, prized for their superior energy density and extended lifespan. This shift is driven by continuous innovations focused on improving energy density, extending operational lifespan, enhancing safety mechanisms (especially thermal runaway protection), and streamlining charging infrastructure. Key value propositions for marine battery solutions include increased operational efficiency, significantly reduced emissions, enhanced safety compared to traditional power sources, and reduced maintenance requirements.
Key Drivers, Barriers & Challenges in Marine Battery Industry
Key Drivers: Growing demand for eco-friendly vessels, stringent emission norms from regulatory bodies like IMO, technological advancements leading to improved battery performance, and decreasing battery costs are major drivers.
Key Challenges: High initial investment costs for battery systems, limited charging infrastructure in ports, concerns about battery safety and lifecycle management, and the need for improved battery recycling solutions pose significant challenges. Supply chain disruptions related to raw materials and manufacturing capacity can also impact market growth. For example, xx% of the supply chain was impacted in 2022.
Emerging Opportunities in Marine Battery Industry
The market presents several opportunities, including the growing demand for hybrid and fully electric vessels in various segments like ferries, tugboats, and recreational boats. Untapped markets in developing economies also offer significant growth potential. Innovative applications such as energy storage for offshore wind farms and hybrid power systems incorporating solar or fuel cells are also emerging.
Growth Accelerators in the Marine Battery Industry Industry
Technological advancements in battery chemistry, leading to increased energy density and lifespan, are accelerating market growth. Strategic partnerships between battery manufacturers, shipbuilders, and energy companies are fostering innovation and accelerating adoption. Expansion into new markets, particularly in developing economies, and government policies supporting the use of green technologies further bolster market growth.
Key Players Shaping the Marine Battery Industry Market
- EnerSys
- Leclanche SA
- Toshiba Corporation
- HBL Power System
- Furukawa Battery Solutions
- Siemens AG
- BorgWarner Inc
- Wartsila
- Saft
- Exide Technologies
- [Add other relevant key players]
Notable Milestones in Marine Battery Industry Sector
- October 2022: ABS and CATL signed a cooperation agreement to research lithium battery propulsion for next-generation vessels, focusing on safety-related technologies. This highlights the industry's focus on safety and regulatory compliance.
- January 2022: Vision Marine Technologies partnered with Octillion Power Systems to develop a high-voltage battery pack for recreational boating, indicating growth in the recreational sector.
- [Add other relevant milestones with dates and brief descriptions]
In-Depth Marine Battery Industry Market Outlook
The marine battery market is poised for significant growth over the next decade, driven by the increasing adoption of electric and hybrid propulsion systems, supported by technological advancements and supportive government policies. Strategic partnerships and innovations in battery technologies, particularly focusing on safety and lifecycle management, will shape future market dynamics. The market offers substantial opportunities for players who can develop cost-effective, high-performance, and sustainable battery solutions tailored to the specific needs of various marine applications.
Marine Battery Industry Segmentation
-
1. Battery
- 1.1. Lithium-ion
- 1.2. Nickel-Cadmium
- 1.3. Fuel Cell
- 1.4. Lead Acid
-
2. Ship Type
- 2.1. Commercial
- 2.2. Defense
Marine Battery Industry Segmentation By Geography
-
1. North America
- 1.1. United States
- 1.2. Canada
-
2. Europe
- 2.1. Germany
- 2.2. United Kingdom
- 2.3. France
- 2.4. Russia
- 2.5. Rest of Europe
-
3. Asia Pacific
- 3.1. India
- 3.2. China
- 3.3. Japan
- 3.4. South Korea
- 3.5. Rest of Asia Pacific
-
4. Latin America
- 4.1. Brazil
- 4.2. Rest of Latin America
-
5. Middle East and Africa
- 5.1. United Arab Emirates
- 5.2. Saudi Arabia
- 5.3. Israel
- 5.4. South Africa
- 5.5. Rest of Middle East and Africa
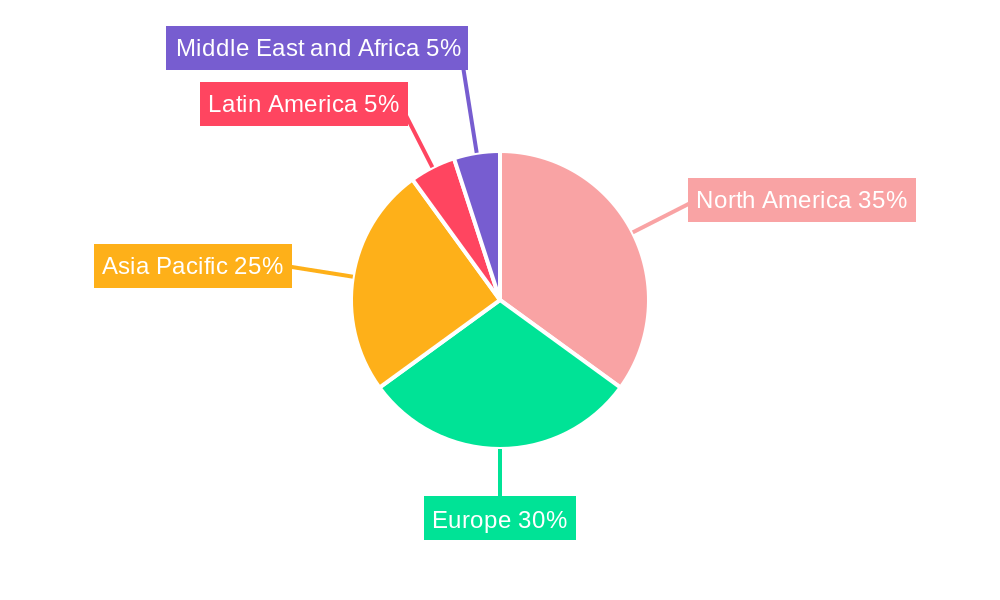
Marine Battery Industry Regional Market Share
Geographic Coverage of Marine Battery Industry
Marine Battery Industry REPORT HIGHLIGHTS
| Aspects | Details |
|---|---|
| Study Period | 2020-2034 |
| Base Year | 2025 |
| Estimated Year | 2026 |
| Forecast Period | 2026-2034 |
| Historical Period | 2020-2025 |
| Growth Rate | CAGR of 17.89% from 2020-2034 |
| Segmentation |
|
Table of Contents
- 1. Introduction
- 1.1. Research Scope
- 1.2. Market Segmentation
- 1.3. Research Objective
- 1.4. Definitions and Assumptions
- 2. Executive Summary
- 2.1. Market Snapshot
- 3. Market Dynamics
- 3.1. Market Drivers
- 3.2. Market Restrains
- 3.3. Market Trends
- 3.4. Market Opportunities
- 4. Market Factor Analysis
- 4.1. Porters Five Forces
- 4.1.1. Bargaining Power of Suppliers
- 4.1.2. Bargaining Power of Buyers
- 4.1.3. Threat of New Entrants
- 4.1.4. Threat of Substitutes
- 4.1.5. Competitive Rivalry
- 4.2. PESTEL analysis
- 4.3. BCG Analysis
- 4.3.1. Stars (High Growth, High Market Share)
- 4.3.2. Cash Cows (Low Growth, High Market Share)
- 4.3.3. Question Mark (High Growth, Low Market Share)
- 4.3.4. Dogs (Low Growth, Low Market Share)
- 4.4. Ansoff Matrix Analysis
- 4.5. Supply Chain Analysis
- 4.6. Regulatory Landscape
- 4.7. Current Market Potential and Opportunity Assessment (TAM–SAM–SOM Framework)
- 4.8. NRP Analyst Note
- 4.1. Porters Five Forces
- 5. Market Analysis, Insights and Forecast 2021-2033
- 5.1. Market Analysis, Insights and Forecast - by Battery
- 5.1.1. Lithium-ion
- 5.1.2. Nickel-Cadmium
- 5.1.3. Fuel Cell
- 5.1.4. Lead Acid
- 5.2. Market Analysis, Insights and Forecast - by Ship Type
- 5.2.1. Commercial
- 5.2.2. Defense
- 5.3. Market Analysis, Insights and Forecast - by Region
- 5.3.1. North America
- 5.3.2. Europe
- 5.3.3. Asia Pacific
- 5.3.4. Latin America
- 5.3.5. Middle East and Africa
- 5.1. Market Analysis, Insights and Forecast - by Battery
- 6. Global Marine Battery Industry Analysis, Insights and Forecast, 2021-2033
- 6.1. Market Analysis, Insights and Forecast - by Battery
- 6.1.1. Lithium-ion
- 6.1.2. Nickel-Cadmium
- 6.1.3. Fuel Cell
- 6.1.4. Lead Acid
- 6.2. Market Analysis, Insights and Forecast - by Ship Type
- 6.2.1. Commercial
- 6.2.2. Defense
- 6.1. Market Analysis, Insights and Forecast - by Battery
- 7. North America Marine Battery Industry Analysis, Insights and Forecast, 2020-2032
- 7.1. Market Analysis, Insights and Forecast - by Battery
- 7.1.1. Lithium-ion
- 7.1.2. Nickel-Cadmium
- 7.1.3. Fuel Cell
- 7.1.4. Lead Acid
- 7.2. Market Analysis, Insights and Forecast - by Ship Type
- 7.2.1. Commercial
- 7.2.2. Defense
- 7.1. Market Analysis, Insights and Forecast - by Battery
- 8. Europe Marine Battery Industry Analysis, Insights and Forecast, 2020-2032
- 8.1. Market Analysis, Insights and Forecast - by Battery
- 8.1.1. Lithium-ion
- 8.1.2. Nickel-Cadmium
- 8.1.3. Fuel Cell
- 8.1.4. Lead Acid
- 8.2. Market Analysis, Insights and Forecast - by Ship Type
- 8.2.1. Commercial
- 8.2.2. Defense
- 8.1. Market Analysis, Insights and Forecast - by Battery
- 9. Asia Pacific Marine Battery Industry Analysis, Insights and Forecast, 2020-2032
- 9.1. Market Analysis, Insights and Forecast - by Battery
- 9.1.1. Lithium-ion
- 9.1.2. Nickel-Cadmium
- 9.1.3. Fuel Cell
- 9.1.4. Lead Acid
- 9.2. Market Analysis, Insights and Forecast - by Ship Type
- 9.2.1. Commercial
- 9.2.2. Defense
- 9.1. Market Analysis, Insights and Forecast - by Battery
- 10. Latin America Marine Battery Industry Analysis, Insights and Forecast, 2020-2032
- 10.1. Market Analysis, Insights and Forecast - by Battery
- 10.1.1. Lithium-ion
- 10.1.2. Nickel-Cadmium
- 10.1.3. Fuel Cell
- 10.1.4. Lead Acid
- 10.2. Market Analysis, Insights and Forecast - by Ship Type
- 10.2.1. Commercial
- 10.2.2. Defense
- 10.1. Market Analysis, Insights and Forecast - by Battery
- 11. Middle East and Africa Marine Battery Industry Analysis, Insights and Forecast, 2020-2032
- 11.1. Market Analysis, Insights and Forecast - by Battery
- 11.1.1. Lithium-ion
- 11.1.2. Nickel-Cadmium
- 11.1.3. Fuel Cell
- 11.1.4. Lead Acid
- 11.2. Market Analysis, Insights and Forecast - by Ship Type
- 11.2.1. Commercial
- 11.2.2. Defense
- 11.1. Market Analysis, Insights and Forecast - by Battery
- 12. Competitive Analysis
- 12.1. Company Profiles
- 12.1.1 EnerSys
- 12.1.1.1. Company Overview
- 12.1.1.2. Products
- 12.1.1.3. Company Financials
- 12.1.1.4. SWOT Analysis
- 12.1.2 Leclanche SA
- 12.1.2.1. Company Overview
- 12.1.2.2. Products
- 12.1.2.3. Company Financials
- 12.1.2.4. SWOT Analysis
- 12.1.3 Toshiba Corporation
- 12.1.3.1. Company Overview
- 12.1.3.2. Products
- 12.1.3.3. Company Financials
- 12.1.3.4. SWOT Analysis
- 12.1.4 HBL Power System
- 12.1.4.1. Company Overview
- 12.1.4.2. Products
- 12.1.4.3. Company Financials
- 12.1.4.4. SWOT Analysis
- 12.1.5 Furukawa Battery Solutions
- 12.1.5.1. Company Overview
- 12.1.5.2. Products
- 12.1.5.3. Company Financials
- 12.1.5.4. SWOT Analysis
- 12.1.6 Siemens AG
- 12.1.6.1. Company Overview
- 12.1.6.2. Products
- 12.1.6.3. Company Financials
- 12.1.6.4. SWOT Analysis
- 12.1.7 BorgWarner Inc
- 12.1.7.1. Company Overview
- 12.1.7.2. Products
- 12.1.7.3. Company Financials
- 12.1.7.4. SWOT Analysis
- 12.1.8 Wartsila
- 12.1.8.1. Company Overview
- 12.1.8.2. Products
- 12.1.8.3. Company Financials
- 12.1.8.4. SWOT Analysis
- 12.1.9 Saft
- 12.1.9.1. Company Overview
- 12.1.9.2. Products
- 12.1.9.3. Company Financials
- 12.1.9.4. SWOT Analysis
- 12.1.10 Exide Technologies
- 12.1.10.1. Company Overview
- 12.1.10.2. Products
- 12.1.10.3. Company Financials
- 12.1.10.4. SWOT Analysis
- 12.1.1 EnerSys
- 12.2. Market Entropy
- 12.2.1 Company's Key Areas Served
- 12.2.2 Recent Developments
- 12.3. Company Market Share Analysis 2025
- 12.3.1 Top 5 Companies Market Share Analysis
- 12.3.2 Top 3 Companies Market Share Analysis
- 12.4. List of Potential Customers
- 13. Research Methodology
List of Figures
- Figure 1: Global Marine Battery Industry Revenue Breakdown (billion, %) by Region 2025 & 2033
- Figure 2: North America Marine Battery Industry Revenue (billion), by Battery 2025 & 2033
- Figure 3: North America Marine Battery Industry Revenue Share (%), by Battery 2025 & 2033
- Figure 4: North America Marine Battery Industry Revenue (billion), by Ship Type 2025 & 2033
- Figure 5: North America Marine Battery Industry Revenue Share (%), by Ship Type 2025 & 2033
- Figure 6: North America Marine Battery Industry Revenue (billion), by Country 2025 & 2033
- Figure 7: North America Marine Battery Industry Revenue Share (%), by Country 2025 & 2033
- Figure 8: Europe Marine Battery Industry Revenue (billion), by Battery 2025 & 2033
- Figure 9: Europe Marine Battery Industry Revenue Share (%), by Battery 2025 & 2033
- Figure 10: Europe Marine Battery Industry Revenue (billion), by Ship Type 2025 & 2033
- Figure 11: Europe Marine Battery Industry Revenue Share (%), by Ship Type 2025 & 2033
- Figure 12: Europe Marine Battery Industry Revenue (billion), by Country 2025 & 2033
- Figure 13: Europe Marine Battery Industry Revenue Share (%), by Country 2025 & 2033
- Figure 14: Asia Pacific Marine Battery Industry Revenue (billion), by Battery 2025 & 2033
- Figure 15: Asia Pacific Marine Battery Industry Revenue Share (%), by Battery 2025 & 2033
- Figure 16: Asia Pacific Marine Battery Industry Revenue (billion), by Ship Type 2025 & 2033
- Figure 17: Asia Pacific Marine Battery Industry Revenue Share (%), by Ship Type 2025 & 2033
- Figure 18: Asia Pacific Marine Battery Industry Revenue (billion), by Country 2025 & 2033
- Figure 19: Asia Pacific Marine Battery Industry Revenue Share (%), by Country 2025 & 2033
- Figure 20: Latin America Marine Battery Industry Revenue (billion), by Battery 2025 & 2033
- Figure 21: Latin America Marine Battery Industry Revenue Share (%), by Battery 2025 & 2033
- Figure 22: Latin America Marine Battery Industry Revenue (billion), by Ship Type 2025 & 2033
- Figure 23: Latin America Marine Battery Industry Revenue Share (%), by Ship Type 2025 & 2033
- Figure 24: Latin America Marine Battery Industry Revenue (billion), by Country 2025 & 2033
- Figure 25: Latin America Marine Battery Industry Revenue Share (%), by Country 2025 & 2033
- Figure 26: Middle East and Africa Marine Battery Industry Revenue (billion), by Battery 2025 & 2033
- Figure 27: Middle East and Africa Marine Battery Industry Revenue Share (%), by Battery 2025 & 2033
- Figure 28: Middle East and Africa Marine Battery Industry Revenue (billion), by Ship Type 2025 & 2033
- Figure 29: Middle East and Africa Marine Battery Industry Revenue Share (%), by Ship Type 2025 & 2033
- Figure 30: Middle East and Africa Marine Battery Industry Revenue (billion), by Country 2025 & 2033
- Figure 31: Middle East and Africa Marine Battery Industry Revenue Share (%), by Country 2025 & 2033
List of Tables
- Table 1: Global Marine Battery Industry Revenue billion Forecast, by Battery 2020 & 2033
- Table 2: Global Marine Battery Industry Revenue billion Forecast, by Ship Type 2020 & 2033
- Table 3: Global Marine Battery Industry Revenue billion Forecast, by Region 2020 & 2033
- Table 4: Global Marine Battery Industry Revenue billion Forecast, by Battery 2020 & 2033
- Table 5: Global Marine Battery Industry Revenue billion Forecast, by Ship Type 2020 & 2033
- Table 6: Global Marine Battery Industry Revenue billion Forecast, by Country 2020 & 2033
- Table 7: United States Marine Battery Industry Revenue (billion) Forecast, by Application 2020 & 2033
- Table 8: Canada Marine Battery Industry Revenue (billion) Forecast, by Application 2020 & 2033
- Table 9: Global Marine Battery Industry Revenue billion Forecast, by Battery 2020 & 2033
- Table 10: Global Marine Battery Industry Revenue billion Forecast, by Ship Type 2020 & 2033
- Table 11: Global Marine Battery Industry Revenue billion Forecast, by Country 2020 & 2033
- Table 12: Germany Marine Battery Industry Revenue (billion) Forecast, by Application 2020 & 2033
- Table 13: United Kingdom Marine Battery Industry Revenue (billion) Forecast, by Application 2020 & 2033
- Table 14: France Marine Battery Industry Revenue (billion) Forecast, by Application 2020 & 2033
- Table 15: Russia Marine Battery Industry Revenue (billion) Forecast, by Application 2020 & 2033
- Table 16: Rest of Europe Marine Battery Industry Revenue (billion) Forecast, by Application 2020 & 2033
- Table 17: Global Marine Battery Industry Revenue billion Forecast, by Battery 2020 & 2033
- Table 18: Global Marine Battery Industry Revenue billion Forecast, by Ship Type 2020 & 2033
- Table 19: Global Marine Battery Industry Revenue billion Forecast, by Country 2020 & 2033
- Table 20: India Marine Battery Industry Revenue (billion) Forecast, by Application 2020 & 2033
- Table 21: China Marine Battery Industry Revenue (billion) Forecast, by Application 2020 & 2033
- Table 22: Japan Marine Battery Industry Revenue (billion) Forecast, by Application 2020 & 2033
- Table 23: South Korea Marine Battery Industry Revenue (billion) Forecast, by Application 2020 & 2033
- Table 24: Rest of Asia Pacific Marine Battery Industry Revenue (billion) Forecast, by Application 2020 & 2033
- Table 25: Global Marine Battery Industry Revenue billion Forecast, by Battery 2020 & 2033
- Table 26: Global Marine Battery Industry Revenue billion Forecast, by Ship Type 2020 & 2033
- Table 27: Global Marine Battery Industry Revenue billion Forecast, by Country 2020 & 2033
- Table 28: Brazil Marine Battery Industry Revenue (billion) Forecast, by Application 2020 & 2033
- Table 29: Rest of Latin America Marine Battery Industry Revenue (billion) Forecast, by Application 2020 & 2033
- Table 30: Global Marine Battery Industry Revenue billion Forecast, by Battery 2020 & 2033
- Table 31: Global Marine Battery Industry Revenue billion Forecast, by Ship Type 2020 & 2033
- Table 32: Global Marine Battery Industry Revenue billion Forecast, by Country 2020 & 2033
- Table 33: United Arab Emirates Marine Battery Industry Revenue (billion) Forecast, by Application 2020 & 2033
- Table 34: Saudi Arabia Marine Battery Industry Revenue (billion) Forecast, by Application 2020 & 2033
- Table 35: Israel Marine Battery Industry Revenue (billion) Forecast, by Application 2020 & 2033
- Table 36: South Africa Marine Battery Industry Revenue (billion) Forecast, by Application 2020 & 2033
- Table 37: Rest of Middle East and Africa Marine Battery Industry Revenue (billion) Forecast, by Application 2020 & 2033
Frequently Asked Questions
1. What is the projected Compound Annual Growth Rate (CAGR) of the Marine Battery Industry?
The projected CAGR is approximately 17.89%.
2. Which companies are prominent players in the Marine Battery Industry?
Key companies in the market include EnerSys, Leclanche SA, Toshiba Corporation, HBL Power System, Furukawa Battery Solutions, Siemens AG, BorgWarner Inc, Wartsila, Saft, Exide Technologies.
3. What are the main segments of the Marine Battery Industry?
The market segments include Battery, Ship Type.
4. Can you provide details about the market size?
The market size is estimated to be USD 1.54 billion as of 2022.
5. What are some drivers contributing to market growth?
Increasing Adoption of 2-wheelers across the Globe.
6. What are the notable trends driving market growth?
Lithium-ion Segment is Projected to Highest Growth During the Forecast Period.
7. Are there any restraints impacting market growth?
Rise in demand of Electric Vehicles.
8. Can you provide examples of recent developments in the market?
October 2022: ABS signed a cooperation agreement with Contemporary Amperex Technology Co., Limited (CATL) to work together and research lithium battery propulsion for next-generation vessels. Under the agreement, the two companies would carry out research on the technical standards for battery-powered vessels, which includes key safety-related technologies such as the charging system, power battery compartment layout, propulsion system, and fire control.
9. What pricing options are available for accessing the report?
Pricing options include single-user, multi-user, and enterprise licenses priced at USD 4750, USD 5250, and USD 8750 respectively.
10. Is the market size provided in terms of value or volume?
The market size is provided in terms of value, measured in billion.
11. Are there any specific market keywords associated with the report?
Yes, the market keyword associated with the report is "Marine Battery Industry," which aids in identifying and referencing the specific market segment covered.
12. How do I determine which pricing option suits my needs best?
The pricing options vary based on user requirements and access needs. Individual users may opt for single-user licenses, while businesses requiring broader access may choose multi-user or enterprise licenses for cost-effective access to the report.
13. Are there any additional resources or data provided in the Marine Battery Industry report?
While the report offers comprehensive insights, it's advisable to review the specific contents or supplementary materials provided to ascertain if additional resources or data are available.
14. How can I stay updated on further developments or reports in the Marine Battery Industry?
To stay informed about further developments, trends, and reports in the Marine Battery Industry, consider subscribing to industry newsletters, following relevant companies and organizations, or regularly checking reputable industry news sources and publications.
Methodology
Step 1 - Identification of Relevant Samples Size from Population Database


Step 2 - Approaches for Defining Global Market Size (Value, Volume* & Price*)

Note*: In applicable scenarios
Step 3 - Data Sources
Primary Research
- Web Analytics
- Survey Reports
- Research Institute
- Latest Research Reports
- Opinion Leaders
Secondary Research
- Annual Reports
- White Paper
- Latest Press Release
- Industry Association
- Paid Database
- Investor Presentations

Step 4 - Data Triangulation
Involves using different sources of information in order to increase the validity of a study
These sources are likely to be stakeholders in a program - participants, other researchers, program staff, other community members, and so on.
Then we put all data in single framework & apply various statistical tools to find out the dynamic on the market.
During the analysis stage, feedback from the stakeholder groups would be compared to determine areas of agreement as well as areas of divergence