

Key Insights
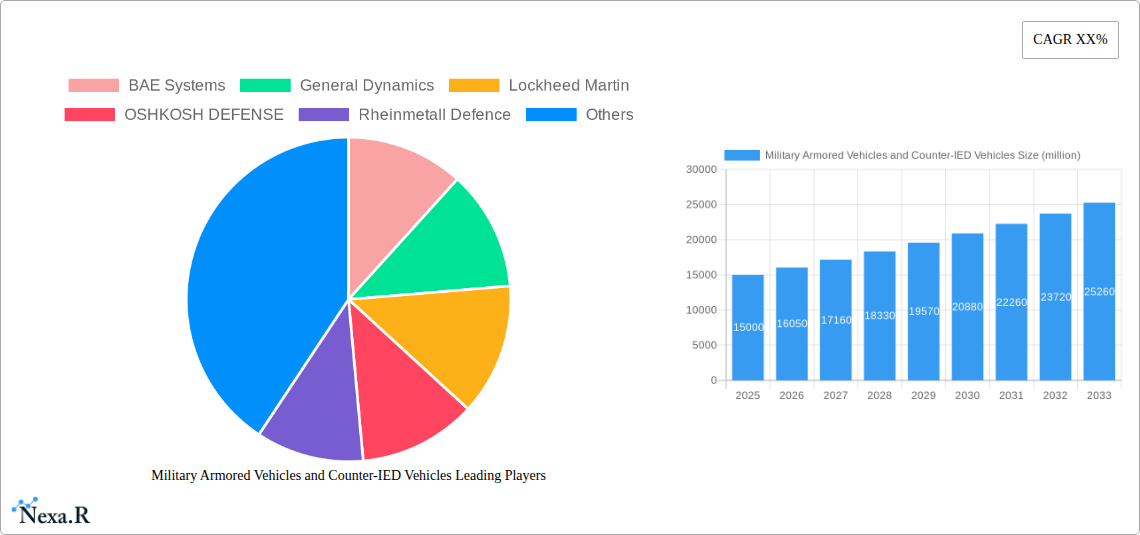
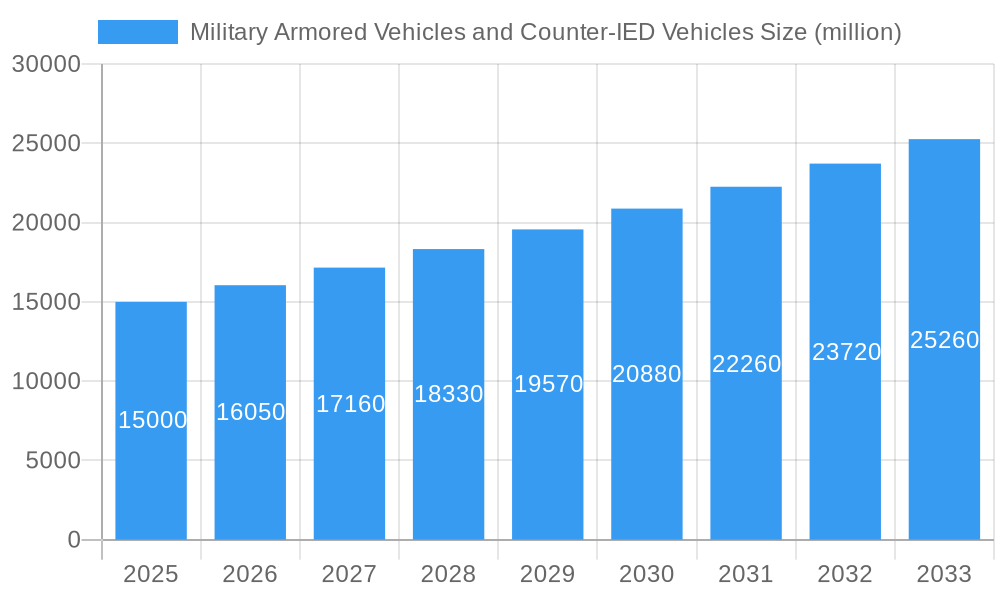
The global market for Military Armored Vehicles and Counter-IED Vehicles is experiencing robust growth, driven by escalating geopolitical tensions, increasing cross-border conflicts, and the persistent threat of terrorism. The market, estimated at $15 billion in 2025, is projected to exhibit a Compound Annual Growth Rate (CAGR) of 7% from 2025 to 2033, reaching approximately $25 billion by 2033. Key drivers include the modernization of military fleets in numerous countries, particularly in North America and Europe, and the continuous demand for advanced protection technologies against improvised explosive devices (IEDs). Technological advancements such as improved armor materials, enhanced surveillance systems, and the integration of advanced weaponry are further propelling market expansion. While budget constraints in certain regions and the development of asymmetric warfare tactics pose challenges, the overall market outlook remains positive, fueled by consistent investment in defense spending and the evolving nature of modern warfare.
Military Armored Vehicles and Counter-IED Vehicles Market Size (In Billion)
Segment-wise, the market is dominated by wheeled armored vehicles, driven by their tactical flexibility and cost-effectiveness. However, tracked armored vehicles continue to hold significance in specific applications requiring superior mobility and protection. The Counter-IED segment is experiencing exceptionally strong growth, reflecting the ongoing need for sophisticated solutions to neutralize IED threats. Major players like BAE Systems, General Dynamics, Lockheed Martin, Oshkosh Defense, Rheinmetall Defence, and Rostec are fiercely competing, constantly innovating and investing in R&D to capture market share. The regional distribution sees North America and Europe holding dominant positions, but emerging markets in Asia-Pacific and the Middle East are witnessing significant growth potential due to increasing defense budgets and modernization initiatives. The market's future hinges on factors such as technological breakthroughs, shifting geopolitical landscapes, and evolving military strategies.
Military Armored Vehicles and Counter-IED Vehicles Company Market Share
Military Armored Vehicles and Counter-IED Vehicles Market Report: 2019-2033
This comprehensive report provides an in-depth analysis of the Military Armored Vehicles and Counter-IED Vehicles market, encompassing market dynamics, growth trends, regional analysis, product landscape, key players, and future outlook. The report covers the period 2019-2033, with a focus on the forecast period 2025-2033 and a base year of 2025. This crucial market intelligence is designed for industry professionals, investors, and strategic decision-makers seeking a clear understanding of this vital sector. The parent market is the broader Defense Vehicles Market, while the child market is specifically Military Armored Vehicles and Counter-IED Vehicles.
Military Armored Vehicles and Counter-IED Vehicles Market Dynamics & Structure
This section analyzes the market's competitive landscape, technological advancements, regulatory influences, and market trends. The global market size is estimated at xx million units in 2025, projected to reach xx million units by 2033, exhibiting a CAGR of xx%.
- Market Concentration: The market is moderately concentrated, with key players such as BAE Systems, General Dynamics, Lockheed Martin, Oshkosh Defense, Rheinmetall Defence, and Rostec holding significant market share. The combined market share of these companies is estimated at xx% in 2025.
- Technological Innovation: Continuous advancements in materials science, electronics, and power systems drive innovation, leading to lighter, faster, and better-protected vehicles. Key areas of innovation include advanced armor, active protection systems, and improved situational awareness technologies.
- Regulatory Frameworks: Government regulations concerning vehicle safety, emissions, and export controls significantly impact market dynamics. Variations in these regulations across different regions create unique challenges and opportunities.
- Competitive Product Substitutes: The absence of direct substitutes strengthens the market for specialized military vehicles. However, technological advancements in other sectors could indirectly influence the development of alternative solutions.
- End-User Demographics: The primary end-users are national armies and defense forces globally, with demand driven by geopolitical factors and defense budgets.
- M&A Trends: The sector has witnessed a moderate level of mergers and acquisitions in recent years, with xx major deals recorded between 2019 and 2024, valued at approximately xx million USD. These deals primarily focused on consolidating market share and accessing new technologies. Innovation barriers include high R&D costs and stringent military certification processes.
Military Armored Vehicles and Counter-IED Vehicles Growth Trends & Insights
The global market for military armored vehicles and counter-IED vehicles experienced fluctuating growth during the historical period (2019-2024) due to geopolitical events and varying defense spending patterns across different countries. However, the forecast period (2025-2033) projects a steady increase in demand driven by increasing global instability, modernization of armed forces, and the growing need for enhanced protection against IED threats. Adoption rates are influenced by factors such as defense budgets, technological advancements, and regional conflicts. Technological disruptions, such as the introduction of unmanned ground vehicles (UGVs) and AI-powered systems, are expected to reshape the market landscape. Shifts in consumer behavior – primarily manifested by end-user preferences for enhanced protection, mobility, and technological integration – are also driving market growth.
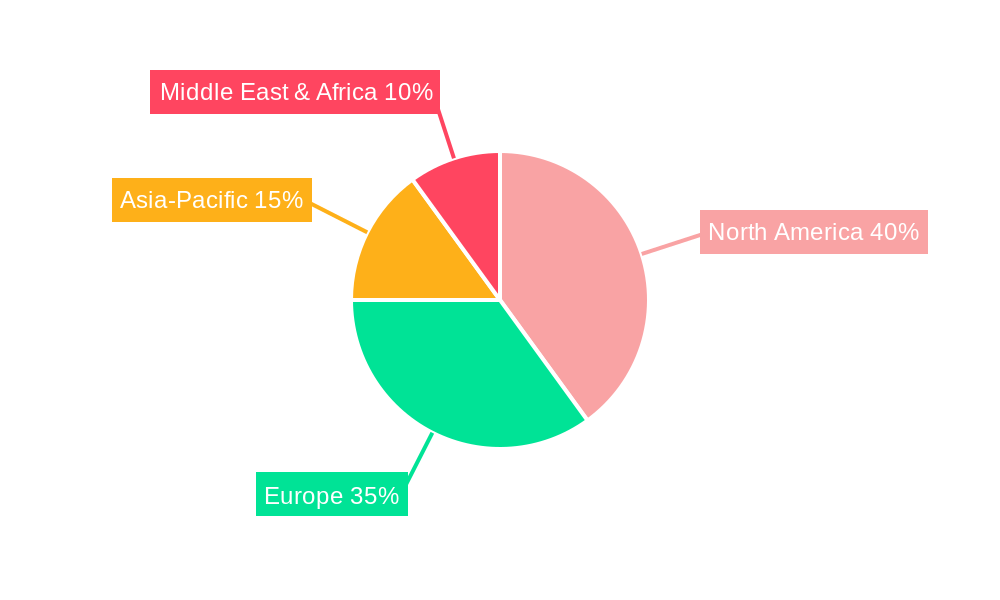
Dominant Regions, Countries, or Segments in Military Armored Vehicles and Counter-IED Vehicles
North America, particularly the United States, holds a dominant position in the market, driven by robust defense budgets, advanced technological capabilities, and a strong domestic manufacturing base. The region accounted for approximately xx% of the global market in 2025.
- Key Drivers for North American Dominance:
- High defense spending
- Advanced technological expertise
- Established manufacturing infrastructure
- Strong government support for defense industries
Europe also holds a significant market share, driven by strong defense budgets in several European countries and the growing demand for modern military equipment. Other regions, such as Asia-Pacific, are witnessing increasing market growth due to rising defense budgets and regional geopolitical tensions. The Middle East is another crucial market, primarily fueled by regional conflicts and the subsequent need for enhanced security. Specific countries like the U.S., UK, Germany, and Saudi Arabia exhibit significant growth potential due to substantial defense modernization programs and procurement plans.
Military Armored Vehicles and Counter-IED Vehicles Product Landscape
The market encompasses a diverse range of armored vehicles, including light, medium, and heavy armored personnel carriers (APCs), infantry fighting vehicles (IFVs), and counter-IED vehicles (specifically MRAPs and similar platforms). Continuous product innovation focuses on enhanced protection against ballistic threats, IEDs, and mines. Key technological advancements include the integration of advanced sensor systems, improved mobility features, and the incorporation of remotely operated weapon stations (RWS). Unique selling propositions are often centered around superior protection levels, enhanced situational awareness, and optimized operational effectiveness.
Key Drivers, Barriers & Challenges in Military Armored Vehicles and Counter-IED Vehicles
Key Drivers: Increased global defense spending, modernization of armed forces, counter-terrorism efforts, and technological advancements drive market growth. The growing threat of asymmetric warfare and the need for superior protection against IEDs further accelerate market expansion.
Challenges and Restraints: High production costs, stringent regulatory requirements, fluctuating global economic conditions, and competition from other defense equipment manufacturers pose significant challenges. Supply chain disruptions, particularly concerning specialized components and materials, can also impact production and market stability. These constraints can lead to delays in procurement and project implementation. The impact of these challenges is estimated to restrain market growth by approximately xx% annually in the forecast period.
Emerging Opportunities in Military Armored Vehicles and Counter-IED Vehicles
Emerging opportunities lie in the development of unmanned and autonomous armored vehicles, lightweight and modular designs, and the integration of advanced communication and networking capabilities. Untapped markets in developing nations and the increasing demand for customized solutions also represent significant growth prospects. The incorporation of AI and machine learning for improved threat detection and response systems presents further opportunities for innovation.
Growth Accelerators in the Military Armored Vehicles and Counter-IED Vehicles Industry
Technological breakthroughs in armor materials, propulsion systems, and integrated sensor technology are major growth catalysts. Strategic partnerships between defense contractors and technology companies, focused on incorporating advanced technologies into armored vehicle designs, are also driving market expansion. The continuous modernization and expansion of armed forces worldwide further fuels market growth.
Key Players Shaping the Military Armored Vehicles and Counter-IED Vehicles Market
Notable Milestones in Military Armored Vehicles and Counter-IED Vehicles Sector
- 2020: Introduction of a new generation of lightweight armored vehicles by BAE Systems.
- 2021: General Dynamics secured a major contract for the supply of upgraded APCs.
- 2022: Lockheed Martin unveiled a new active protection system for armored vehicles.
- 2023: Rheinmetall Defence announced a significant investment in the development of autonomous armored platforms.
- 2024: Oshkosh Defense launched a new MRAP variant with enhanced counter-IED capabilities.
In-Depth Military Armored Vehicles and Counter-IED Vehicles Market Outlook
The long-term outlook for the military armored vehicles and counter-IED vehicles market remains positive, driven by continued technological advancements, increasing global defense spending, and the persistent need for enhanced security solutions. Strategic partnerships, focus on innovation, and the development of next-generation armored vehicles will shape future market dynamics. The market is poised for significant growth, offering lucrative opportunities for companies that can successfully navigate the challenges and capitalize on emerging trends.
Military Armored Vehicles and Counter-IED Vehicles Segmentation
-
1. Application
- 1.1. Infantry Fighting Vehicle (IFV)
- 1.2. Armored Personnel Carrier (APC)
- 1.3. Main Battle Tank (MBT)
- 1.4. Self-propelled Howitzer (SPH)
- 1.5. Others
-
2. Types
- 2.1. Military Armored Vehicles
- 2.2. Counter-IED Vehicles
Military Armored Vehicles and Counter-IED Vehicles Segmentation By Geography
-
1. North America
- 1.1. United States
- 1.2. Canada
- 1.3. Mexico
-
2. South America
- 2.1. Brazil
- 2.2. Argentina
- 2.3. Rest of South America
-
3. Europe
- 3.1. United Kingdom
- 3.2. Germany
- 3.3. France
- 3.4. Italy
- 3.5. Spain
- 3.6. Russia
- 3.7. Benelux
- 3.8. Nordics
- 3.9. Rest of Europe
-
4. Middle East & Africa
- 4.1. Turkey
- 4.2. Israel
- 4.3. GCC
- 4.4. North Africa
- 4.5. South Africa
- 4.6. Rest of Middle East & Africa
-
5. Asia Pacific
- 5.1. China
- 5.2. India
- 5.3. Japan
- 5.4. South Korea
- 5.5. ASEAN
- 5.6. Oceania
- 5.7. Rest of Asia Pacific
Military Armored Vehicles and Counter-IED Vehicles Regional Market Share
Geographic Coverage of Military Armored Vehicles and Counter-IED Vehicles
Military Armored Vehicles and Counter-IED Vehicles REPORT HIGHLIGHTS
| Aspects | Details |
|---|---|
| Study Period | 2020-2034 |
| Base Year | 2025 |
| Estimated Year | 2026 |
| Forecast Period | 2026-2034 |
| Historical Period | 2020-2025 |
| Growth Rate | CAGR of 3.3% from 2020-2034 |
| Segmentation |
|
Table of Contents
- 1. Introduction
- 1.1. Research Scope
- 1.2. Market Segmentation
- 1.3. Research Methodology
- 1.4. Definitions and Assumptions
- 2. Executive Summary
- 2.1. Introduction
- 3. Market Dynamics
- 3.1. Introduction
- 3.2. Market Drivers
- 3.3. Market Restrains
- 3.4. Market Trends
- 4. Market Factor Analysis
- 4.1. Porters Five Forces
- 4.2. Supply/Value Chain
- 4.3. PESTEL analysis
- 4.4. Market Entropy
- 4.5. Patent/Trademark Analysis
- 5. Global Military Armored Vehicles and Counter-IED Vehicles Analysis, Insights and Forecast, 2020-2032
- 5.1. Market Analysis, Insights and Forecast - by Application
- 5.1.1. Infantry Fighting Vehicle (IFV)
- 5.1.2. Armored Personnel Carrier (APC)
- 5.1.3. Main Battle Tank (MBT)
- 5.1.4. Self-propelled Howitzer (SPH)
- 5.1.5. Others
- 5.2. Market Analysis, Insights and Forecast - by Types
- 5.2.1. Military Armored Vehicles
- 5.2.2. Counter-IED Vehicles
- 5.3. Market Analysis, Insights and Forecast - by Region
- 5.3.1. North America
- 5.3.2. South America
- 5.3.3. Europe
- 5.3.4. Middle East & Africa
- 5.3.5. Asia Pacific
- 5.1. Market Analysis, Insights and Forecast - by Application
- 6. North America Military Armored Vehicles and Counter-IED Vehicles Analysis, Insights and Forecast, 2020-2032
- 6.1. Market Analysis, Insights and Forecast - by Application
- 6.1.1. Infantry Fighting Vehicle (IFV)
- 6.1.2. Armored Personnel Carrier (APC)
- 6.1.3. Main Battle Tank (MBT)
- 6.1.4. Self-propelled Howitzer (SPH)
- 6.1.5. Others
- 6.2. Market Analysis, Insights and Forecast - by Types
- 6.2.1. Military Armored Vehicles
- 6.2.2. Counter-IED Vehicles
- 6.1. Market Analysis, Insights and Forecast - by Application
- 7. South America Military Armored Vehicles and Counter-IED Vehicles Analysis, Insights and Forecast, 2020-2032
- 7.1. Market Analysis, Insights and Forecast - by Application
- 7.1.1. Infantry Fighting Vehicle (IFV)
- 7.1.2. Armored Personnel Carrier (APC)
- 7.1.3. Main Battle Tank (MBT)
- 7.1.4. Self-propelled Howitzer (SPH)
- 7.1.5. Others
- 7.2. Market Analysis, Insights and Forecast - by Types
- 7.2.1. Military Armored Vehicles
- 7.2.2. Counter-IED Vehicles
- 7.1. Market Analysis, Insights and Forecast - by Application
- 8. Europe Military Armored Vehicles and Counter-IED Vehicles Analysis, Insights and Forecast, 2020-2032
- 8.1. Market Analysis, Insights and Forecast - by Application
- 8.1.1. Infantry Fighting Vehicle (IFV)
- 8.1.2. Armored Personnel Carrier (APC)
- 8.1.3. Main Battle Tank (MBT)
- 8.1.4. Self-propelled Howitzer (SPH)
- 8.1.5. Others
- 8.2. Market Analysis, Insights and Forecast - by Types
- 8.2.1. Military Armored Vehicles
- 8.2.2. Counter-IED Vehicles
- 8.1. Market Analysis, Insights and Forecast - by Application
- 9. Middle East & Africa Military Armored Vehicles and Counter-IED Vehicles Analysis, Insights and Forecast, 2020-2032
- 9.1. Market Analysis, Insights and Forecast - by Application
- 9.1.1. Infantry Fighting Vehicle (IFV)
- 9.1.2. Armored Personnel Carrier (APC)
- 9.1.3. Main Battle Tank (MBT)
- 9.1.4. Self-propelled Howitzer (SPH)
- 9.1.5. Others
- 9.2. Market Analysis, Insights and Forecast - by Types
- 9.2.1. Military Armored Vehicles
- 9.2.2. Counter-IED Vehicles
- 9.1. Market Analysis, Insights and Forecast - by Application
- 10. Asia Pacific Military Armored Vehicles and Counter-IED Vehicles Analysis, Insights and Forecast, 2020-2032
- 10.1. Market Analysis, Insights and Forecast - by Application
- 10.1.1. Infantry Fighting Vehicle (IFV)
- 10.1.2. Armored Personnel Carrier (APC)
- 10.1.3. Main Battle Tank (MBT)
- 10.1.4. Self-propelled Howitzer (SPH)
- 10.1.5. Others
- 10.2. Market Analysis, Insights and Forecast - by Types
- 10.2.1. Military Armored Vehicles
- 10.2.2. Counter-IED Vehicles
- 10.1. Market Analysis, Insights and Forecast - by Application
- 11. Competitive Analysis
- 11.1. Global Market Share Analysis 2025
- 11.2. Company Profiles
- 11.2.1 BAE Systems
- 11.2.1.1. Overview
- 11.2.1.2. Products
- 11.2.1.3. SWOT Analysis
- 11.2.1.4. Recent Developments
- 11.2.1.5. Financials (Based on Availability)
- 11.2.2 General Dynamics
- 11.2.2.1. Overview
- 11.2.2.2. Products
- 11.2.2.3. SWOT Analysis
- 11.2.2.4. Recent Developments
- 11.2.2.5. Financials (Based on Availability)
- 11.2.3 Lockheed Martin
- 11.2.3.1. Overview
- 11.2.3.2. Products
- 11.2.3.3. SWOT Analysis
- 11.2.3.4. Recent Developments
- 11.2.3.5. Financials (Based on Availability)
- 11.2.4 OSHKOSH DEFENSE
- 11.2.4.1. Overview
- 11.2.4.2. Products
- 11.2.4.3. SWOT Analysis
- 11.2.4.4. Recent Developments
- 11.2.4.5. Financials (Based on Availability)
- 11.2.5 Rheinmetall Defence
- 11.2.5.1. Overview
- 11.2.5.2. Products
- 11.2.5.3. SWOT Analysis
- 11.2.5.4. Recent Developments
- 11.2.5.5. Financials (Based on Availability)
- 11.2.6 Rostec
- 11.2.6.1. Overview
- 11.2.6.2. Products
- 11.2.6.3. SWOT Analysis
- 11.2.6.4. Recent Developments
- 11.2.6.5. Financials (Based on Availability)
- 11.2.1 BAE Systems
List of Figures
- Figure 1: Global Military Armored Vehicles and Counter-IED Vehicles Revenue Breakdown (undefined, %) by Region 2025 & 2033
- Figure 2: North America Military Armored Vehicles and Counter-IED Vehicles Revenue (undefined), by Application 2025 & 2033
- Figure 3: North America Military Armored Vehicles and Counter-IED Vehicles Revenue Share (%), by Application 2025 & 2033
- Figure 4: North America Military Armored Vehicles and Counter-IED Vehicles Revenue (undefined), by Types 2025 & 2033
- Figure 5: North America Military Armored Vehicles and Counter-IED Vehicles Revenue Share (%), by Types 2025 & 2033
- Figure 6: North America Military Armored Vehicles and Counter-IED Vehicles Revenue (undefined), by Country 2025 & 2033
- Figure 7: North America Military Armored Vehicles and Counter-IED Vehicles Revenue Share (%), by Country 2025 & 2033
- Figure 8: South America Military Armored Vehicles and Counter-IED Vehicles Revenue (undefined), by Application 2025 & 2033
- Figure 9: South America Military Armored Vehicles and Counter-IED Vehicles Revenue Share (%), by Application 2025 & 2033
- Figure 10: South America Military Armored Vehicles and Counter-IED Vehicles Revenue (undefined), by Types 2025 & 2033
- Figure 11: South America Military Armored Vehicles and Counter-IED Vehicles Revenue Share (%), by Types 2025 & 2033
- Figure 12: South America Military Armored Vehicles and Counter-IED Vehicles Revenue (undefined), by Country 2025 & 2033
- Figure 13: South America Military Armored Vehicles and Counter-IED Vehicles Revenue Share (%), by Country 2025 & 2033
- Figure 14: Europe Military Armored Vehicles and Counter-IED Vehicles Revenue (undefined), by Application 2025 & 2033
- Figure 15: Europe Military Armored Vehicles and Counter-IED Vehicles Revenue Share (%), by Application 2025 & 2033
- Figure 16: Europe Military Armored Vehicles and Counter-IED Vehicles Revenue (undefined), by Types 2025 & 2033
- Figure 17: Europe Military Armored Vehicles and Counter-IED Vehicles Revenue Share (%), by Types 2025 & 2033
- Figure 18: Europe Military Armored Vehicles and Counter-IED Vehicles Revenue (undefined), by Country 2025 & 2033
- Figure 19: Europe Military Armored Vehicles and Counter-IED Vehicles Revenue Share (%), by Country 2025 & 2033
- Figure 20: Middle East & Africa Military Armored Vehicles and Counter-IED Vehicles Revenue (undefined), by Application 2025 & 2033
- Figure 21: Middle East & Africa Military Armored Vehicles and Counter-IED Vehicles Revenue Share (%), by Application 2025 & 2033
- Figure 22: Middle East & Africa Military Armored Vehicles and Counter-IED Vehicles Revenue (undefined), by Types 2025 & 2033
- Figure 23: Middle East & Africa Military Armored Vehicles and Counter-IED Vehicles Revenue Share (%), by Types 2025 & 2033
- Figure 24: Middle East & Africa Military Armored Vehicles and Counter-IED Vehicles Revenue (undefined), by Country 2025 & 2033
- Figure 25: Middle East & Africa Military Armored Vehicles and Counter-IED Vehicles Revenue Share (%), by Country 2025 & 2033
- Figure 26: Asia Pacific Military Armored Vehicles and Counter-IED Vehicles Revenue (undefined), by Application 2025 & 2033
- Figure 27: Asia Pacific Military Armored Vehicles and Counter-IED Vehicles Revenue Share (%), by Application 2025 & 2033
- Figure 28: Asia Pacific Military Armored Vehicles and Counter-IED Vehicles Revenue (undefined), by Types 2025 & 2033
- Figure 29: Asia Pacific Military Armored Vehicles and Counter-IED Vehicles Revenue Share (%), by Types 2025 & 2033
- Figure 30: Asia Pacific Military Armored Vehicles and Counter-IED Vehicles Revenue (undefined), by Country 2025 & 2033
- Figure 31: Asia Pacific Military Armored Vehicles and Counter-IED Vehicles Revenue Share (%), by Country 2025 & 2033
List of Tables
- Table 1: Global Military Armored Vehicles and Counter-IED Vehicles Revenue undefined Forecast, by Application 2020 & 2033
- Table 2: Global Military Armored Vehicles and Counter-IED Vehicles Revenue undefined Forecast, by Types 2020 & 2033
- Table 3: Global Military Armored Vehicles and Counter-IED Vehicles Revenue undefined Forecast, by Region 2020 & 2033
- Table 4: Global Military Armored Vehicles and Counter-IED Vehicles Revenue undefined Forecast, by Application 2020 & 2033
- Table 5: Global Military Armored Vehicles and Counter-IED Vehicles Revenue undefined Forecast, by Types 2020 & 2033
- Table 6: Global Military Armored Vehicles and Counter-IED Vehicles Revenue undefined Forecast, by Country 2020 & 2033
- Table 7: United States Military Armored Vehicles and Counter-IED Vehicles Revenue (undefined) Forecast, by Application 2020 & 2033
- Table 8: Canada Military Armored Vehicles and Counter-IED Vehicles Revenue (undefined) Forecast, by Application 2020 & 2033
- Table 9: Mexico Military Armored Vehicles and Counter-IED Vehicles Revenue (undefined) Forecast, by Application 2020 & 2033
- Table 10: Global Military Armored Vehicles and Counter-IED Vehicles Revenue undefined Forecast, by Application 2020 & 2033
- Table 11: Global Military Armored Vehicles and Counter-IED Vehicles Revenue undefined Forecast, by Types 2020 & 2033
- Table 12: Global Military Armored Vehicles and Counter-IED Vehicles Revenue undefined Forecast, by Country 2020 & 2033
- Table 13: Brazil Military Armored Vehicles and Counter-IED Vehicles Revenue (undefined) Forecast, by Application 2020 & 2033
- Table 14: Argentina Military Armored Vehicles and Counter-IED Vehicles Revenue (undefined) Forecast, by Application 2020 & 2033
- Table 15: Rest of South America Military Armored Vehicles and Counter-IED Vehicles Revenue (undefined) Forecast, by Application 2020 & 2033
- Table 16: Global Military Armored Vehicles and Counter-IED Vehicles Revenue undefined Forecast, by Application 2020 & 2033
- Table 17: Global Military Armored Vehicles and Counter-IED Vehicles Revenue undefined Forecast, by Types 2020 & 2033
- Table 18: Global Military Armored Vehicles and Counter-IED Vehicles Revenue undefined Forecast, by Country 2020 & 2033
- Table 19: United Kingdom Military Armored Vehicles and Counter-IED Vehicles Revenue (undefined) Forecast, by Application 2020 & 2033
- Table 20: Germany Military Armored Vehicles and Counter-IED Vehicles Revenue (undefined) Forecast, by Application 2020 & 2033
- Table 21: France Military Armored Vehicles and Counter-IED Vehicles Revenue (undefined) Forecast, by Application 2020 & 2033
- Table 22: Italy Military Armored Vehicles and Counter-IED Vehicles Revenue (undefined) Forecast, by Application 2020 & 2033
- Table 23: Spain Military Armored Vehicles and Counter-IED Vehicles Revenue (undefined) Forecast, by Application 2020 & 2033
- Table 24: Russia Military Armored Vehicles and Counter-IED Vehicles Revenue (undefined) Forecast, by Application 2020 & 2033
- Table 25: Benelux Military Armored Vehicles and Counter-IED Vehicles Revenue (undefined) Forecast, by Application 2020 & 2033
- Table 26: Nordics Military Armored Vehicles and Counter-IED Vehicles Revenue (undefined) Forecast, by Application 2020 & 2033
- Table 27: Rest of Europe Military Armored Vehicles and Counter-IED Vehicles Revenue (undefined) Forecast, by Application 2020 & 2033
- Table 28: Global Military Armored Vehicles and Counter-IED Vehicles Revenue undefined Forecast, by Application 2020 & 2033
- Table 29: Global Military Armored Vehicles and Counter-IED Vehicles Revenue undefined Forecast, by Types 2020 & 2033
- Table 30: Global Military Armored Vehicles and Counter-IED Vehicles Revenue undefined Forecast, by Country 2020 & 2033
- Table 31: Turkey Military Armored Vehicles and Counter-IED Vehicles Revenue (undefined) Forecast, by Application 2020 & 2033
- Table 32: Israel Military Armored Vehicles and Counter-IED Vehicles Revenue (undefined) Forecast, by Application 2020 & 2033
- Table 33: GCC Military Armored Vehicles and Counter-IED Vehicles Revenue (undefined) Forecast, by Application 2020 & 2033
- Table 34: North Africa Military Armored Vehicles and Counter-IED Vehicles Revenue (undefined) Forecast, by Application 2020 & 2033
- Table 35: South Africa Military Armored Vehicles and Counter-IED Vehicles Revenue (undefined) Forecast, by Application 2020 & 2033
- Table 36: Rest of Middle East & Africa Military Armored Vehicles and Counter-IED Vehicles Revenue (undefined) Forecast, by Application 2020 & 2033
- Table 37: Global Military Armored Vehicles and Counter-IED Vehicles Revenue undefined Forecast, by Application 2020 & 2033
- Table 38: Global Military Armored Vehicles and Counter-IED Vehicles Revenue undefined Forecast, by Types 2020 & 2033
- Table 39: Global Military Armored Vehicles and Counter-IED Vehicles Revenue undefined Forecast, by Country 2020 & 2033
- Table 40: China Military Armored Vehicles and Counter-IED Vehicles Revenue (undefined) Forecast, by Application 2020 & 2033
- Table 41: India Military Armored Vehicles and Counter-IED Vehicles Revenue (undefined) Forecast, by Application 2020 & 2033
- Table 42: Japan Military Armored Vehicles and Counter-IED Vehicles Revenue (undefined) Forecast, by Application 2020 & 2033
- Table 43: South Korea Military Armored Vehicles and Counter-IED Vehicles Revenue (undefined) Forecast, by Application 2020 & 2033
- Table 44: ASEAN Military Armored Vehicles and Counter-IED Vehicles Revenue (undefined) Forecast, by Application 2020 & 2033
- Table 45: Oceania Military Armored Vehicles and Counter-IED Vehicles Revenue (undefined) Forecast, by Application 2020 & 2033
- Table 46: Rest of Asia Pacific Military Armored Vehicles and Counter-IED Vehicles Revenue (undefined) Forecast, by Application 2020 & 2033
Frequently Asked Questions
1. What is the projected Compound Annual Growth Rate (CAGR) of the Military Armored Vehicles and Counter-IED Vehicles?
The projected CAGR is approximately 3.3%.
2. Which companies are prominent players in the Military Armored Vehicles and Counter-IED Vehicles?
Key companies in the market include BAE Systems, General Dynamics, Lockheed Martin, OSHKOSH DEFENSE, Rheinmetall Defence, Rostec.
3. What are the main segments of the Military Armored Vehicles and Counter-IED Vehicles?
The market segments include Application, Types.
4. Can you provide details about the market size?
The market size is estimated to be USD XXX N/A as of 2022.
5. What are some drivers contributing to market growth?
N/A
6. What are the notable trends driving market growth?
N/A
7. Are there any restraints impacting market growth?
N/A
8. Can you provide examples of recent developments in the market?
N/A
9. What pricing options are available for accessing the report?
Pricing options include single-user, multi-user, and enterprise licenses priced at USD 4900.00, USD 7350.00, and USD 9800.00 respectively.
10. Is the market size provided in terms of value or volume?
The market size is provided in terms of value, measured in N/A.
11. Are there any specific market keywords associated with the report?
Yes, the market keyword associated with the report is "Military Armored Vehicles and Counter-IED Vehicles," which aids in identifying and referencing the specific market segment covered.
12. How do I determine which pricing option suits my needs best?
The pricing options vary based on user requirements and access needs. Individual users may opt for single-user licenses, while businesses requiring broader access may choose multi-user or enterprise licenses for cost-effective access to the report.
13. Are there any additional resources or data provided in the Military Armored Vehicles and Counter-IED Vehicles report?
While the report offers comprehensive insights, it's advisable to review the specific contents or supplementary materials provided to ascertain if additional resources or data are available.
14. How can I stay updated on further developments or reports in the Military Armored Vehicles and Counter-IED Vehicles?
To stay informed about further developments, trends, and reports in the Military Armored Vehicles and Counter-IED Vehicles, consider subscribing to industry newsletters, following relevant companies and organizations, or regularly checking reputable industry news sources and publications.
Methodology
Step 1 - Identification of Relevant Samples Size from Population Database


Step 2 - Approaches for Defining Global Market Size (Value, Volume* & Price*)

Note*: In applicable scenarios
Step 3 - Data Sources
Primary Research
- Web Analytics
- Survey Reports
- Research Institute
- Latest Research Reports
- Opinion Leaders
Secondary Research
- Annual Reports
- White Paper
- Latest Press Release
- Industry Association
- Paid Database
- Investor Presentations

Step 4 - Data Triangulation
Involves using different sources of information in order to increase the validity of a study
These sources are likely to be stakeholders in a program - participants, other researchers, program staff, other community members, and so on.
Then we put all data in single framework & apply various statistical tools to find out the dynamic on the market.
During the analysis stage, feedback from the stakeholder groups would be compared to determine areas of agreement as well as areas of divergence