

Key Insights
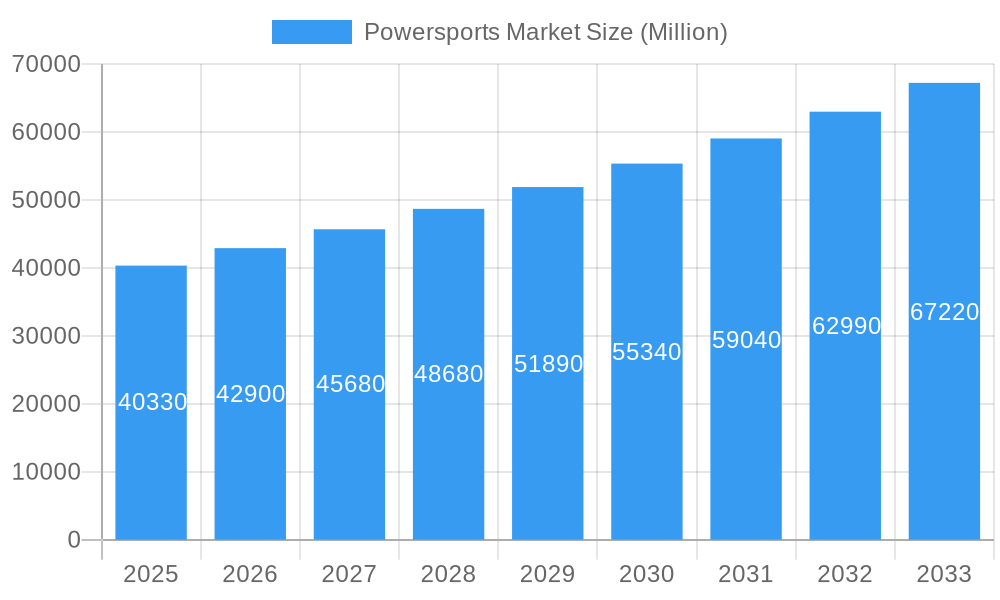
The powersports market, encompassing vehicles like ATVs, motorcycles, snowmobiles, and personal watercraft, is experiencing robust growth, projected to reach a market size of $40.33 billion in 2025 and maintain a Compound Annual Growth Rate (CAGR) of 6.29% from 2025 to 2033. This expansion is fueled by several key factors. Increasing disposable incomes, particularly in developing economies across Asia-Pacific, are driving demand for recreational vehicles. Furthermore, a growing interest in outdoor adventure activities and ecotourism is contributing to higher sales. Technological advancements, including the integration of electric propulsion systems and advanced safety features, are enhancing the appeal of powersports vehicles to a wider consumer base. The market segmentation reveals strong performance across various vehicle types, with ATVs and personal watercraft expected to lead the growth due to their versatility and accessibility. The shift towards electric propulsion is also impacting the market, albeit slowly, due to higher initial costs and limited charging infrastructure. However, government initiatives promoting sustainable transportation and environmental consciousness are likely to boost the adoption of electric powersports vehicles in the coming years. Regional analysis suggests North America and Europe will continue to be major markets, but Asia-Pacific is poised for significant expansion due to its burgeoning middle class and increasing popularity of outdoor recreation.
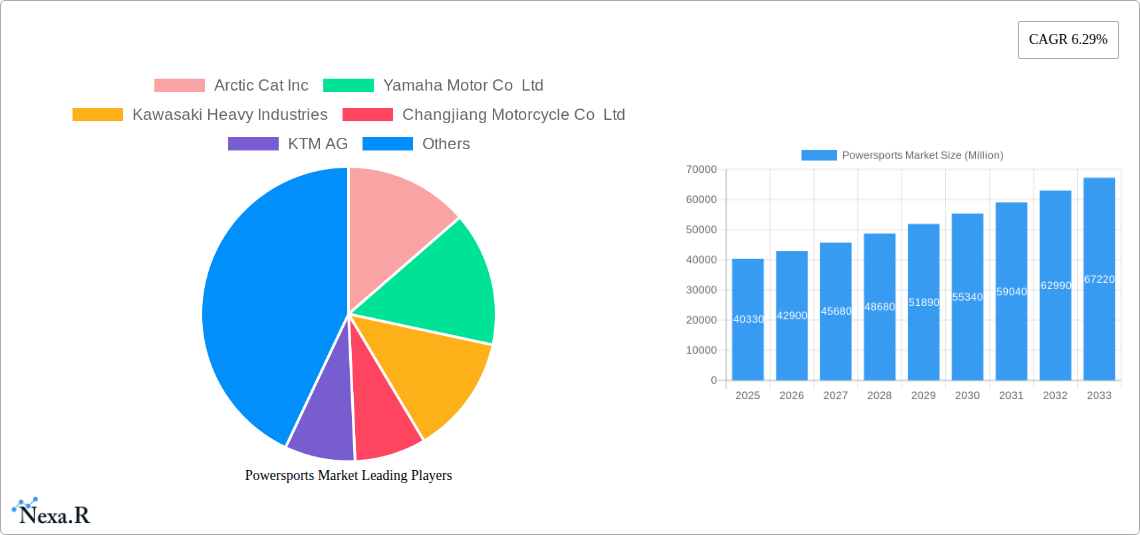
Powersports Market Market Size (In Billion)
The competitive landscape is characterized by established players like Polaris, Yamaha, and Arctic Cat, alongside emerging manufacturers from Asia. Intense competition is fostering innovation and driving down prices, making powersports vehicles more accessible. However, factors such as stringent emission regulations and increasing raw material costs pose challenges to the market's sustained growth. Manufacturers are responding to these challenges by investing in research and development to produce more fuel-efficient and environmentally friendly vehicles. This combination of strong growth drivers, technological advancements, and competitive dynamics indicates a promising outlook for the powersports market in the coming decade, though careful navigation of regulatory hurdles and cost pressures will remain crucial for sustained success.
Powersports Market Company Market Share
Powersports Market: A Comprehensive Market Report (2019-2033)
This in-depth report provides a comprehensive analysis of the global Powersports market, encompassing historical data (2019-2024), current estimates (2025), and future forecasts (2025-2033). We delve into market dynamics, growth trends, regional performance, product landscapes, key players, and emerging opportunities within the parent market and its key segments – All-terrain vehicles (ATVs), personal watercrafts (PWCs), heavy-weight motorcycles, side-by-side vehicles (SxS), and snowmobiles. The report is essential for industry professionals, investors, and strategic decision-makers seeking a clear understanding of this dynamic market. The market size is presented in million units.
Powersports Market Dynamics & Structure
The Powersports market is characterized by a moderately concentrated landscape, with key players like Polaris Inc, Yamaha Motor Co Ltd, and Honda Motor Co Ltd holding significant market share. Technological innovation, particularly in electric propulsion and advanced safety features, is a crucial growth driver. Stringent emission regulations and safety standards across various regions impose significant regulatory influence. The market faces competition from substitute recreational activities and products, influencing consumer choices. End-user demographics are evolving, with a growing interest from younger generations and an increasing demand for versatile, technologically advanced vehicles. The market has witnessed considerable M&A activity, reflecting consolidation and expansion strategies amongst major players.
- Market Concentration: Moderately concentrated, with top 5 players holding approximately xx% market share (2024).
- Technological Innovation: Focus on electric propulsion, advanced rider-assistance systems, and connected technology.
- Regulatory Framework: Stringent emission and safety standards impacting product development and cost.
- Competitive Substitutes: Other recreational activities like hiking, cycling, and water sports pose indirect competition.
- End-User Demographics: Shift towards younger demographics and increased demand for technology-integrated vehicles.
- M&A Trends: Significant consolidation, with xx major M&A deals observed between 2019-2024.
Powersports Market Growth Trends & Insights
The global Powersports market has experienced consistent growth over the historical period (2019-2024), driven by rising disposable incomes, increasing leisure activities, and technological advancements. The market is projected to maintain a healthy Compound Annual Growth Rate (CAGR) of xx% during the forecast period (2025-2033), reaching an estimated xx million units by 2033. Adoption rates are influenced by factors such as pricing, technological advancements, and consumer preferences. The rise of electric vehicles (EVs) is disrupting the traditional gasoline-powered segment, presenting both opportunities and challenges for manufacturers. Changing consumer behaviors, such as preference for customized features and eco-friendly options, are shaping product development and marketing strategies.
Dominant Regions, Countries, or Segments in Powersports Market
North America currently dominates the Powersports market, accounting for approximately xx% of the global market share in 2024, primarily driven by strong demand in the United States and Canada. Within vehicle types, ATVs and side-by-side vehicles exhibit robust growth potential due to their versatility and appeal to diverse consumer segments. The gasoline propulsion segment continues to lead, but the electric segment is rapidly gaining traction owing to increasing environmental concerns and government incentives. The off-road application segment is particularly strong, reflecting the popularity of outdoor recreational activities.
- Key Growth Drivers:
- Strong consumer demand in North America and Europe.
- Expanding outdoor recreation activities.
- Growing preference for versatile vehicles like ATVs and SxS.
- Technological advancements and innovation in electric vehicles.
- Dominance Factors:
- Established market presence in North America.
- Strong consumer base with high purchasing power.
- Favorable government policies and infrastructure supporting recreational activities.
Powersports Market Product Landscape
The Powersports market showcases a diverse range of vehicles, from high-performance motorcycles to versatile ATVs and comfortable side-by-side vehicles. Recent innovations focus on enhanced safety features, improved fuel efficiency (in gasoline models), and increased rider comfort. Electric models are increasingly incorporating advanced battery technology and extended range capabilities. Unique selling propositions include customized configurations, advanced connectivity, and enhanced performance features tailored to diverse user preferences and applications.
Key Drivers, Barriers & Challenges in Powersports Market
Key Drivers:
- Increasing disposable incomes and leisure time.
- Growing popularity of outdoor recreational activities.
- Technological advancements in vehicle design and performance.
- Government initiatives promoting tourism and outdoor recreation.
Key Challenges & Restraints:
- Fluctuations in raw material prices and supply chain disruptions.
- Stringent emission regulations and safety standards.
- Intense competition among established manufacturers.
- Economic downturns impacting consumer spending on discretionary goods.
Emerging Opportunities in Powersports Market
- Untapped Markets: Growth potential in emerging economies with rising middle classes and increasing disposable incomes.
- Innovative Applications: Development of specialized vehicles for niche applications, such as commercial use and agricultural tasks.
- Evolving Consumer Preferences: Focus on sustainable and eco-friendly products, including electric and hybrid models.
Growth Accelerators in the Powersports Market Industry
Technological advancements, strategic partnerships, and expansion into new markets are key accelerators for long-term growth. The integration of advanced technologies such as AI and IoT offers significant opportunities for product innovation and enhanced user experience. Strategic collaborations among manufacturers, technology providers, and retailers enhance market reach and product development. Expansion into new and emerging markets, particularly in developing economies with growing middle classes, offers untapped potential.
Key Players Shaping the Powersports Market Market
- Arctic Cat Inc
- Yamaha Motor Co Ltd
- Kawasaki Heavy Industries
- Changjiang Motorcycle Co Ltd
- KTM AG
- Harley-Davidson Inc
- BRP Inc
- Honda Motor Co Ltd
- Polaris Inc
- Suzuki Motor Corporation
Notable Milestones in Powersports Market Sector
- January 2024: Patrick Industries acquires a supplier for Powersports OEMs, expanding its market presence.
- January 2024: Patrick Industries Inc. acquires Sportech LLC, further strengthening its position in the Powersports market.
- March 2023: Polaris launches Polaris Xchange, an OEM-supported marketplace for pre-owned Powersports vehicles.
- October 2023: Cardo Systems partners with 509 to integrate communication technology into 509's helmet line.
In-Depth Powersports Market Market Outlook
The Powersports market exhibits strong growth potential driven by ongoing technological innovation, increasing consumer demand, and strategic market expansion. Opportunities abound in the electric vehicle segment, sustainable materials, and enhanced safety features. Strategic partnerships and collaborations among players will play a crucial role in driving innovation and market penetration. The focus on enhanced user experience and customized solutions will further solidify market growth in the coming years.
Powersports Market Segmentation
-
1. Vehicle type
- 1.1. Personal watercrafts
- 1.2. All-terrain vehicles
- 1.3. Heavy weight motorcycles
- 1.4. Side by side vehicles
- 1.5. Snow mobiles
-
2. Propulsion
- 2.1. Diesel
- 2.2. Gasoline
- 2.3. Electric
-
3. Application
- 3.1. On-Road
- 3.2. Off-Road
Powersports Market Segmentation By Geography
-
1. North America
- 1.1. US
- 1.2. Canada
- 1.3. Mexico
- 1.4. Rest of North America
-
2. Europe
- 2.1. Germany
- 2.2. UK
- 2.3. France
- 2.4. Russia
- 2.5. Spain
- 2.6. Rest of Europe
-
3. Asia Pacific
- 3.1. India
- 3.2. China
- 3.3. Japan
- 3.4. Rest of Asia Pacific
-
4. South America
- 4.1. Brazil
- 4.2. Argentina
-
5. Middle East
- 5.1. UAE
- 5.2. Saudi Arabia
- 5.3. Rest of Middle East
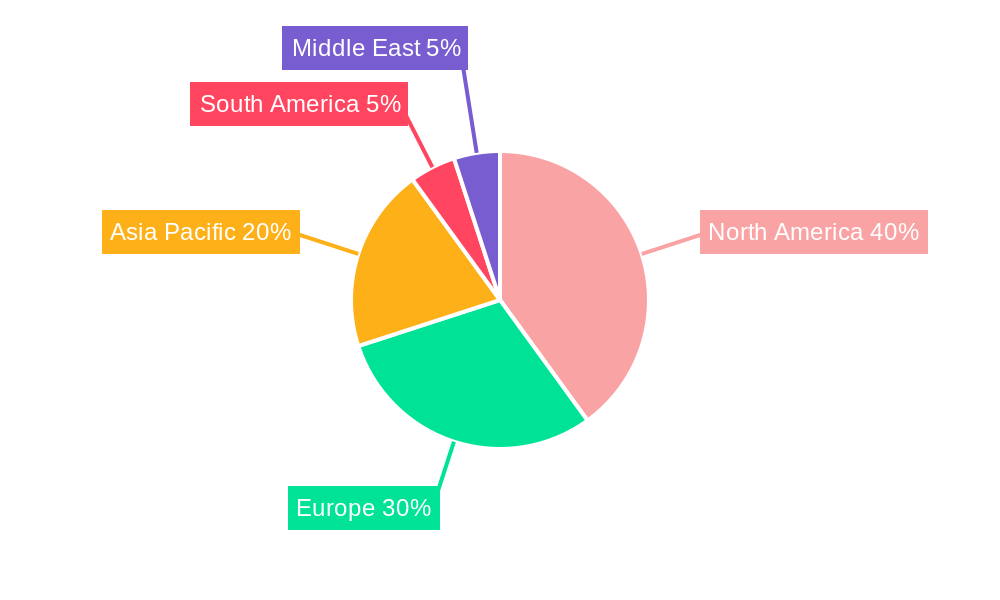
Powersports Market Regional Market Share
Geographic Coverage of Powersports Market
Powersports Market REPORT HIGHLIGHTS
| Aspects | Details |
|---|---|
| Study Period | 2020-2034 |
| Base Year | 2025 |
| Estimated Year | 2026 |
| Forecast Period | 2026-2034 |
| Historical Period | 2020-2025 |
| Growth Rate | CAGR of 6.29% from 2020-2034 |
| Segmentation |
|
Table of Contents
- 1. Introduction
- 1.1. Research Scope
- 1.2. Market Segmentation
- 1.3. Research Methodology
- 1.4. Definitions and Assumptions
- 2. Executive Summary
- 2.1. Introduction
- 3. Market Dynamics
- 3.1. Introduction
- 3.2. Market Drivers
- 3.2.1. Increasing disposable income and consumer preferences for adventure sports propel the market growth
- 3.3. Market Restrains
- 3.3.1. High initial investment and maintenance costs obstruct the market growth
- 3.4. Market Trends
- 3.4.1. Changing Consumer Preferences due to technological Advancements Drives the Demand in the Market
- 4. Market Factor Analysis
- 4.1. Porters Five Forces
- 4.2. Supply/Value Chain
- 4.3. PESTEL analysis
- 4.4. Market Entropy
- 4.5. Patent/Trademark Analysis
- 5. Global Powersports Market Analysis, Insights and Forecast, 2020-2032
- 5.1. Market Analysis, Insights and Forecast - by Vehicle type
- 5.1.1. Personal watercrafts
- 5.1.2. All-terrain vehicles
- 5.1.3. Heavy weight motorcycles
- 5.1.4. Side by side vehicles
- 5.1.5. Snow mobiles
- 5.2. Market Analysis, Insights and Forecast - by Propulsion
- 5.2.1. Diesel
- 5.2.2. Gasoline
- 5.2.3. Electric
- 5.3. Market Analysis, Insights and Forecast - by Application
- 5.3.1. On-Road
- 5.3.2. Off-Road
- 5.4. Market Analysis, Insights and Forecast - by Region
- 5.4.1. North America
- 5.4.2. Europe
- 5.4.3. Asia Pacific
- 5.4.4. South America
- 5.4.5. Middle East
- 5.1. Market Analysis, Insights and Forecast - by Vehicle type
- 6. North America Powersports Market Analysis, Insights and Forecast, 2020-2032
- 6.1. Market Analysis, Insights and Forecast - by Vehicle type
- 6.1.1. Personal watercrafts
- 6.1.2. All-terrain vehicles
- 6.1.3. Heavy weight motorcycles
- 6.1.4. Side by side vehicles
- 6.1.5. Snow mobiles
- 6.2. Market Analysis, Insights and Forecast - by Propulsion
- 6.2.1. Diesel
- 6.2.2. Gasoline
- 6.2.3. Electric
- 6.3. Market Analysis, Insights and Forecast - by Application
- 6.3.1. On-Road
- 6.3.2. Off-Road
- 6.1. Market Analysis, Insights and Forecast - by Vehicle type
- 7. Europe Powersports Market Analysis, Insights and Forecast, 2020-2032
- 7.1. Market Analysis, Insights and Forecast - by Vehicle type
- 7.1.1. Personal watercrafts
- 7.1.2. All-terrain vehicles
- 7.1.3. Heavy weight motorcycles
- 7.1.4. Side by side vehicles
- 7.1.5. Snow mobiles
- 7.2. Market Analysis, Insights and Forecast - by Propulsion
- 7.2.1. Diesel
- 7.2.2. Gasoline
- 7.2.3. Electric
- 7.3. Market Analysis, Insights and Forecast - by Application
- 7.3.1. On-Road
- 7.3.2. Off-Road
- 7.1. Market Analysis, Insights and Forecast - by Vehicle type
- 8. Asia Pacific Powersports Market Analysis, Insights and Forecast, 2020-2032
- 8.1. Market Analysis, Insights and Forecast - by Vehicle type
- 8.1.1. Personal watercrafts
- 8.1.2. All-terrain vehicles
- 8.1.3. Heavy weight motorcycles
- 8.1.4. Side by side vehicles
- 8.1.5. Snow mobiles
- 8.2. Market Analysis, Insights and Forecast - by Propulsion
- 8.2.1. Diesel
- 8.2.2. Gasoline
- 8.2.3. Electric
- 8.3. Market Analysis, Insights and Forecast - by Application
- 8.3.1. On-Road
- 8.3.2. Off-Road
- 8.1. Market Analysis, Insights and Forecast - by Vehicle type
- 9. South America Powersports Market Analysis, Insights and Forecast, 2020-2032
- 9.1. Market Analysis, Insights and Forecast - by Vehicle type
- 9.1.1. Personal watercrafts
- 9.1.2. All-terrain vehicles
- 9.1.3. Heavy weight motorcycles
- 9.1.4. Side by side vehicles
- 9.1.5. Snow mobiles
- 9.2. Market Analysis, Insights and Forecast - by Propulsion
- 9.2.1. Diesel
- 9.2.2. Gasoline
- 9.2.3. Electric
- 9.3. Market Analysis, Insights and Forecast - by Application
- 9.3.1. On-Road
- 9.3.2. Off-Road
- 9.1. Market Analysis, Insights and Forecast - by Vehicle type
- 10. Middle East Powersports Market Analysis, Insights and Forecast, 2020-2032
- 10.1. Market Analysis, Insights and Forecast - by Vehicle type
- 10.1.1. Personal watercrafts
- 10.1.2. All-terrain vehicles
- 10.1.3. Heavy weight motorcycles
- 10.1.4. Side by side vehicles
- 10.1.5. Snow mobiles
- 10.2. Market Analysis, Insights and Forecast - by Propulsion
- 10.2.1. Diesel
- 10.2.2. Gasoline
- 10.2.3. Electric
- 10.3. Market Analysis, Insights and Forecast - by Application
- 10.3.1. On-Road
- 10.3.2. Off-Road
- 10.1. Market Analysis, Insights and Forecast - by Vehicle type
- 11. Competitive Analysis
- 11.1. Global Market Share Analysis 2025
- 11.2. Company Profiles
- 11.2.1 Arctic Cat Inc
- 11.2.1.1. Overview
- 11.2.1.2. Products
- 11.2.1.3. SWOT Analysis
- 11.2.1.4. Recent Developments
- 11.2.1.5. Financials (Based on Availability)
- 11.2.2 Yamaha Motor Co Ltd
- 11.2.2.1. Overview
- 11.2.2.2. Products
- 11.2.2.3. SWOT Analysis
- 11.2.2.4. Recent Developments
- 11.2.2.5. Financials (Based on Availability)
- 11.2.3 Kawasaki Heavy Industries
- 11.2.3.1. Overview
- 11.2.3.2. Products
- 11.2.3.3. SWOT Analysis
- 11.2.3.4. Recent Developments
- 11.2.3.5. Financials (Based on Availability)
- 11.2.4 Changjiang Motorcycle Co Ltd
- 11.2.4.1. Overview
- 11.2.4.2. Products
- 11.2.4.3. SWOT Analysis
- 11.2.4.4. Recent Developments
- 11.2.4.5. Financials (Based on Availability)
- 11.2.5 KTM AG
- 11.2.5.1. Overview
- 11.2.5.2. Products
- 11.2.5.3. SWOT Analysis
- 11.2.5.4. Recent Developments
- 11.2.5.5. Financials (Based on Availability)
- 11.2.6 Harley-Davidson Inc *List Not Exhaustive
- 11.2.6.1. Overview
- 11.2.6.2. Products
- 11.2.6.3. SWOT Analysis
- 11.2.6.4. Recent Developments
- 11.2.6.5. Financials (Based on Availability)
- 11.2.7 BRP Inc
- 11.2.7.1. Overview
- 11.2.7.2. Products
- 11.2.7.3. SWOT Analysis
- 11.2.7.4. Recent Developments
- 11.2.7.5. Financials (Based on Availability)
- 11.2.8 Honda Motor Co Ltd
- 11.2.8.1. Overview
- 11.2.8.2. Products
- 11.2.8.3. SWOT Analysis
- 11.2.8.4. Recent Developments
- 11.2.8.5. Financials (Based on Availability)
- 11.2.9 Polaris Inc
- 11.2.9.1. Overview
- 11.2.9.2. Products
- 11.2.9.3. SWOT Analysis
- 11.2.9.4. Recent Developments
- 11.2.9.5. Financials (Based on Availability)
- 11.2.10 Suzuki Motor Corporation
- 11.2.10.1. Overview
- 11.2.10.2. Products
- 11.2.10.3. SWOT Analysis
- 11.2.10.4. Recent Developments
- 11.2.10.5. Financials (Based on Availability)
- 11.2.1 Arctic Cat Inc
List of Figures
- Figure 1: Global Powersports Market Revenue Breakdown (Million, %) by Region 2025 & 2033
- Figure 2: North America Powersports Market Revenue (Million), by Vehicle type 2025 & 2033
- Figure 3: North America Powersports Market Revenue Share (%), by Vehicle type 2025 & 2033
- Figure 4: North America Powersports Market Revenue (Million), by Propulsion 2025 & 2033
- Figure 5: North America Powersports Market Revenue Share (%), by Propulsion 2025 & 2033
- Figure 6: North America Powersports Market Revenue (Million), by Application 2025 & 2033
- Figure 7: North America Powersports Market Revenue Share (%), by Application 2025 & 2033
- Figure 8: North America Powersports Market Revenue (Million), by Country 2025 & 2033
- Figure 9: North America Powersports Market Revenue Share (%), by Country 2025 & 2033
- Figure 10: Europe Powersports Market Revenue (Million), by Vehicle type 2025 & 2033
- Figure 11: Europe Powersports Market Revenue Share (%), by Vehicle type 2025 & 2033
- Figure 12: Europe Powersports Market Revenue (Million), by Propulsion 2025 & 2033
- Figure 13: Europe Powersports Market Revenue Share (%), by Propulsion 2025 & 2033
- Figure 14: Europe Powersports Market Revenue (Million), by Application 2025 & 2033
- Figure 15: Europe Powersports Market Revenue Share (%), by Application 2025 & 2033
- Figure 16: Europe Powersports Market Revenue (Million), by Country 2025 & 2033
- Figure 17: Europe Powersports Market Revenue Share (%), by Country 2025 & 2033
- Figure 18: Asia Pacific Powersports Market Revenue (Million), by Vehicle type 2025 & 2033
- Figure 19: Asia Pacific Powersports Market Revenue Share (%), by Vehicle type 2025 & 2033
- Figure 20: Asia Pacific Powersports Market Revenue (Million), by Propulsion 2025 & 2033
- Figure 21: Asia Pacific Powersports Market Revenue Share (%), by Propulsion 2025 & 2033
- Figure 22: Asia Pacific Powersports Market Revenue (Million), by Application 2025 & 2033
- Figure 23: Asia Pacific Powersports Market Revenue Share (%), by Application 2025 & 2033
- Figure 24: Asia Pacific Powersports Market Revenue (Million), by Country 2025 & 2033
- Figure 25: Asia Pacific Powersports Market Revenue Share (%), by Country 2025 & 2033
- Figure 26: South America Powersports Market Revenue (Million), by Vehicle type 2025 & 2033
- Figure 27: South America Powersports Market Revenue Share (%), by Vehicle type 2025 & 2033
- Figure 28: South America Powersports Market Revenue (Million), by Propulsion 2025 & 2033
- Figure 29: South America Powersports Market Revenue Share (%), by Propulsion 2025 & 2033
- Figure 30: South America Powersports Market Revenue (Million), by Application 2025 & 2033
- Figure 31: South America Powersports Market Revenue Share (%), by Application 2025 & 2033
- Figure 32: South America Powersports Market Revenue (Million), by Country 2025 & 2033
- Figure 33: South America Powersports Market Revenue Share (%), by Country 2025 & 2033
- Figure 34: Middle East Powersports Market Revenue (Million), by Vehicle type 2025 & 2033
- Figure 35: Middle East Powersports Market Revenue Share (%), by Vehicle type 2025 & 2033
- Figure 36: Middle East Powersports Market Revenue (Million), by Propulsion 2025 & 2033
- Figure 37: Middle East Powersports Market Revenue Share (%), by Propulsion 2025 & 2033
- Figure 38: Middle East Powersports Market Revenue (Million), by Application 2025 & 2033
- Figure 39: Middle East Powersports Market Revenue Share (%), by Application 2025 & 2033
- Figure 40: Middle East Powersports Market Revenue (Million), by Country 2025 & 2033
- Figure 41: Middle East Powersports Market Revenue Share (%), by Country 2025 & 2033
List of Tables
- Table 1: Global Powersports Market Revenue Million Forecast, by Vehicle type 2020 & 2033
- Table 2: Global Powersports Market Revenue Million Forecast, by Propulsion 2020 & 2033
- Table 3: Global Powersports Market Revenue Million Forecast, by Application 2020 & 2033
- Table 4: Global Powersports Market Revenue Million Forecast, by Region 2020 & 2033
- Table 5: Global Powersports Market Revenue Million Forecast, by Vehicle type 2020 & 2033
- Table 6: Global Powersports Market Revenue Million Forecast, by Propulsion 2020 & 2033
- Table 7: Global Powersports Market Revenue Million Forecast, by Application 2020 & 2033
- Table 8: Global Powersports Market Revenue Million Forecast, by Country 2020 & 2033
- Table 9: US Powersports Market Revenue (Million) Forecast, by Application 2020 & 2033
- Table 10: Canada Powersports Market Revenue (Million) Forecast, by Application 2020 & 2033
- Table 11: Mexico Powersports Market Revenue (Million) Forecast, by Application 2020 & 2033
- Table 12: Rest of North America Powersports Market Revenue (Million) Forecast, by Application 2020 & 2033
- Table 13: Global Powersports Market Revenue Million Forecast, by Vehicle type 2020 & 2033
- Table 14: Global Powersports Market Revenue Million Forecast, by Propulsion 2020 & 2033
- Table 15: Global Powersports Market Revenue Million Forecast, by Application 2020 & 2033
- Table 16: Global Powersports Market Revenue Million Forecast, by Country 2020 & 2033
- Table 17: Germany Powersports Market Revenue (Million) Forecast, by Application 2020 & 2033
- Table 18: UK Powersports Market Revenue (Million) Forecast, by Application 2020 & 2033
- Table 19: France Powersports Market Revenue (Million) Forecast, by Application 2020 & 2033
- Table 20: Russia Powersports Market Revenue (Million) Forecast, by Application 2020 & 2033
- Table 21: Spain Powersports Market Revenue (Million) Forecast, by Application 2020 & 2033
- Table 22: Rest of Europe Powersports Market Revenue (Million) Forecast, by Application 2020 & 2033
- Table 23: Global Powersports Market Revenue Million Forecast, by Vehicle type 2020 & 2033
- Table 24: Global Powersports Market Revenue Million Forecast, by Propulsion 2020 & 2033
- Table 25: Global Powersports Market Revenue Million Forecast, by Application 2020 & 2033
- Table 26: Global Powersports Market Revenue Million Forecast, by Country 2020 & 2033
- Table 27: India Powersports Market Revenue (Million) Forecast, by Application 2020 & 2033
- Table 28: China Powersports Market Revenue (Million) Forecast, by Application 2020 & 2033
- Table 29: Japan Powersports Market Revenue (Million) Forecast, by Application 2020 & 2033
- Table 30: Rest of Asia Pacific Powersports Market Revenue (Million) Forecast, by Application 2020 & 2033
- Table 31: Global Powersports Market Revenue Million Forecast, by Vehicle type 2020 & 2033
- Table 32: Global Powersports Market Revenue Million Forecast, by Propulsion 2020 & 2033
- Table 33: Global Powersports Market Revenue Million Forecast, by Application 2020 & 2033
- Table 34: Global Powersports Market Revenue Million Forecast, by Country 2020 & 2033
- Table 35: Brazil Powersports Market Revenue (Million) Forecast, by Application 2020 & 2033
- Table 36: Argentina Powersports Market Revenue (Million) Forecast, by Application 2020 & 2033
- Table 37: Global Powersports Market Revenue Million Forecast, by Vehicle type 2020 & 2033
- Table 38: Global Powersports Market Revenue Million Forecast, by Propulsion 2020 & 2033
- Table 39: Global Powersports Market Revenue Million Forecast, by Application 2020 & 2033
- Table 40: Global Powersports Market Revenue Million Forecast, by Country 2020 & 2033
- Table 41: UAE Powersports Market Revenue (Million) Forecast, by Application 2020 & 2033
- Table 42: Saudi Arabia Powersports Market Revenue (Million) Forecast, by Application 2020 & 2033
- Table 43: Rest of Middle East Powersports Market Revenue (Million) Forecast, by Application 2020 & 2033
Frequently Asked Questions
1. What is the projected Compound Annual Growth Rate (CAGR) of the Powersports Market?
The projected CAGR is approximately 6.29%.
2. Which companies are prominent players in the Powersports Market?
Key companies in the market include Arctic Cat Inc, Yamaha Motor Co Ltd, Kawasaki Heavy Industries, Changjiang Motorcycle Co Ltd, KTM AG, Harley-Davidson Inc *List Not Exhaustive, BRP Inc, Honda Motor Co Ltd, Polaris Inc, Suzuki Motor Corporation.
3. What are the main segments of the Powersports Market?
The market segments include Vehicle type, Propulsion, Application.
4. Can you provide details about the market size?
The market size is estimated to be USD 40.33 Million as of 2022.
5. What are some drivers contributing to market growth?
Increasing disposable income and consumer preferences for adventure sports propel the market growth.
6. What are the notable trends driving market growth?
Changing Consumer Preferences due to technological Advancements Drives the Demand in the Market.
7. Are there any restraints impacting market growth?
High initial investment and maintenance costs obstruct the market growth.
8. Can you provide examples of recent developments in the market?
• January 2024: Patrick Industries agreed to acquire a supplier for Powersports Original Equipment Manufacturers (OEMs). The acquisition will expand Patrick Industries' presence in the Powersports market, offering innovative solutions to OEMs and enhancing their product offerings.
9. What pricing options are available for accessing the report?
Pricing options include single-user, multi-user, and enterprise licenses priced at USD 4750, USD 5250, and USD 8750 respectively.
10. Is the market size provided in terms of value or volume?
The market size is provided in terms of value, measured in Million.
11. Are there any specific market keywords associated with the report?
Yes, the market keyword associated with the report is "Powersports Market," which aids in identifying and referencing the specific market segment covered.
12. How do I determine which pricing option suits my needs best?
The pricing options vary based on user requirements and access needs. Individual users may opt for single-user licenses, while businesses requiring broader access may choose multi-user or enterprise licenses for cost-effective access to the report.
13. Are there any additional resources or data provided in the Powersports Market report?
While the report offers comprehensive insights, it's advisable to review the specific contents or supplementary materials provided to ascertain if additional resources or data are available.
14. How can I stay updated on further developments or reports in the Powersports Market?
To stay informed about further developments, trends, and reports in the Powersports Market, consider subscribing to industry newsletters, following relevant companies and organizations, or regularly checking reputable industry news sources and publications.
Methodology
Step 1 - Identification of Relevant Samples Size from Population Database


Step 2 - Approaches for Defining Global Market Size (Value, Volume* & Price*)

Note*: In applicable scenarios
Step 3 - Data Sources
Primary Research
- Web Analytics
- Survey Reports
- Research Institute
- Latest Research Reports
- Opinion Leaders
Secondary Research
- Annual Reports
- White Paper
- Latest Press Release
- Industry Association
- Paid Database
- Investor Presentations

Step 4 - Data Triangulation
Involves using different sources of information in order to increase the validity of a study
These sources are likely to be stakeholders in a program - participants, other researchers, program staff, other community members, and so on.
Then we put all data in single framework & apply various statistical tools to find out the dynamic on the market.
During the analysis stage, feedback from the stakeholder groups would be compared to determine areas of agreement as well as areas of divergence