

Key Insights
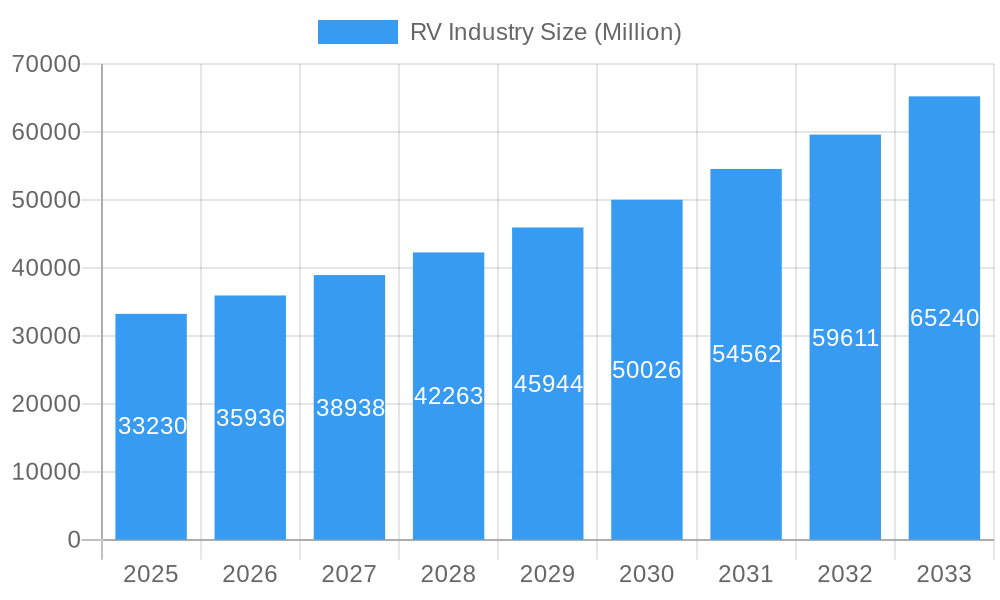
The global RV industry, valued at $33.23 billion in 2025, is projected to experience robust growth, driven by a Compound Annual Growth Rate (CAGR) of 8.15% from 2025 to 2033. This expansion is fueled by several key factors. Increased disposable incomes, particularly in developed nations like the United States and those in Western Europe, are empowering consumers to pursue leisure activities such as RV travel. The rising popularity of experiential travel and the desire for unique vacation experiences further bolster demand. Technological advancements in RV design and manufacturing, including improved fuel efficiency, enhanced comfort features, and smart home integration, are also contributing to market growth. The segmentation of the market into towable RVs (including truck campers), motorhomes, and applications encompassing both domestic and commercial use allows for targeted marketing and caters to diverse consumer preferences. North America currently dominates the market, with significant contributions from the United States and Canada, however, growing middle classes in Asia-Pacific and Europe represent substantial untapped potential for future growth.
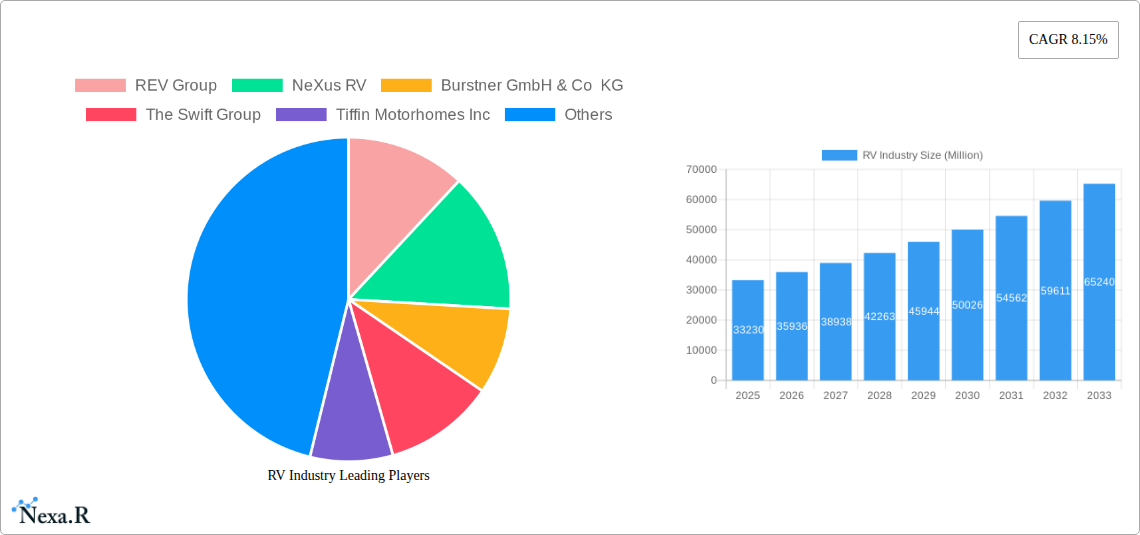
RV Industry Market Size (In Billion)
However, challenges remain. Economic downturns can impact consumer spending on discretionary items like RVs, while environmental concerns regarding fuel consumption and carbon emissions are prompting manufacturers to invest in sustainable alternatives. Regulations concerning RV usage and parking, particularly in densely populated areas, also pose constraints on market expansion. Competition among established manufacturers, including REV Group, Thor Industries, and Winnebago Industries, alongside emerging players, is intense, pushing innovation and price competitiveness. Future growth will depend on successfully addressing these challenges while capitalizing on the increasing demand for outdoor recreation and personalized travel experiences. Strategic partnerships and investments in sustainable technologies will be crucial for long-term success in this dynamic market.
RV Industry Company Market Share
RV Industry Market Report: 2019-2033
This comprehensive report provides a detailed analysis of the RV industry, encompassing market dynamics, growth trends, competitive landscape, and future outlook. The report covers the parent market of Recreational Vehicles and dives into child markets like Towable RVs and Motorhomes, offering invaluable insights for industry professionals, investors, and stakeholders. The study period spans 2019-2033, with 2025 as the base and estimated year. The forecast period is 2025-2033, and the historical period covers 2019-2024. Market values are presented in Million units.
RV Industry Market Dynamics & Structure
The RV industry is characterized by a moderately concentrated market structure, with key players like Thor Industries Inc., Winnebago Industries Inc., and Forest River Inc. holding significant market share (xx%). Technological innovation, particularly in electric vehicle (EV) technology and advanced materials, is a major driver. Regulatory frameworks concerning emissions and safety standards significantly impact operations. Competition from alternative travel options like cruises and hotels presents a challenge. End-user demographics are shifting, with younger generations expressing increased interest in RV travel. M&A activity remains moderate, with xx deals recorded in the past five years, indicating consolidation efforts within the sector.
- Market Concentration: Moderately concentrated, with top 3 players holding xx% market share.
- Technological Innovation: Focus on lightweight materials, smart technology integration, and EV adoption.
- Regulatory Framework: Emission standards, safety regulations, and fuel efficiency requirements.
- Competitive Substitutes: Cruises, hotels, and other forms of vacation travel.
- End-User Demographics: Shifting towards younger demographics and active lifestyle enthusiasts.
- M&A Trends: Moderate activity, with xx deals in the past 5 years, driven by consolidation and expansion strategies.
RV Industry Growth Trends & Insights
The global RV market is experiencing significant growth, driven by several factors. The historical period (2019-2024) witnessed a Compound Annual Growth Rate (CAGR) of xx%, with the market size reaching xx Million units in 2024. This growth is fueled by increasing disposable incomes, a growing preference for outdoor recreation, and the flexibility and affordability of RV travel. Technological advancements like lightweight construction and improved fuel efficiency are enhancing the appeal of RVs. The forecast period (2025-2033) projects a CAGR of xx%, reaching xx Million units by 2033, driven by the anticipated surge in demand for electric RVs and the expanding popularity of glamping and RV-based tourism. Market penetration is expected to increase from xx% in 2024 to xx% in 2033.
Dominant Regions, Countries, or Segments in RV Industry
The North American region, particularly the United States, currently dominates the global RV market, accounting for xx% of global sales in 2024. This dominance is driven by factors such as robust infrastructure supporting RV travel, a large population with disposable income, and a well-established RV culture. Within the product segments, Towable RVs currently hold a larger market share compared to Motorhomes (xx% vs xx%), but the motorhome segment is projected to experience faster growth in the coming years due to increased demand for luxury and convenience. The domestic application segment continues to be the primary driver of market growth, representing xx% of total market value.
- Key Drivers in North America: Strong infrastructure, high disposable incomes, established RV culture.
- Towable RVs: Large market share driven by affordability and ease of use.
- Motorhomes: Faster projected growth rate driven by luxury features and convenience.
- Domestic Application: Primary driver of market growth, with xx% market share.
- Growth Potential: Emerging markets in Europe and Asia-Pacific offer significant growth potential.
RV Industry Product Landscape
The RV industry offers a diverse range of products, from compact travel trailers to large Class A motorhomes. Recent innovations include lightweight materials to improve fuel efficiency, advanced technology integration for enhanced connectivity and entertainment, and the emergence of electric RVs, offering sustainable and eco-friendly options. Unique selling propositions include features such as off-grid capabilities, luxurious interiors, and adaptable floor plans to cater to diverse needs.
Key Drivers, Barriers & Challenges in RV Industry
Key Drivers: Rising disposable incomes, increasing interest in outdoor recreation and glamping, advancements in RV technology (lightweighting, electrification), government support for tourism.
Key Challenges: Supply chain disruptions impacting component availability, increasing raw material costs, stringent emission regulations, intense competition from established players and new entrants. The impact of these challenges can be quantified by xx% increase in production costs.
Emerging Opportunities in RV Industry
The RV industry presents significant opportunities in untapped markets, including emerging economies with growing middle classes. Innovative applications, such as personalized RV rentals and RV-based tourism packages, cater to changing consumer preferences. The growing interest in sustainable tourism fuels demand for eco-friendly electric RVs and improved waste management solutions within RVs.
Growth Accelerators in the RV Industry
Technological advancements, particularly in electric RV technology and smart home integration, are major growth accelerators. Strategic partnerships between RV manufacturers and technology companies are improving product offerings. Expansion into new geographic markets and catering to diverse customer segments (e.g., younger demographics, adventure travelers) will further propel industry growth.
Key Players Shaping the RV Industry Market
- REV Group
- NeXus RV
- Burstner GmbH & Co KG
- The Swift Group
- Tiffin Motorhomes Inc
- Thor Industries Inc
- Winnebago Industries Inc
- Dethleffs GmbH & Co KG
- Triple E Recreational Vehicles
- Rapido Motorhome
- Forest River Inc
Notable Milestones in RV Industry Sector
- January 2022: Thor unveils a concept EV motorhome with 300-mile range.
- January 2022: Winnebago showcases an all-electric concept RV with 125-mile range.
- January 2022: Thor reveals a new electric Airstream concept travel trailer.
- May 2021: Forest River Inc. unveils the Della Terra range of travel trailers.
In-Depth RV Industry Market Outlook
The future of the RV industry is bright, driven by sustained growth in outdoor recreation and the ongoing development of innovative products and technologies. The market is poised for expansion into new markets, the adoption of electric vehicles, and continued product diversification. Strategic partnerships, focus on sustainability, and technological breakthroughs will further solidify the industry's long-term growth trajectory.
RV Industry Segmentation
-
1. Type
-
1.1. Towable RVs
- 1.1.1. Travel Trailers
- 1.1.2. Fifth Wheel Trailers
- 1.1.3. Folding Camp Trailers
- 1.1.4. Truck Campers
-
1.2. Motorhomes
- 1.2.1. Type A
- 1.2.2. Type B
- 1.2.3. Type C
-
1.1. Towable RVs
-
2. Application
- 2.1. Domestic
- 2.2. Commercial
RV Industry Segmentation By Geography
-
1. North America
- 1.1. United states
- 1.2. Canada
- 1.3. Rest of North America
-
2. Europe
- 2.1. United Kingdom
- 2.2. Germany
- 2.3. France
- 2.4. Spain
- 2.5. Rest of Europe
-
3. Asia Pacific
- 3.1. China
- 3.2. India
- 3.3. Japan
- 3.4. South Korea
- 3.5. Rest of Asia Pacific
-
4. Rest of the World
- 4.1. South America
- 4.2. Middle East and Africa
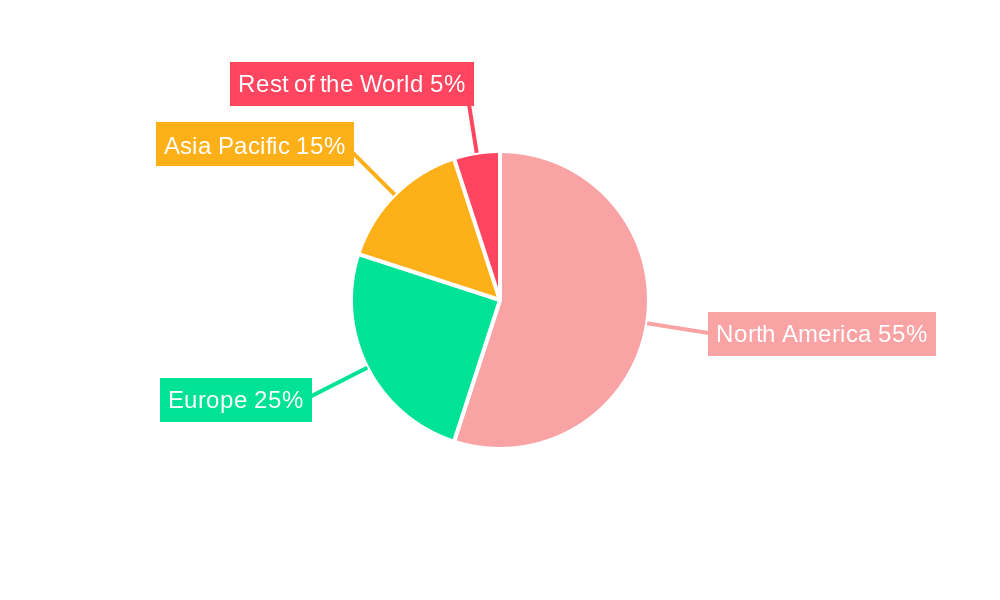
RV Industry Regional Market Share
Geographic Coverage of RV Industry
RV Industry REPORT HIGHLIGHTS
| Aspects | Details |
|---|---|
| Study Period | 2020-2034 |
| Base Year | 2025 |
| Estimated Year | 2026 |
| Forecast Period | 2026-2034 |
| Historical Period | 2020-2025 |
| Growth Rate | CAGR of 8.15% from 2020-2034 |
| Segmentation |
|
Table of Contents
- 1. Introduction
- 1.1. Research Scope
- 1.2. Market Segmentation
- 1.3. Research Objective
- 1.4. Definitions and Assumptions
- 2. Executive Summary
- 2.1. Market Snapshot
- 3. Market Dynamics
- 3.1. Market Drivers
- 3.2. Market Restrains
- 3.3. Market Trends
- 3.4. Market Opportunities
- 4. Market Factor Analysis
- 4.1. Porters Five Forces
- 4.1.1. Bargaining Power of Suppliers
- 4.1.2. Bargaining Power of Buyers
- 4.1.3. Threat of New Entrants
- 4.1.4. Threat of Substitutes
- 4.1.5. Competitive Rivalry
- 4.2. PESTEL analysis
- 4.3. BCG Analysis
- 4.3.1. Stars (High Growth, High Market Share)
- 4.3.2. Cash Cows (Low Growth, High Market Share)
- 4.3.3. Question Mark (High Growth, Low Market Share)
- 4.3.4. Dogs (Low Growth, Low Market Share)
- 4.4. Ansoff Matrix Analysis
- 4.5. Supply Chain Analysis
- 4.6. Regulatory Landscape
- 4.7. Current Market Potential and Opportunity Assessment (TAM–SAM–SOM Framework)
- 4.8. NRP Analyst Note
- 4.1. Porters Five Forces
- 5. Market Analysis, Insights and Forecast 2021-2033
- 5.1. Market Analysis, Insights and Forecast - by Type
- 5.1.1. Towable RVs
- 5.1.1.1. Travel Trailers
- 5.1.1.2. Fifth Wheel Trailers
- 5.1.1.3. Folding Camp Trailers
- 5.1.1.4. Truck Campers
- 5.1.2. Motorhomes
- 5.1.2.1. Type A
- 5.1.2.2. Type B
- 5.1.2.3. Type C
- 5.1.1. Towable RVs
- 5.2. Market Analysis, Insights and Forecast - by Application
- 5.2.1. Domestic
- 5.2.2. Commercial
- 5.3. Market Analysis, Insights and Forecast - by Region
- 5.3.1. North America
- 5.3.2. Europe
- 5.3.3. Asia Pacific
- 5.3.4. Rest of the World
- 5.1. Market Analysis, Insights and Forecast - by Type
- 6. Global RV Industry Analysis, Insights and Forecast, 2021-2033
- 6.1. Market Analysis, Insights and Forecast - by Type
- 6.1.1. Towable RVs
- 6.1.1.1. Travel Trailers
- 6.1.1.2. Fifth Wheel Trailers
- 6.1.1.3. Folding Camp Trailers
- 6.1.1.4. Truck Campers
- 6.1.2. Motorhomes
- 6.1.2.1. Type A
- 6.1.2.2. Type B
- 6.1.2.3. Type C
- 6.1.1. Towable RVs
- 6.2. Market Analysis, Insights and Forecast - by Application
- 6.2.1. Domestic
- 6.2.2. Commercial
- 6.1. Market Analysis, Insights and Forecast - by Type
- 7. North America RV Industry Analysis, Insights and Forecast, 2020-2032
- 7.1. Market Analysis, Insights and Forecast - by Type
- 7.1.1. Towable RVs
- 7.1.1.1. Travel Trailers
- 7.1.1.2. Fifth Wheel Trailers
- 7.1.1.3. Folding Camp Trailers
- 7.1.1.4. Truck Campers
- 7.1.2. Motorhomes
- 7.1.2.1. Type A
- 7.1.2.2. Type B
- 7.1.2.3. Type C
- 7.1.1. Towable RVs
- 7.2. Market Analysis, Insights and Forecast - by Application
- 7.2.1. Domestic
- 7.2.2. Commercial
- 7.1. Market Analysis, Insights and Forecast - by Type
- 8. Europe RV Industry Analysis, Insights and Forecast, 2020-2032
- 8.1. Market Analysis, Insights and Forecast - by Type
- 8.1.1. Towable RVs
- 8.1.1.1. Travel Trailers
- 8.1.1.2. Fifth Wheel Trailers
- 8.1.1.3. Folding Camp Trailers
- 8.1.1.4. Truck Campers
- 8.1.2. Motorhomes
- 8.1.2.1. Type A
- 8.1.2.2. Type B
- 8.1.2.3. Type C
- 8.1.1. Towable RVs
- 8.2. Market Analysis, Insights and Forecast - by Application
- 8.2.1. Domestic
- 8.2.2. Commercial
- 8.1. Market Analysis, Insights and Forecast - by Type
- 9. Asia Pacific RV Industry Analysis, Insights and Forecast, 2020-2032
- 9.1. Market Analysis, Insights and Forecast - by Type
- 9.1.1. Towable RVs
- 9.1.1.1. Travel Trailers
- 9.1.1.2. Fifth Wheel Trailers
- 9.1.1.3. Folding Camp Trailers
- 9.1.1.4. Truck Campers
- 9.1.2. Motorhomes
- 9.1.2.1. Type A
- 9.1.2.2. Type B
- 9.1.2.3. Type C
- 9.1.1. Towable RVs
- 9.2. Market Analysis, Insights and Forecast - by Application
- 9.2.1. Domestic
- 9.2.2. Commercial
- 9.1. Market Analysis, Insights and Forecast - by Type
- 10. Rest of the World RV Industry Analysis, Insights and Forecast, 2020-2032
- 10.1. Market Analysis, Insights and Forecast - by Type
- 10.1.1. Towable RVs
- 10.1.1.1. Travel Trailers
- 10.1.1.2. Fifth Wheel Trailers
- 10.1.1.3. Folding Camp Trailers
- 10.1.1.4. Truck Campers
- 10.1.2. Motorhomes
- 10.1.2.1. Type A
- 10.1.2.2. Type B
- 10.1.2.3. Type C
- 10.1.1. Towable RVs
- 10.2. Market Analysis, Insights and Forecast - by Application
- 10.2.1. Domestic
- 10.2.2. Commercial
- 10.1. Market Analysis, Insights and Forecast - by Type
- 11. Competitive Analysis
- 11.1. Company Profiles
- 11.1.1 REV Group
- 11.1.1.1. Company Overview
- 11.1.1.2. Products
- 11.1.1.3. Company Financials
- 11.1.1.4. SWOT Analysis
- 11.1.2 NeXus RV
- 11.1.2.1. Company Overview
- 11.1.2.2. Products
- 11.1.2.3. Company Financials
- 11.1.2.4. SWOT Analysis
- 11.1.3 Burstner GmbH & Co KG
- 11.1.3.1. Company Overview
- 11.1.3.2. Products
- 11.1.3.3. Company Financials
- 11.1.3.4. SWOT Analysis
- 11.1.4 The Swift Group
- 11.1.4.1. Company Overview
- 11.1.4.2. Products
- 11.1.4.3. Company Financials
- 11.1.4.4. SWOT Analysis
- 11.1.5 Tiffin Motorhomes Inc
- 11.1.5.1. Company Overview
- 11.1.5.2. Products
- 11.1.5.3. Company Financials
- 11.1.5.4. SWOT Analysis
- 11.1.6 Thor Industries Inc
- 11.1.6.1. Company Overview
- 11.1.6.2. Products
- 11.1.6.3. Company Financials
- 11.1.6.4. SWOT Analysis
- 11.1.7 Winnebago Industries Inc
- 11.1.7.1. Company Overview
- 11.1.7.2. Products
- 11.1.7.3. Company Financials
- 11.1.7.4. SWOT Analysis
- 11.1.8 Dethleffs GmbH & Co KG
- 11.1.8.1. Company Overview
- 11.1.8.2. Products
- 11.1.8.3. Company Financials
- 11.1.8.4. SWOT Analysis
- 11.1.9 Triple E Recreational Vehicles
- 11.1.9.1. Company Overview
- 11.1.9.2. Products
- 11.1.9.3. Company Financials
- 11.1.9.4. SWOT Analysis
- 11.1.10 Rapido Motorhome
- 11.1.10.1. Company Overview
- 11.1.10.2. Products
- 11.1.10.3. Company Financials
- 11.1.10.4. SWOT Analysis
- 11.1.11 Forest River Inc
- 11.1.11.1. Company Overview
- 11.1.11.2. Products
- 11.1.11.3. Company Financials
- 11.1.11.4. SWOT Analysis
- 11.1.1 REV Group
- 11.2. Market Entropy
- 11.2.1 Company's Key Areas Served
- 11.2.2 Recent Developments
- 11.3. Company Market Share Analysis 2025
- 11.3.1 Top 5 Companies Market Share Analysis
- 11.3.2 Top 3 Companies Market Share Analysis
- 11.4. List of Potential Customers
- 12. Research Methodology
List of Figures
- Figure 1: Global RV Industry Revenue Breakdown (Million, %) by Region 2025 & 2033
- Figure 2: North America RV Industry Revenue (Million), by Type 2025 & 2033
- Figure 3: North America RV Industry Revenue Share (%), by Type 2025 & 2033
- Figure 4: North America RV Industry Revenue (Million), by Application 2025 & 2033
- Figure 5: North America RV Industry Revenue Share (%), by Application 2025 & 2033
- Figure 6: North America RV Industry Revenue (Million), by Country 2025 & 2033
- Figure 7: North America RV Industry Revenue Share (%), by Country 2025 & 2033
- Figure 8: Europe RV Industry Revenue (Million), by Type 2025 & 2033
- Figure 9: Europe RV Industry Revenue Share (%), by Type 2025 & 2033
- Figure 10: Europe RV Industry Revenue (Million), by Application 2025 & 2033
- Figure 11: Europe RV Industry Revenue Share (%), by Application 2025 & 2033
- Figure 12: Europe RV Industry Revenue (Million), by Country 2025 & 2033
- Figure 13: Europe RV Industry Revenue Share (%), by Country 2025 & 2033
- Figure 14: Asia Pacific RV Industry Revenue (Million), by Type 2025 & 2033
- Figure 15: Asia Pacific RV Industry Revenue Share (%), by Type 2025 & 2033
- Figure 16: Asia Pacific RV Industry Revenue (Million), by Application 2025 & 2033
- Figure 17: Asia Pacific RV Industry Revenue Share (%), by Application 2025 & 2033
- Figure 18: Asia Pacific RV Industry Revenue (Million), by Country 2025 & 2033
- Figure 19: Asia Pacific RV Industry Revenue Share (%), by Country 2025 & 2033
- Figure 20: Rest of the World RV Industry Revenue (Million), by Type 2025 & 2033
- Figure 21: Rest of the World RV Industry Revenue Share (%), by Type 2025 & 2033
- Figure 22: Rest of the World RV Industry Revenue (Million), by Application 2025 & 2033
- Figure 23: Rest of the World RV Industry Revenue Share (%), by Application 2025 & 2033
- Figure 24: Rest of the World RV Industry Revenue (Million), by Country 2025 & 2033
- Figure 25: Rest of the World RV Industry Revenue Share (%), by Country 2025 & 2033
List of Tables
- Table 1: Global RV Industry Revenue Million Forecast, by Type 2020 & 2033
- Table 2: Global RV Industry Revenue Million Forecast, by Application 2020 & 2033
- Table 3: Global RV Industry Revenue Million Forecast, by Region 2020 & 2033
- Table 4: Global RV Industry Revenue Million Forecast, by Type 2020 & 2033
- Table 5: Global RV Industry Revenue Million Forecast, by Application 2020 & 2033
- Table 6: Global RV Industry Revenue Million Forecast, by Country 2020 & 2033
- Table 7: United states RV Industry Revenue (Million) Forecast, by Application 2020 & 2033
- Table 8: Canada RV Industry Revenue (Million) Forecast, by Application 2020 & 2033
- Table 9: Rest of North America RV Industry Revenue (Million) Forecast, by Application 2020 & 2033
- Table 10: Global RV Industry Revenue Million Forecast, by Type 2020 & 2033
- Table 11: Global RV Industry Revenue Million Forecast, by Application 2020 & 2033
- Table 12: Global RV Industry Revenue Million Forecast, by Country 2020 & 2033
- Table 13: United Kingdom RV Industry Revenue (Million) Forecast, by Application 2020 & 2033
- Table 14: Germany RV Industry Revenue (Million) Forecast, by Application 2020 & 2033
- Table 15: France RV Industry Revenue (Million) Forecast, by Application 2020 & 2033
- Table 16: Spain RV Industry Revenue (Million) Forecast, by Application 2020 & 2033
- Table 17: Rest of Europe RV Industry Revenue (Million) Forecast, by Application 2020 & 2033
- Table 18: Global RV Industry Revenue Million Forecast, by Type 2020 & 2033
- Table 19: Global RV Industry Revenue Million Forecast, by Application 2020 & 2033
- Table 20: Global RV Industry Revenue Million Forecast, by Country 2020 & 2033
- Table 21: China RV Industry Revenue (Million) Forecast, by Application 2020 & 2033
- Table 22: India RV Industry Revenue (Million) Forecast, by Application 2020 & 2033
- Table 23: Japan RV Industry Revenue (Million) Forecast, by Application 2020 & 2033
- Table 24: South Korea RV Industry Revenue (Million) Forecast, by Application 2020 & 2033
- Table 25: Rest of Asia Pacific RV Industry Revenue (Million) Forecast, by Application 2020 & 2033
- Table 26: Global RV Industry Revenue Million Forecast, by Type 2020 & 2033
- Table 27: Global RV Industry Revenue Million Forecast, by Application 2020 & 2033
- Table 28: Global RV Industry Revenue Million Forecast, by Country 2020 & 2033
- Table 29: South America RV Industry Revenue (Million) Forecast, by Application 2020 & 2033
- Table 30: Middle East and Africa RV Industry Revenue (Million) Forecast, by Application 2020 & 2033
Frequently Asked Questions
1. What is the projected Compound Annual Growth Rate (CAGR) of the RV Industry?
The projected CAGR is approximately 8.15%.
2. Which companies are prominent players in the RV Industry?
Key companies in the market include REV Group, NeXus RV, Burstner GmbH & Co KG, The Swift Group, Tiffin Motorhomes Inc, Thor Industries Inc, Winnebago Industries Inc, Dethleffs GmbH & Co KG, Triple E Recreational Vehicles, Rapido Motorhome, Forest River Inc.
3. What are the main segments of the RV Industry?
The market segments include Type, Application.
4. Can you provide details about the market size?
The market size is estimated to be USD 33.23 Million as of 2022.
5. What are some drivers contributing to market growth?
Increasing Sales of Electric Vehicles are Expected to Drive the Market.
6. What are the notable trends driving market growth?
Motorhomes Segment Expected to Lead the Market.
7. Are there any restraints impacting market growth?
Lack of Infrastructure May Hamper the growth of the Market.
8. Can you provide examples of recent developments in the market?
In January 2022, Thor unveiled a concept E.V motorhome with 300 miles range. The company stated that shifting consumer preferences in electric cars and trucks may also portray growth paths for electric motorhomes.
9. What pricing options are available for accessing the report?
Pricing options include single-user, multi-user, and enterprise licenses priced at USD 4750, USD 5250, and USD 8750 respectively.
10. Is the market size provided in terms of value or volume?
The market size is provided in terms of value, measured in Million.
11. Are there any specific market keywords associated with the report?
Yes, the market keyword associated with the report is "RV Industry," which aids in identifying and referencing the specific market segment covered.
12. How do I determine which pricing option suits my needs best?
The pricing options vary based on user requirements and access needs. Individual users may opt for single-user licenses, while businesses requiring broader access may choose multi-user or enterprise licenses for cost-effective access to the report.
13. Are there any additional resources or data provided in the RV Industry report?
While the report offers comprehensive insights, it's advisable to review the specific contents or supplementary materials provided to ascertain if additional resources or data are available.
14. How can I stay updated on further developments or reports in the RV Industry?
To stay informed about further developments, trends, and reports in the RV Industry, consider subscribing to industry newsletters, following relevant companies and organizations, or regularly checking reputable industry news sources and publications.
Methodology
Step 1 - Identification of Relevant Samples Size from Population Database


Step 2 - Approaches for Defining Global Market Size (Value, Volume* & Price*)

Note*: In applicable scenarios
Step 3 - Data Sources
Primary Research
- Web Analytics
- Survey Reports
- Research Institute
- Latest Research Reports
- Opinion Leaders
Secondary Research
- Annual Reports
- White Paper
- Latest Press Release
- Industry Association
- Paid Database
- Investor Presentations

Step 4 - Data Triangulation
Involves using different sources of information in order to increase the validity of a study
These sources are likely to be stakeholders in a program - participants, other researchers, program staff, other community members, and so on.
Then we put all data in single framework & apply various statistical tools to find out the dynamic on the market.
During the analysis stage, feedback from the stakeholder groups would be compared to determine areas of agreement as well as areas of divergence