

Key Insights
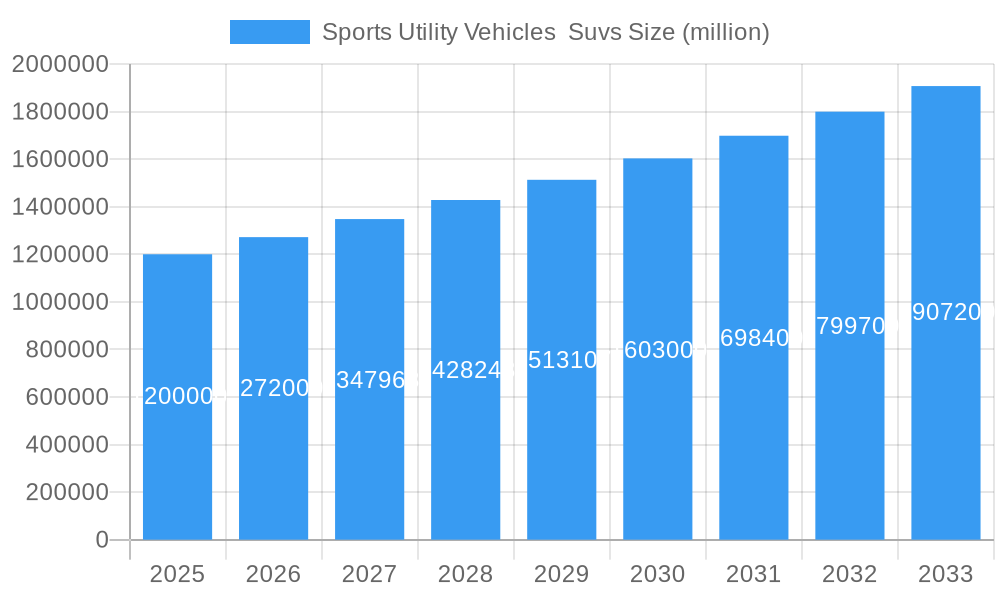
The global Sports Utility Vehicle (SUV) market is experiencing robust growth, driven by increasing consumer preference for spaciousness, versatility, and perceived safety features compared to sedans and hatchbacks. The market, estimated at $1.2 trillion in 2025, is projected to maintain a healthy Compound Annual Growth Rate (CAGR) of 6% from 2025 to 2033, reaching approximately $2 trillion by the end of the forecast period. Several factors fuel this expansion. Rising disposable incomes in developing economies, particularly in Asia and South America, are creating a larger pool of consumers able to afford SUVs. Furthermore, advancements in SUV technology, including improved fuel efficiency, advanced driver-assistance systems (ADAS), and electrification options, are enhancing their appeal. The segment is also witnessing a rise in demand for luxury SUVs, high-performance variants, and specialized models targeting niche markets like off-road enthusiasts. Leading automotive manufacturers like Ford, GM, Daimler, Toyota, Volkswagen, Honda Motor, and Nissan Motor are heavily invested in expanding their SUV portfolios to capitalize on this growth.
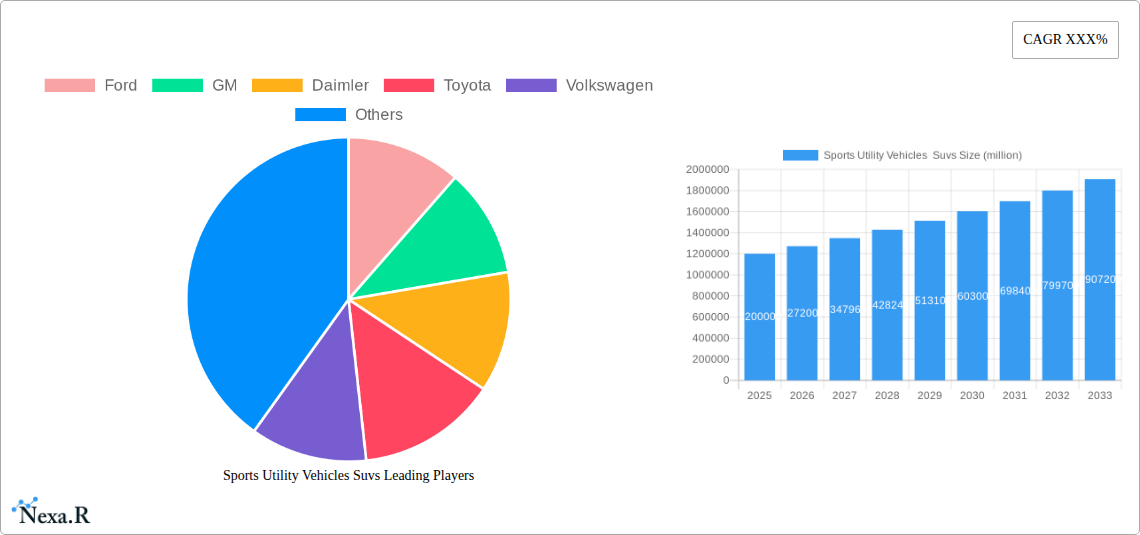
Sports Utility Vehicles Suvs Market Size (In Million)
However, the market also faces certain challenges. Fluctuations in fuel prices, stringent emission regulations, and the increasing popularity of electric vehicles (EVs) pose potential restraints. Manufacturers are actively addressing these concerns through the development of hybrid and electric SUV models, along with advancements in fuel-efficient internal combustion engines. The market is segmented by vehicle size (compact, mid-size, full-size, luxury), fuel type (gasoline, diesel, hybrid, electric), and geographic region. Competitive intensity is high, prompting ongoing innovation and strategic alliances to secure market share. The forecast period of 2025-2033 promises significant expansion within the SUV sector, driven by sustained consumer demand, technological advancements, and the proactive strategies of major automotive players.
Sports Utility Vehicles Suvs Company Market Share
Sports Utility Vehicles (SUVs) Market Report: 2019-2033
This comprehensive report provides an in-depth analysis of the global Sports Utility Vehicles (SUVs) market, encompassing historical data (2019-2024), the base year (2025), and a detailed forecast (2025-2033). The study covers key market segments, regional dynamics, competitive landscapes, and emerging trends, offering invaluable insights for industry professionals, investors, and strategic decision-makers. The total market size is projected to reach xx million units by 2033, showcasing significant growth potential. The parent market is the automotive industry, and the child market encompasses various SUV segments based on size, fuel type, and features.
Sports Utility Vehicles SUVs Market Dynamics & Structure
This section analyzes the structure and dynamics of the global SUV market, focusing on market concentration, technological innovation, regulatory frameworks, competitive substitutes, end-user demographics, and mergers and acquisitions (M&A) trends. The global SUV market is characterized by a relatively concentrated landscape with key players holding significant market share.
- Market Concentration: The top five players (Ford, GM, Daimler, Toyota, Volkswagen) collectively held approximately xx% of the global market share in 2024.
- Technological Innovation: The industry witnesses continuous advancements in powertrain technologies (hybrid, electric, fuel-efficient engines), advanced driver-assistance systems (ADAS), and infotainment systems, driving product differentiation and consumer preference. Barriers to innovation include high R&D costs and stringent regulatory compliance requirements.
- Regulatory Frameworks: Stringent emission standards (e.g., Euro 7, CAFE standards) and safety regulations globally are reshaping the SUV landscape, prompting manufacturers to adopt cleaner and safer technologies.
- Competitive Product Substitutes: Crossovers and station wagons pose some level of competition, attracting buyers seeking similar features but with different characteristics.
- End-User Demographics: The target demographic for SUVs is diverse, spanning families, young professionals, and adventure enthusiasts, with demand influenced by factors like disposable income, family size, and lifestyle choices.
- M&A Trends: The automotive sector has witnessed several strategic M&A activities in recent years, driven by the need for technological collaborations, geographical expansion, and economies of scale. An estimated xx M&A deals were recorded in the SUV segment between 2019 and 2024.
Sports Utility Vehicles SUVs Growth Trends & Insights
This section provides a comprehensive analysis of the SUV market's growth trajectory, utilizing various analytical tools and data points. The market exhibited a Compound Annual Growth Rate (CAGR) of xx% during the historical period (2019-2024), driven by increasing urbanization, rising disposable incomes in emerging economies, and evolving consumer preferences towards larger, more versatile vehicles. Market penetration of SUVs continues to increase, particularly in developing nations.
Technological disruptions, including the rise of electric and hybrid SUVs, are significantly impacting market dynamics. Consumer behavior is shifting towards prioritizing fuel efficiency, advanced safety features, and connectivity options. The estimated market size in 2025 is xx million units, indicating continued growth momentum. Forecasted CAGR for 2025-2033 is estimated at xx%.
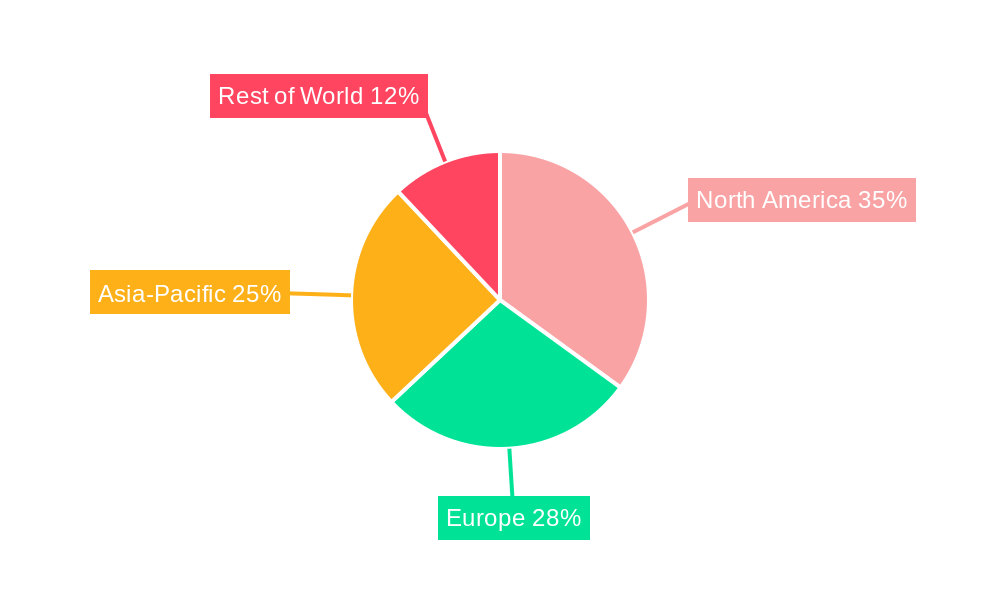
Dominant Regions, Countries, or Segments in Sports Utility Vehicles SUVs
North America and Asia-Pacific currently dominate the global SUV market.
- North America: High consumer demand, robust automotive infrastructure, and established manufacturing bases contribute to the region’s market leadership.
- Asia-Pacific: Rapid economic growth, increasing urbanization, and a burgeoning middle class are fueling significant SUV market expansion, particularly in China and India. The region's share is projected to increase to xx% by 2033.
- Europe: The market is mature but stable, with a focus on premium SUVs and fuel-efficient models.
- Key Drivers: Government incentives for electric vehicles, improving road infrastructure, and growing tourism boost the growth in specific regions.
- Dominance Factors: Strong purchasing power, higher preference for SUVs due to spaciousness and versatility, and supportive government policies contribute to the dominance of certain regions.
Sports Utility Vehicles SUVs Product Landscape
The SUV product landscape is characterized by a wide array of models catering to various consumer needs and preferences. Manufacturers offer a diverse range of options, including compact SUVs, mid-size SUVs, and large SUVs, each with varying engine types (gasoline, diesel, hybrid, electric), features, and price points. Innovation focuses on enhancing fuel efficiency, safety, and technological integration, incorporating advanced driver-assistance systems (ADAS) and connected car features. Unique selling propositions include enhanced off-road capabilities, luxurious interiors, and advanced driver-assistance systems.
Key Drivers, Barriers & Challenges in Sports Utility Vehicles SUVs
Key Drivers: Rising disposable incomes in emerging economies, increasing urbanization, changing consumer preferences towards larger vehicles, and technological advancements in fuel efficiency and safety features are key market drivers. Government incentives and supportive infrastructure also boost sales.
Key Challenges: Stringent emission regulations, fluctuating fuel prices, rising raw material costs, and supply chain disruptions pose significant challenges. The intensifying competition and the transition to electric vehicles also create headwinds. The estimated impact of supply chain issues on production in 2024 was a xx% reduction in output for some manufacturers.
Emerging Opportunities in Sports Utility Vehicles SUVs
Emerging opportunities include the growth of electric and hybrid SUVs, increasing demand for autonomous driving features, expansion into untapped markets in Africa and Latin America, and the development of niche SUVs catering to specific lifestyles (e.g., off-road, luxury, compact). The focus on sustainability and environmentally friendly options presents significant opportunities for manufacturers.
Growth Accelerators in the Sports Utility Vehicles Suvs Industry
Technological advancements in battery technology, autonomous driving, and connectivity are key growth catalysts. Strategic partnerships and collaborations between automakers and technology companies are accelerating innovation. Expansion into new markets and the development of innovative business models (e.g., subscription services) are also contributing to market growth.
Key Players Shaping the Sports Utility Vehicles SUVs Market
Notable Milestones in Sports Utility Vehicles SUVs Sector
- 2020: Several automakers announced significant investments in electric SUV development.
- 2021: Introduction of several new SUV models with advanced driver-assistance systems.
- 2022: Growing adoption of hybrid SUVs across major markets.
- 2023: Increased focus on sustainability and responsible sourcing of materials by key players.
- 2024: Significant advancements in battery technology impacting the electric SUV sector.
In-Depth Sports Utility Vehicles SUVs Market Outlook
The SUV market is poised for continued growth, driven by ongoing technological advancements, evolving consumer preferences, and expansion into new markets. Strategic opportunities exist for manufacturers focusing on sustainability, advanced technologies, and innovative business models. The market's future hinges on effectively navigating the challenges of regulatory compliance, supply chain management, and the ongoing transition to electric vehicles. The long-term outlook remains positive, with significant potential for market expansion and profitability.
Sports Utility Vehicles Suvs Segmentation
-
1. Application
- 1.1. Passenger Car
- 1.2. Commercial Vehicle
-
2. Type
- 2.1. Small SUV
- 2.2. Medium SUV
- 2.3. Large SUV
Sports Utility Vehicles Suvs Segmentation By Geography
-
1. North America
- 1.1. United States
- 1.2. Canada
- 1.3. Mexico
-
2. South America
- 2.1. Brazil
- 2.2. Argentina
- 2.3. Rest of South America
-
3. Europe
- 3.1. United Kingdom
- 3.2. Germany
- 3.3. France
- 3.4. Italy
- 3.5. Spain
- 3.6. Russia
- 3.7. Benelux
- 3.8. Nordics
- 3.9. Rest of Europe
-
4. Middle East & Africa
- 4.1. Turkey
- 4.2. Israel
- 4.3. GCC
- 4.4. North Africa
- 4.5. South Africa
- 4.6. Rest of Middle East & Africa
-
5. Asia Pacific
- 5.1. China
- 5.2. India
- 5.3. Japan
- 5.4. South Korea
- 5.5. ASEAN
- 5.6. Oceania
- 5.7. Rest of Asia Pacific
Sports Utility Vehicles Suvs Regional Market Share
Geographic Coverage of Sports Utility Vehicles Suvs
Sports Utility Vehicles Suvs REPORT HIGHLIGHTS
| Aspects | Details |
|---|---|
| Study Period | 2020-2034 |
| Base Year | 2025 |
| Estimated Year | 2026 |
| Forecast Period | 2026-2034 |
| Historical Period | 2020-2025 |
| Growth Rate | CAGR of XXX% from 2020-2034 |
| Segmentation |
|
Table of Contents
- 1. Introduction
- 1.1. Research Scope
- 1.2. Market Segmentation
- 1.3. Research Methodology
- 1.4. Definitions and Assumptions
- 2. Executive Summary
- 2.1. Introduction
- 3. Market Dynamics
- 3.1. Introduction
- 3.2. Market Drivers
- 3.3. Market Restrains
- 3.4. Market Trends
- 4. Market Factor Analysis
- 4.1. Porters Five Forces
- 4.2. Supply/Value Chain
- 4.3. PESTEL analysis
- 4.4. Market Entropy
- 4.5. Patent/Trademark Analysis
- 5. Global Sports Utility Vehicles Suvs Analysis, Insights and Forecast, 2020-2032
- 5.1. Market Analysis, Insights and Forecast - by Application
- 5.1.1. Passenger Car
- 5.1.2. Commercial Vehicle
- 5.2. Market Analysis, Insights and Forecast - by Type
- 5.2.1. Small SUV
- 5.2.2. Medium SUV
- 5.2.3. Large SUV
- 5.3. Market Analysis, Insights and Forecast - by Region
- 5.3.1. North America
- 5.3.2. South America
- 5.3.3. Europe
- 5.3.4. Middle East & Africa
- 5.3.5. Asia Pacific
- 5.1. Market Analysis, Insights and Forecast - by Application
- 6. North America Sports Utility Vehicles Suvs Analysis, Insights and Forecast, 2020-2032
- 6.1. Market Analysis, Insights and Forecast - by Application
- 6.1.1. Passenger Car
- 6.1.2. Commercial Vehicle
- 6.2. Market Analysis, Insights and Forecast - by Type
- 6.2.1. Small SUV
- 6.2.2. Medium SUV
- 6.2.3. Large SUV
- 6.1. Market Analysis, Insights and Forecast - by Application
- 7. South America Sports Utility Vehicles Suvs Analysis, Insights and Forecast, 2020-2032
- 7.1. Market Analysis, Insights and Forecast - by Application
- 7.1.1. Passenger Car
- 7.1.2. Commercial Vehicle
- 7.2. Market Analysis, Insights and Forecast - by Type
- 7.2.1. Small SUV
- 7.2.2. Medium SUV
- 7.2.3. Large SUV
- 7.1. Market Analysis, Insights and Forecast - by Application
- 8. Europe Sports Utility Vehicles Suvs Analysis, Insights and Forecast, 2020-2032
- 8.1. Market Analysis, Insights and Forecast - by Application
- 8.1.1. Passenger Car
- 8.1.2. Commercial Vehicle
- 8.2. Market Analysis, Insights and Forecast - by Type
- 8.2.1. Small SUV
- 8.2.2. Medium SUV
- 8.2.3. Large SUV
- 8.1. Market Analysis, Insights and Forecast - by Application
- 9. Middle East & Africa Sports Utility Vehicles Suvs Analysis, Insights and Forecast, 2020-2032
- 9.1. Market Analysis, Insights and Forecast - by Application
- 9.1.1. Passenger Car
- 9.1.2. Commercial Vehicle
- 9.2. Market Analysis, Insights and Forecast - by Type
- 9.2.1. Small SUV
- 9.2.2. Medium SUV
- 9.2.3. Large SUV
- 9.1. Market Analysis, Insights and Forecast - by Application
- 10. Asia Pacific Sports Utility Vehicles Suvs Analysis, Insights and Forecast, 2020-2032
- 10.1. Market Analysis, Insights and Forecast - by Application
- 10.1.1. Passenger Car
- 10.1.2. Commercial Vehicle
- 10.2. Market Analysis, Insights and Forecast - by Type
- 10.2.1. Small SUV
- 10.2.2. Medium SUV
- 10.2.3. Large SUV
- 10.1. Market Analysis, Insights and Forecast - by Application
- 11. Competitive Analysis
- 11.1. Global Market Share Analysis 2025
- 11.2. Company Profiles
- 11.2.1 Ford
- 11.2.1.1. Overview
- 11.2.1.2. Products
- 11.2.1.3. SWOT Analysis
- 11.2.1.4. Recent Developments
- 11.2.1.5. Financials (Based on Availability)
- 11.2.2 GM
- 11.2.2.1. Overview
- 11.2.2.2. Products
- 11.2.2.3. SWOT Analysis
- 11.2.2.4. Recent Developments
- 11.2.2.5. Financials (Based on Availability)
- 11.2.3 Daimler
- 11.2.3.1. Overview
- 11.2.3.2. Products
- 11.2.3.3. SWOT Analysis
- 11.2.3.4. Recent Developments
- 11.2.3.5. Financials (Based on Availability)
- 11.2.4 Toyota
- 11.2.4.1. Overview
- 11.2.4.2. Products
- 11.2.4.3. SWOT Analysis
- 11.2.4.4. Recent Developments
- 11.2.4.5. Financials (Based on Availability)
- 11.2.5 Volkswagen
- 11.2.5.1. Overview
- 11.2.5.2. Products
- 11.2.5.3. SWOT Analysis
- 11.2.5.4. Recent Developments
- 11.2.5.5. Financials (Based on Availability)
- 11.2.6 Honda Motor
- 11.2.6.1. Overview
- 11.2.6.2. Products
- 11.2.6.3. SWOT Analysis
- 11.2.6.4. Recent Developments
- 11.2.6.5. Financials (Based on Availability)
- 11.2.7 Nissan Motor
- 11.2.7.1. Overview
- 11.2.7.2. Products
- 11.2.7.3. SWOT Analysis
- 11.2.7.4. Recent Developments
- 11.2.7.5. Financials (Based on Availability)
- 11.2.1 Ford
List of Figures
- Figure 1: Global Sports Utility Vehicles Suvs Revenue Breakdown (million, %) by Region 2025 & 2033
- Figure 2: North America Sports Utility Vehicles Suvs Revenue (million), by Application 2025 & 2033
- Figure 3: North America Sports Utility Vehicles Suvs Revenue Share (%), by Application 2025 & 2033
- Figure 4: North America Sports Utility Vehicles Suvs Revenue (million), by Type 2025 & 2033
- Figure 5: North America Sports Utility Vehicles Suvs Revenue Share (%), by Type 2025 & 2033
- Figure 6: North America Sports Utility Vehicles Suvs Revenue (million), by Country 2025 & 2033
- Figure 7: North America Sports Utility Vehicles Suvs Revenue Share (%), by Country 2025 & 2033
- Figure 8: South America Sports Utility Vehicles Suvs Revenue (million), by Application 2025 & 2033
- Figure 9: South America Sports Utility Vehicles Suvs Revenue Share (%), by Application 2025 & 2033
- Figure 10: South America Sports Utility Vehicles Suvs Revenue (million), by Type 2025 & 2033
- Figure 11: South America Sports Utility Vehicles Suvs Revenue Share (%), by Type 2025 & 2033
- Figure 12: South America Sports Utility Vehicles Suvs Revenue (million), by Country 2025 & 2033
- Figure 13: South America Sports Utility Vehicles Suvs Revenue Share (%), by Country 2025 & 2033
- Figure 14: Europe Sports Utility Vehicles Suvs Revenue (million), by Application 2025 & 2033
- Figure 15: Europe Sports Utility Vehicles Suvs Revenue Share (%), by Application 2025 & 2033
- Figure 16: Europe Sports Utility Vehicles Suvs Revenue (million), by Type 2025 & 2033
- Figure 17: Europe Sports Utility Vehicles Suvs Revenue Share (%), by Type 2025 & 2033
- Figure 18: Europe Sports Utility Vehicles Suvs Revenue (million), by Country 2025 & 2033
- Figure 19: Europe Sports Utility Vehicles Suvs Revenue Share (%), by Country 2025 & 2033
- Figure 20: Middle East & Africa Sports Utility Vehicles Suvs Revenue (million), by Application 2025 & 2033
- Figure 21: Middle East & Africa Sports Utility Vehicles Suvs Revenue Share (%), by Application 2025 & 2033
- Figure 22: Middle East & Africa Sports Utility Vehicles Suvs Revenue (million), by Type 2025 & 2033
- Figure 23: Middle East & Africa Sports Utility Vehicles Suvs Revenue Share (%), by Type 2025 & 2033
- Figure 24: Middle East & Africa Sports Utility Vehicles Suvs Revenue (million), by Country 2025 & 2033
- Figure 25: Middle East & Africa Sports Utility Vehicles Suvs Revenue Share (%), by Country 2025 & 2033
- Figure 26: Asia Pacific Sports Utility Vehicles Suvs Revenue (million), by Application 2025 & 2033
- Figure 27: Asia Pacific Sports Utility Vehicles Suvs Revenue Share (%), by Application 2025 & 2033
- Figure 28: Asia Pacific Sports Utility Vehicles Suvs Revenue (million), by Type 2025 & 2033
- Figure 29: Asia Pacific Sports Utility Vehicles Suvs Revenue Share (%), by Type 2025 & 2033
- Figure 30: Asia Pacific Sports Utility Vehicles Suvs Revenue (million), by Country 2025 & 2033
- Figure 31: Asia Pacific Sports Utility Vehicles Suvs Revenue Share (%), by Country 2025 & 2033
List of Tables
- Table 1: Global Sports Utility Vehicles Suvs Revenue million Forecast, by Application 2020 & 2033
- Table 2: Global Sports Utility Vehicles Suvs Revenue million Forecast, by Type 2020 & 2033
- Table 3: Global Sports Utility Vehicles Suvs Revenue million Forecast, by Region 2020 & 2033
- Table 4: Global Sports Utility Vehicles Suvs Revenue million Forecast, by Application 2020 & 2033
- Table 5: Global Sports Utility Vehicles Suvs Revenue million Forecast, by Type 2020 & 2033
- Table 6: Global Sports Utility Vehicles Suvs Revenue million Forecast, by Country 2020 & 2033
- Table 7: United States Sports Utility Vehicles Suvs Revenue (million) Forecast, by Application 2020 & 2033
- Table 8: Canada Sports Utility Vehicles Suvs Revenue (million) Forecast, by Application 2020 & 2033
- Table 9: Mexico Sports Utility Vehicles Suvs Revenue (million) Forecast, by Application 2020 & 2033
- Table 10: Global Sports Utility Vehicles Suvs Revenue million Forecast, by Application 2020 & 2033
- Table 11: Global Sports Utility Vehicles Suvs Revenue million Forecast, by Type 2020 & 2033
- Table 12: Global Sports Utility Vehicles Suvs Revenue million Forecast, by Country 2020 & 2033
- Table 13: Brazil Sports Utility Vehicles Suvs Revenue (million) Forecast, by Application 2020 & 2033
- Table 14: Argentina Sports Utility Vehicles Suvs Revenue (million) Forecast, by Application 2020 & 2033
- Table 15: Rest of South America Sports Utility Vehicles Suvs Revenue (million) Forecast, by Application 2020 & 2033
- Table 16: Global Sports Utility Vehicles Suvs Revenue million Forecast, by Application 2020 & 2033
- Table 17: Global Sports Utility Vehicles Suvs Revenue million Forecast, by Type 2020 & 2033
- Table 18: Global Sports Utility Vehicles Suvs Revenue million Forecast, by Country 2020 & 2033
- Table 19: United Kingdom Sports Utility Vehicles Suvs Revenue (million) Forecast, by Application 2020 & 2033
- Table 20: Germany Sports Utility Vehicles Suvs Revenue (million) Forecast, by Application 2020 & 2033
- Table 21: France Sports Utility Vehicles Suvs Revenue (million) Forecast, by Application 2020 & 2033
- Table 22: Italy Sports Utility Vehicles Suvs Revenue (million) Forecast, by Application 2020 & 2033
- Table 23: Spain Sports Utility Vehicles Suvs Revenue (million) Forecast, by Application 2020 & 2033
- Table 24: Russia Sports Utility Vehicles Suvs Revenue (million) Forecast, by Application 2020 & 2033
- Table 25: Benelux Sports Utility Vehicles Suvs Revenue (million) Forecast, by Application 2020 & 2033
- Table 26: Nordics Sports Utility Vehicles Suvs Revenue (million) Forecast, by Application 2020 & 2033
- Table 27: Rest of Europe Sports Utility Vehicles Suvs Revenue (million) Forecast, by Application 2020 & 2033
- Table 28: Global Sports Utility Vehicles Suvs Revenue million Forecast, by Application 2020 & 2033
- Table 29: Global Sports Utility Vehicles Suvs Revenue million Forecast, by Type 2020 & 2033
- Table 30: Global Sports Utility Vehicles Suvs Revenue million Forecast, by Country 2020 & 2033
- Table 31: Turkey Sports Utility Vehicles Suvs Revenue (million) Forecast, by Application 2020 & 2033
- Table 32: Israel Sports Utility Vehicles Suvs Revenue (million) Forecast, by Application 2020 & 2033
- Table 33: GCC Sports Utility Vehicles Suvs Revenue (million) Forecast, by Application 2020 & 2033
- Table 34: North Africa Sports Utility Vehicles Suvs Revenue (million) Forecast, by Application 2020 & 2033
- Table 35: South Africa Sports Utility Vehicles Suvs Revenue (million) Forecast, by Application 2020 & 2033
- Table 36: Rest of Middle East & Africa Sports Utility Vehicles Suvs Revenue (million) Forecast, by Application 2020 & 2033
- Table 37: Global Sports Utility Vehicles Suvs Revenue million Forecast, by Application 2020 & 2033
- Table 38: Global Sports Utility Vehicles Suvs Revenue million Forecast, by Type 2020 & 2033
- Table 39: Global Sports Utility Vehicles Suvs Revenue million Forecast, by Country 2020 & 2033
- Table 40: China Sports Utility Vehicles Suvs Revenue (million) Forecast, by Application 2020 & 2033
- Table 41: India Sports Utility Vehicles Suvs Revenue (million) Forecast, by Application 2020 & 2033
- Table 42: Japan Sports Utility Vehicles Suvs Revenue (million) Forecast, by Application 2020 & 2033
- Table 43: South Korea Sports Utility Vehicles Suvs Revenue (million) Forecast, by Application 2020 & 2033
- Table 44: ASEAN Sports Utility Vehicles Suvs Revenue (million) Forecast, by Application 2020 & 2033
- Table 45: Oceania Sports Utility Vehicles Suvs Revenue (million) Forecast, by Application 2020 & 2033
- Table 46: Rest of Asia Pacific Sports Utility Vehicles Suvs Revenue (million) Forecast, by Application 2020 & 2033
Frequently Asked Questions
1. What is the projected Compound Annual Growth Rate (CAGR) of the Sports Utility Vehicles Suvs?
The projected CAGR is approximately XXX%.
2. Which companies are prominent players in the Sports Utility Vehicles Suvs?
Key companies in the market include Ford, GM, Daimler, Toyota, Volkswagen, Honda Motor, Nissan Motor.
3. What are the main segments of the Sports Utility Vehicles Suvs?
The market segments include Application, Type.
4. Can you provide details about the market size?
The market size is estimated to be USD XXX million as of 2022.
5. What are some drivers contributing to market growth?
N/A
6. What are the notable trends driving market growth?
N/A
7. Are there any restraints impacting market growth?
N/A
8. Can you provide examples of recent developments in the market?
N/A
9. What pricing options are available for accessing the report?
Pricing options include single-user, multi-user, and enterprise licenses priced at USD 2900.00, USD 4350.00, and USD 5800.00 respectively.
10. Is the market size provided in terms of value or volume?
The market size is provided in terms of value, measured in million.
11. Are there any specific market keywords associated with the report?
Yes, the market keyword associated with the report is "Sports Utility Vehicles Suvs," which aids in identifying and referencing the specific market segment covered.
12. How do I determine which pricing option suits my needs best?
The pricing options vary based on user requirements and access needs. Individual users may opt for single-user licenses, while businesses requiring broader access may choose multi-user or enterprise licenses for cost-effective access to the report.
13. Are there any additional resources or data provided in the Sports Utility Vehicles Suvs report?
While the report offers comprehensive insights, it's advisable to review the specific contents or supplementary materials provided to ascertain if additional resources or data are available.
14. How can I stay updated on further developments or reports in the Sports Utility Vehicles Suvs?
To stay informed about further developments, trends, and reports in the Sports Utility Vehicles Suvs, consider subscribing to industry newsletters, following relevant companies and organizations, or regularly checking reputable industry news sources and publications.
Methodology
Step 1 - Identification of Relevant Samples Size from Population Database


Step 2 - Approaches for Defining Global Market Size (Value, Volume* & Price*)

Note*: In applicable scenarios
Step 3 - Data Sources
Primary Research
- Web Analytics
- Survey Reports
- Research Institute
- Latest Research Reports
- Opinion Leaders
Secondary Research
- Annual Reports
- White Paper
- Latest Press Release
- Industry Association
- Paid Database
- Investor Presentations

Step 4 - Data Triangulation
Involves using different sources of information in order to increase the validity of a study
These sources are likely to be stakeholders in a program - participants, other researchers, program staff, other community members, and so on.
Then we put all data in single framework & apply various statistical tools to find out the dynamic on the market.
During the analysis stage, feedback from the stakeholder groups would be compared to determine areas of agreement as well as areas of divergence