

Key Insights
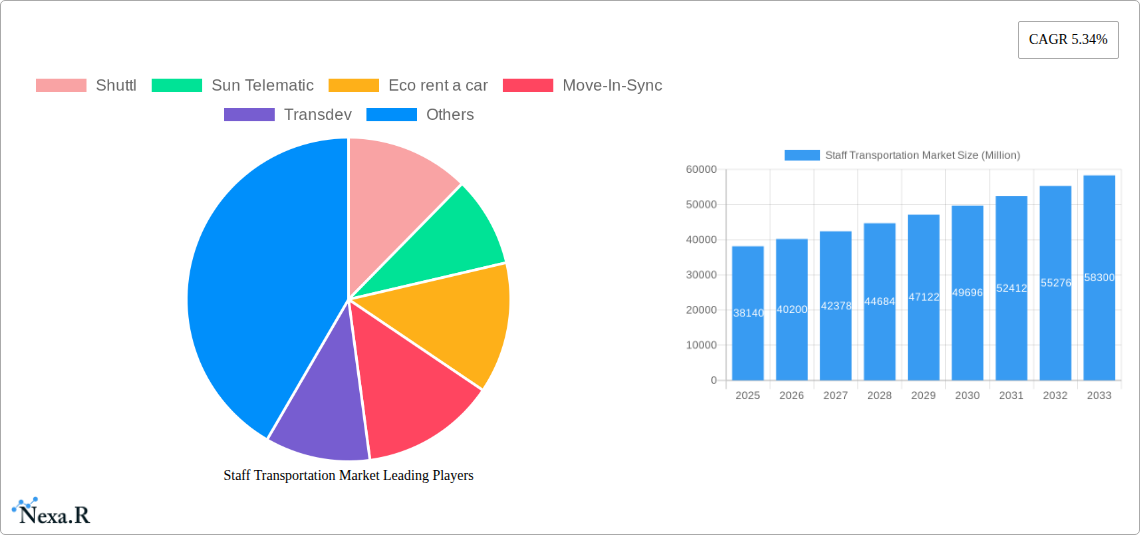
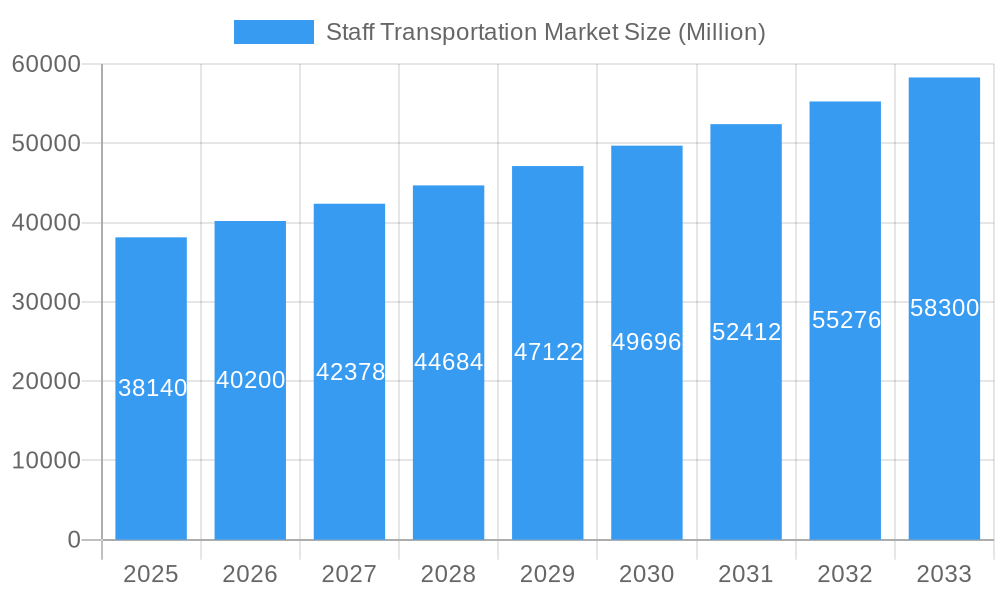
The global staff transportation market, valued at $38.14 billion in 2025, is projected to experience robust growth, driven by several key factors. The increasing adoption of technology in fleet management, including real-time tracking and route optimization software, is significantly enhancing operational efficiency and reducing costs for businesses. Furthermore, the rising demand for sustainable transportation solutions, such as electric and hybrid vehicles, is influencing market dynamics. Growing concerns about employee safety and well-being are also driving the demand for reliable and secure staff transportation services. The market is segmented by service type (MaaS, SaaS), ownership (company-owned, outsourced, rentals, pick-and-drop), and passenger vehicle type (cars, vans, buses). While the outsourced transportation service segment currently holds a significant share due to cost-effectiveness and scalability, the MaaS segment is witnessing rapid growth fueled by increasing smartphone penetration and user-friendly mobile applications. Geographical expansion, particularly in developing economies with burgeoning industries and increasing urbanization, presents significant opportunities for market expansion. However, challenges such as fluctuating fuel prices, stringent government regulations, and driver shortages could potentially restrain market growth in the coming years.
Staff Transportation Market Market Size (In Billion)
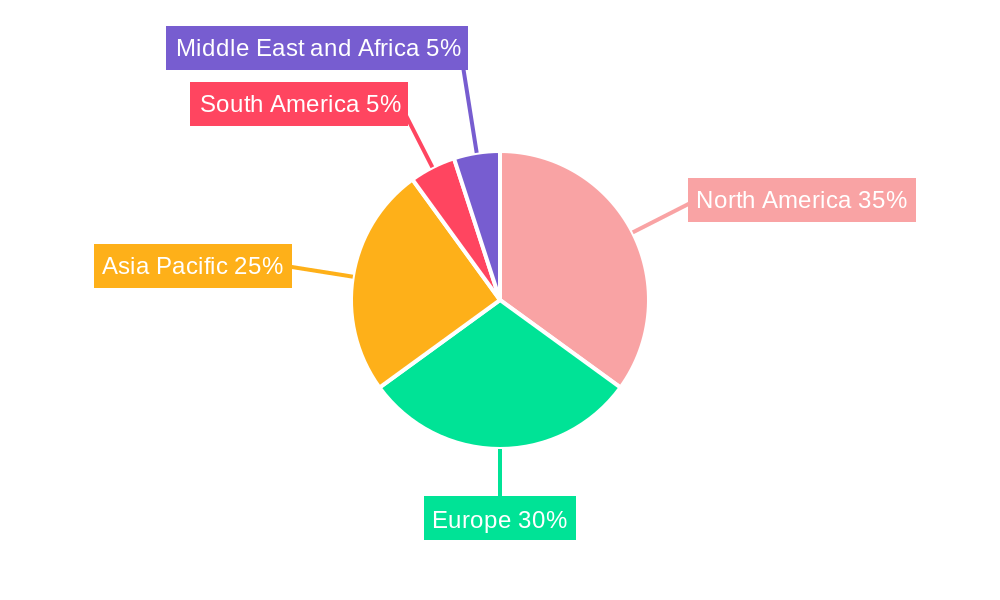
The forecast period (2025-2033) anticipates a continued upward trajectory, fueled by the aforementioned drivers. The projected Compound Annual Growth Rate (CAGR) of 5.34% indicates a substantial increase in market value by 2033. Regional variations are expected, with North America and Europe maintaining a substantial market share due to established transportation infrastructure and high corporate adoption. However, the Asia-Pacific region, driven by rapid economic growth and increasing urbanization in countries like India and China, is poised to witness the fastest growth rate. The competitive landscape is marked by a mix of large multinational corporations and smaller regional players. Strategic partnerships, technological advancements, and expansion into new geographical territories will be crucial factors shaping the market's competitive dynamics over the forecast period. Companies are focusing on providing customized solutions tailored to specific client needs, integrating advanced technologies, and improving service quality to gain a competitive edge.
Staff Transportation Market Company Market Share
Staff Transportation Market: A Comprehensive Report (2019-2033)
This comprehensive report provides an in-depth analysis of the Staff Transportation Market, encompassing its current dynamics, future growth trajectory, and key players. With a study period spanning 2019-2033, a base year of 2025, and a forecast period of 2025-2033, this report offers invaluable insights for businesses, investors, and industry professionals seeking to navigate this evolving market. The parent market is the broader transportation sector, while the child market is corporate employee transportation. The market size is projected to reach xx Million units by 2033.
Staff Transportation Market Dynamics & Structure
The Staff Transportation Market is characterized by a moderately concentrated landscape, with several large players competing alongside smaller, niche providers. Technological innovation, particularly in electric vehicles and MaaS platforms, is a key driver. Stringent regulatory frameworks concerning safety and emissions influence operational costs and market access. Competitive substitutes include personal vehicles and public transportation, constantly challenging the market's share. End-user demographics are shifting towards a preference for sustainable and convenient solutions. M&A activity remains relatively moderate, with xx deals recorded between 2019 and 2024, representing a xx% increase compared to the previous period.
- Market Concentration: Moderately concentrated, with a few major players holding significant market share (xx%).
- Technological Innovation: Electric vehicles, MaaS platforms, and SaaS solutions are key innovation drivers.
- Regulatory Frameworks: Safety and emission standards impact operational costs and market access.
- Competitive Substitutes: Personal vehicles and public transportation pose significant competition.
- End-User Demographics: Shifting preferences towards sustainable and convenient transportation solutions.
- M&A Trends: Moderate M&A activity, with xx deals recorded between 2019 and 2024.
Staff Transportation Market Growth Trends & Insights
The Staff Transportation Market has witnessed robust growth over the historical period (2019-2024), expanding at a CAGR of xx%. This growth is fueled by increasing corporate demand for efficient employee transportation solutions, rising urbanization, and growing adoption of technology. The market is witnessing a significant shift towards MaaS solutions, with an estimated xx% penetration rate by 2025. Technological disruptions, including the integration of AI and IoT, are improving operational efficiency and enhancing the user experience. Changing consumer behavior, driven by a desire for convenience and sustainability, is further propelling market growth. The market size is projected to reach xx Million units by 2025 and xx Million units by 2033, indicating sustained growth during the forecast period (2025-2033). This growth will be driven by continued adoption of technology, changing consumer preferences, and increasing urbanization.
Dominant Regions, Countries, or Segments in Staff Transportation Market
North America and Europe currently dominate the Staff Transportation Market, driven by strong corporate presence, well-developed infrastructure, and favorable regulatory environments. Within service types, MaaS is experiencing rapid growth, projected to capture xx% of the market by 2033. The Outsourced Transportation Service segment holds a significant market share, benefiting from cost efficiencies and scalability. Bus transportation accounts for the largest share of passenger vehicle types, owing to its capacity and cost-effectiveness for large-scale staff transportation.
- North America: Strong corporate presence, well-developed infrastructure, and high adoption of MaaS.
- Europe: Similar to North America, with significant focus on sustainability and electric vehicle adoption.
- MaaS: Rapid growth driven by convenience and technological advancements.
- Outsourced Transportation Service: Dominates due to cost efficiency and scalability.
- Bus Transportation: Largest share of passenger vehicle types due to capacity and cost-effectiveness.
Staff Transportation Market Product Landscape
The Staff Transportation Market is a dynamic and evolving sector, offering a spectrum of solutions from traditional shuttle services to cutting-edge Mobility-as-a-Service (MaaS) platforms. These advanced platforms integrate intelligent route optimization, real-time GPS tracking, and seamless payment gateways to streamline employee commutes. Product innovation is intensely focused on elevating passenger convenience, optimizing operational efficiency, and championing sustainability. Key performance indicators consistently monitored include punctuality, passenger satisfaction scores, and cost-effectiveness per mile. Unique selling propositions are increasingly centered on user-friendly mobile booking applications, personalized travel experiences, and a strong emphasis on eco-friendly transportation alternatives. Transformative advancements in electric vehicle (EV) technology and the application of AI-powered route optimization are profoundly reshaping the product landscape, making transportation smarter and greener.
Key Drivers, Barriers & Challenges in Staff Transportation Market
Key Drivers:
- Rising urbanization and increasing employee commute times.
- Growing corporate emphasis on employee well-being and convenience.
- Technological advancements improving efficiency and sustainability.
- Government initiatives promoting sustainable transportation.
Key Challenges:
- High initial investment costs for electric vehicle fleets and technological upgrades.
- Regulatory hurdles and permit requirements for operating transportation services.
- Competition from existing public transportation and ride-sharing services.
- Fluctuating fuel prices and potential supply chain disruptions.
Emerging Opportunities in Staff Transportation Market
- Geographic Expansion: Significant opportunities exist for expansion into untapped emerging markets in developing economies, catering to their growing industrial and corporate sectors.
- Technological Integration: Deepening the integration of advanced technologies such as Artificial Intelligence (AI) for predictive analytics and Internet of Things (IoT) for real-time monitoring and management promises enhanced operational efficiency and proactive problem-solving.
- Customized Solutions: The development of highly customized staff transportation solutions, tailored to the specific operational needs and schedules of diverse industries (e.g., IT parks, manufacturing hubs, healthcare facilities), presents a substantial growth avenue.
- Sustainability Focus: The escalating global demand for sustainable and eco-friendly transportation options presents a prime opportunity for companies offering green fleets and carbon-neutral commuting solutions.
- Data Analytics & Personalization: Leveraging data analytics to understand employee travel patterns and preferences allows for the creation of hyper-personalized and optimized transportation services.
Growth Accelerators in the Staff Transportation Market Industry
The Staff Transportation Market industry is experiencing accelerated growth driven by several key factors. Strategic collaborations and partnerships between established transportation providers and innovative technology companies are crucial in accelerating the adoption of new solutions and market penetration. Technological breakthroughs, particularly in the realm of electric vehicles (EVs) and the nascent but promising field of autonomous driving technologies, are fundamentally reshaping the industry landscape, promising greater efficiency and reduced operational costs. Furthermore, targeted market expansion strategies that focus on underserved regions and demographics are unlocking new growth opportunities, bringing efficient transportation to previously overlooked employee populations.
Notable Milestones in Staff Transportation Market Sector
- December 2021: Transdev bolstered sustainable transport by launching the largest electric bus fleet in the Nordic region, comprising 145 buses.
- September 2021: Uber India strategically expanded its corporate offerings with the launch of a dedicated corporate shuttle service designed for employee commuting.
- June 2022: Switch Mobility introduced the EiV12, an advanced electric bus specifically designed and unveiled for the growing staff transportation segment.
- Early 2023: Introduction of AI-powered dynamic routing software that significantly reduced commute times and fuel consumption for major corporate clients.
- Late 2023: Launch of integrated mobile apps that offer real-time tracking, booking, and feedback mechanisms, leading to a substantial increase in employee satisfaction.
In-Depth Staff Transportation Market Market Outlook
The Staff Transportation Market is projected for substantial and sustained growth over the coming forecast period. This robust expansion will be primarily fueled by a confluence of factors: ongoing technological advancements, a heightened corporate imperative for efficient and cost-effective employee transportation solutions, and an increasingly pronounced global focus on sustainability. Success in this dynamic and competitive sector will hinge on strategic partnerships, significant investments in diverse electric vehicle fleets, and proactive expansion into new and emerging markets. The market offers considerable opportunities for forward-thinking companies that can effectively harness the power of technology to deliver enhanced operational efficiency, superior convenience for employees, and a demonstrably positive impact on environmental sustainability.
Staff Transportation Market Segmentation
-
1. Ownership
- 1.1. Company-owned Transportation Service
- 1.2. Outsourced Transportation Service
- 1.3. Rentals
- 1.4. Pick and Drop Transportation Service
-
2. Passenger Vehicle Type
- 2.1. Cars
- 2.2. Vans
- 2.3. Bus
-
3. Service Type
- 3.1. Mobility as a Service (MaaS)
- 3.2. Software as a Service (SaaS)
Staff Transportation Market Segmentation By Geography
-
1. North America
- 1.1. United States
- 1.2. Canada
- 1.3. Rest of North America
-
2. Europe
- 2.1. Germany
- 2.2. United Kingdom
- 2.3. France
- 2.4. Rest of Europe
-
3. Asia Pacific
- 3.1. India
- 3.2. China
- 3.3. Japan
- 3.4. Rest of Asia Pacific
-
4. South America
- 4.1. Brazil
- 4.2. Argentina
- 4.3. Rest of the South America
-
5. Middle East and Africa
- 5.1. United Arab Emirates
- 5.2. Saudi Arabia
- 5.3. Rest of the Middle East and Africa
Staff Transportation Market Regional Market Share
Geographic Coverage of Staff Transportation Market
Staff Transportation Market REPORT HIGHLIGHTS
| Aspects | Details |
|---|---|
| Study Period | 2020-2034 |
| Base Year | 2025 |
| Estimated Year | 2026 |
| Forecast Period | 2026-2034 |
| Historical Period | 2020-2025 |
| Growth Rate | CAGR of 5.34% from 2020-2034 |
| Segmentation |
|
Table of Contents
- 1. Introduction
- 1.1. Research Scope
- 1.2. Market Segmentation
- 1.3. Research Objective
- 1.4. Definitions and Assumptions
- 2. Executive Summary
- 2.1. Market Snapshot
- 3. Market Dynamics
- 3.1. Market Drivers
- 3.2. Market Restrains
- 3.3. Market Trends
- 3.4. Market Opportunities
- 4. Market Factor Analysis
- 4.1. Porters Five Forces
- 4.1.1. Bargaining Power of Suppliers
- 4.1.2. Bargaining Power of Buyers
- 4.1.3. Threat of New Entrants
- 4.1.4. Threat of Substitutes
- 4.1.5. Competitive Rivalry
- 4.2. PESTEL analysis
- 4.3. BCG Analysis
- 4.3.1. Stars (High Growth, High Market Share)
- 4.3.2. Cash Cows (Low Growth, High Market Share)
- 4.3.3. Question Mark (High Growth, Low Market Share)
- 4.3.4. Dogs (Low Growth, Low Market Share)
- 4.4. Ansoff Matrix Analysis
- 4.5. Supply Chain Analysis
- 4.6. Regulatory Landscape
- 4.7. Current Market Potential and Opportunity Assessment (TAM–SAM–SOM Framework)
- 4.8. NRP Analyst Note
- 4.1. Porters Five Forces
- 5. Market Analysis, Insights and Forecast 2021-2033
- 5.1. Market Analysis, Insights and Forecast - by Ownership
- 5.1.1. Company-owned Transportation Service
- 5.1.2. Outsourced Transportation Service
- 5.1.3. Rentals
- 5.1.4. Pick and Drop Transportation Service
- 5.2. Market Analysis, Insights and Forecast - by Passenger Vehicle Type
- 5.2.1. Cars
- 5.2.2. Vans
- 5.2.3. Bus
- 5.3. Market Analysis, Insights and Forecast - by Service Type
- 5.3.1. Mobility as a Service (MaaS)
- 5.3.2. Software as a Service (SaaS)
- 5.4. Market Analysis, Insights and Forecast - by Region
- 5.4.1. North America
- 5.4.2. Europe
- 5.4.3. Asia Pacific
- 5.4.4. South America
- 5.4.5. Middle East and Africa
- 5.1. Market Analysis, Insights and Forecast - by Ownership
- 6. Global Staff Transportation Market Analysis, Insights and Forecast, 2021-2033
- 6.1. Market Analysis, Insights and Forecast - by Ownership
- 6.1.1. Company-owned Transportation Service
- 6.1.2. Outsourced Transportation Service
- 6.1.3. Rentals
- 6.1.4. Pick and Drop Transportation Service
- 6.2. Market Analysis, Insights and Forecast - by Passenger Vehicle Type
- 6.2.1. Cars
- 6.2.2. Vans
- 6.2.3. Bus
- 6.3. Market Analysis, Insights and Forecast - by Service Type
- 6.3.1. Mobility as a Service (MaaS)
- 6.3.2. Software as a Service (SaaS)
- 6.1. Market Analysis, Insights and Forecast - by Ownership
- 7. North America Staff Transportation Market Analysis, Insights and Forecast, 2020-2032
- 7.1. Market Analysis, Insights and Forecast - by Ownership
- 7.1.1. Company-owned Transportation Service
- 7.1.2. Outsourced Transportation Service
- 7.1.3. Rentals
- 7.1.4. Pick and Drop Transportation Service
- 7.2. Market Analysis, Insights and Forecast - by Passenger Vehicle Type
- 7.2.1. Cars
- 7.2.2. Vans
- 7.2.3. Bus
- 7.3. Market Analysis, Insights and Forecast - by Service Type
- 7.3.1. Mobility as a Service (MaaS)
- 7.3.2. Software as a Service (SaaS)
- 7.1. Market Analysis, Insights and Forecast - by Ownership
- 8. Europe Staff Transportation Market Analysis, Insights and Forecast, 2020-2032
- 8.1. Market Analysis, Insights and Forecast - by Ownership
- 8.1.1. Company-owned Transportation Service
- 8.1.2. Outsourced Transportation Service
- 8.1.3. Rentals
- 8.1.4. Pick and Drop Transportation Service
- 8.2. Market Analysis, Insights and Forecast - by Passenger Vehicle Type
- 8.2.1. Cars
- 8.2.2. Vans
- 8.2.3. Bus
- 8.3. Market Analysis, Insights and Forecast - by Service Type
- 8.3.1. Mobility as a Service (MaaS)
- 8.3.2. Software as a Service (SaaS)
- 8.1. Market Analysis, Insights and Forecast - by Ownership
- 9. Asia Pacific Staff Transportation Market Analysis, Insights and Forecast, 2020-2032
- 9.1. Market Analysis, Insights and Forecast - by Ownership
- 9.1.1. Company-owned Transportation Service
- 9.1.2. Outsourced Transportation Service
- 9.1.3. Rentals
- 9.1.4. Pick and Drop Transportation Service
- 9.2. Market Analysis, Insights and Forecast - by Passenger Vehicle Type
- 9.2.1. Cars
- 9.2.2. Vans
- 9.2.3. Bus
- 9.3. Market Analysis, Insights and Forecast - by Service Type
- 9.3.1. Mobility as a Service (MaaS)
- 9.3.2. Software as a Service (SaaS)
- 9.1. Market Analysis, Insights and Forecast - by Ownership
- 10. South America Staff Transportation Market Analysis, Insights and Forecast, 2020-2032
- 10.1. Market Analysis, Insights and Forecast - by Ownership
- 10.1.1. Company-owned Transportation Service
- 10.1.2. Outsourced Transportation Service
- 10.1.3. Rentals
- 10.1.4. Pick and Drop Transportation Service
- 10.2. Market Analysis, Insights and Forecast - by Passenger Vehicle Type
- 10.2.1. Cars
- 10.2.2. Vans
- 10.2.3. Bus
- 10.3. Market Analysis, Insights and Forecast - by Service Type
- 10.3.1. Mobility as a Service (MaaS)
- 10.3.2. Software as a Service (SaaS)
- 10.1. Market Analysis, Insights and Forecast - by Ownership
- 11. Middle East and Africa Staff Transportation Market Analysis, Insights and Forecast, 2020-2032
- 11.1. Market Analysis, Insights and Forecast - by Ownership
- 11.1.1. Company-owned Transportation Service
- 11.1.2. Outsourced Transportation Service
- 11.1.3. Rentals
- 11.1.4. Pick and Drop Transportation Service
- 11.2. Market Analysis, Insights and Forecast - by Passenger Vehicle Type
- 11.2.1. Cars
- 11.2.2. Vans
- 11.2.3. Bus
- 11.3. Market Analysis, Insights and Forecast - by Service Type
- 11.3.1. Mobility as a Service (MaaS)
- 11.3.2. Software as a Service (SaaS)
- 11.1. Market Analysis, Insights and Forecast - by Ownership
- 12. Competitive Analysis
- 12.1. Company Profiles
- 12.1.1 Shuttl
- 12.1.1.1. Company Overview
- 12.1.1.2. Products
- 12.1.1.3. Company Financials
- 12.1.1.4. SWOT Analysis
- 12.1.2 Sun Telematic
- 12.1.2.1. Company Overview
- 12.1.2.2. Products
- 12.1.2.3. Company Financials
- 12.1.2.4. SWOT Analysis
- 12.1.3 Eco rent a car
- 12.1.3.1. Company Overview
- 12.1.3.2. Products
- 12.1.3.3. Company Financials
- 12.1.3.4. SWOT Analysis
- 12.1.4 Move-In-Sync
- 12.1.4.1. Company Overview
- 12.1.4.2. Products
- 12.1.4.3. Company Financials
- 12.1.4.4. SWOT Analysis
- 12.1.5 Transdev
- 12.1.5.1. Company Overview
- 12.1.5.2. Products
- 12.1.5.3. Company Financials
- 12.1.5.4. SWOT Analysis
- 12.1.6 Prairie Bus Line Limited
- 12.1.6.1. Company Overview
- 12.1.6.2. Products
- 12.1.6.3. Company Financials
- 12.1.6.4. SWOT Analysis
- 12.1.7 Janani Tours
- 12.1.7.1. Company Overview
- 12.1.7.2. Products
- 12.1.7.3. Company Financials
- 12.1.7.4. SWOT Analysis
- 12.1.8 Busbank (Global Charter Services Ltd )
- 12.1.8.1. Company Overview
- 12.1.8.2. Products
- 12.1.8.3. Company Financials
- 12.1.8.4. SWOT Analysis
- 12.1.9 First Class Tours
- 12.1.9.1. Company Overview
- 12.1.9.2. Products
- 12.1.9.3. Company Financials
- 12.1.9.4. SWOT Analysis
- 12.1.1 Shuttl
- 12.2. Market Entropy
- 12.2.1 Company's Key Areas Served
- 12.2.2 Recent Developments
- 12.3. Company Market Share Analysis 2025
- 12.3.1 Top 5 Companies Market Share Analysis
- 12.3.2 Top 3 Companies Market Share Analysis
- 12.4. List of Potential Customers
- 13. Research Methodology
List of Figures
- Figure 1: Global Staff Transportation Market Revenue Breakdown (Million, %) by Region 2025 & 2033
- Figure 2: North America Staff Transportation Market Revenue (Million), by Ownership 2025 & 2033
- Figure 3: North America Staff Transportation Market Revenue Share (%), by Ownership 2025 & 2033
- Figure 4: North America Staff Transportation Market Revenue (Million), by Passenger Vehicle Type 2025 & 2033
- Figure 5: North America Staff Transportation Market Revenue Share (%), by Passenger Vehicle Type 2025 & 2033
- Figure 6: North America Staff Transportation Market Revenue (Million), by Service Type 2025 & 2033
- Figure 7: North America Staff Transportation Market Revenue Share (%), by Service Type 2025 & 2033
- Figure 8: North America Staff Transportation Market Revenue (Million), by Country 2025 & 2033
- Figure 9: North America Staff Transportation Market Revenue Share (%), by Country 2025 & 2033
- Figure 10: Europe Staff Transportation Market Revenue (Million), by Ownership 2025 & 2033
- Figure 11: Europe Staff Transportation Market Revenue Share (%), by Ownership 2025 & 2033
- Figure 12: Europe Staff Transportation Market Revenue (Million), by Passenger Vehicle Type 2025 & 2033
- Figure 13: Europe Staff Transportation Market Revenue Share (%), by Passenger Vehicle Type 2025 & 2033
- Figure 14: Europe Staff Transportation Market Revenue (Million), by Service Type 2025 & 2033
- Figure 15: Europe Staff Transportation Market Revenue Share (%), by Service Type 2025 & 2033
- Figure 16: Europe Staff Transportation Market Revenue (Million), by Country 2025 & 2033
- Figure 17: Europe Staff Transportation Market Revenue Share (%), by Country 2025 & 2033
- Figure 18: Asia Pacific Staff Transportation Market Revenue (Million), by Ownership 2025 & 2033
- Figure 19: Asia Pacific Staff Transportation Market Revenue Share (%), by Ownership 2025 & 2033
- Figure 20: Asia Pacific Staff Transportation Market Revenue (Million), by Passenger Vehicle Type 2025 & 2033
- Figure 21: Asia Pacific Staff Transportation Market Revenue Share (%), by Passenger Vehicle Type 2025 & 2033
- Figure 22: Asia Pacific Staff Transportation Market Revenue (Million), by Service Type 2025 & 2033
- Figure 23: Asia Pacific Staff Transportation Market Revenue Share (%), by Service Type 2025 & 2033
- Figure 24: Asia Pacific Staff Transportation Market Revenue (Million), by Country 2025 & 2033
- Figure 25: Asia Pacific Staff Transportation Market Revenue Share (%), by Country 2025 & 2033
- Figure 26: South America Staff Transportation Market Revenue (Million), by Ownership 2025 & 2033
- Figure 27: South America Staff Transportation Market Revenue Share (%), by Ownership 2025 & 2033
- Figure 28: South America Staff Transportation Market Revenue (Million), by Passenger Vehicle Type 2025 & 2033
- Figure 29: South America Staff Transportation Market Revenue Share (%), by Passenger Vehicle Type 2025 & 2033
- Figure 30: South America Staff Transportation Market Revenue (Million), by Service Type 2025 & 2033
- Figure 31: South America Staff Transportation Market Revenue Share (%), by Service Type 2025 & 2033
- Figure 32: South America Staff Transportation Market Revenue (Million), by Country 2025 & 2033
- Figure 33: South America Staff Transportation Market Revenue Share (%), by Country 2025 & 2033
- Figure 34: Middle East and Africa Staff Transportation Market Revenue (Million), by Ownership 2025 & 2033
- Figure 35: Middle East and Africa Staff Transportation Market Revenue Share (%), by Ownership 2025 & 2033
- Figure 36: Middle East and Africa Staff Transportation Market Revenue (Million), by Passenger Vehicle Type 2025 & 2033
- Figure 37: Middle East and Africa Staff Transportation Market Revenue Share (%), by Passenger Vehicle Type 2025 & 2033
- Figure 38: Middle East and Africa Staff Transportation Market Revenue (Million), by Service Type 2025 & 2033
- Figure 39: Middle East and Africa Staff Transportation Market Revenue Share (%), by Service Type 2025 & 2033
- Figure 40: Middle East and Africa Staff Transportation Market Revenue (Million), by Country 2025 & 2033
- Figure 41: Middle East and Africa Staff Transportation Market Revenue Share (%), by Country 2025 & 2033
List of Tables
- Table 1: Global Staff Transportation Market Revenue Million Forecast, by Ownership 2020 & 2033
- Table 2: Global Staff Transportation Market Revenue Million Forecast, by Passenger Vehicle Type 2020 & 2033
- Table 3: Global Staff Transportation Market Revenue Million Forecast, by Service Type 2020 & 2033
- Table 4: Global Staff Transportation Market Revenue Million Forecast, by Region 2020 & 2033
- Table 5: Global Staff Transportation Market Revenue Million Forecast, by Ownership 2020 & 2033
- Table 6: Global Staff Transportation Market Revenue Million Forecast, by Passenger Vehicle Type 2020 & 2033
- Table 7: Global Staff Transportation Market Revenue Million Forecast, by Service Type 2020 & 2033
- Table 8: Global Staff Transportation Market Revenue Million Forecast, by Country 2020 & 2033
- Table 9: United States Staff Transportation Market Revenue (Million) Forecast, by Application 2020 & 2033
- Table 10: Canada Staff Transportation Market Revenue (Million) Forecast, by Application 2020 & 2033
- Table 11: Rest of North America Staff Transportation Market Revenue (Million) Forecast, by Application 2020 & 2033
- Table 12: Global Staff Transportation Market Revenue Million Forecast, by Ownership 2020 & 2033
- Table 13: Global Staff Transportation Market Revenue Million Forecast, by Passenger Vehicle Type 2020 & 2033
- Table 14: Global Staff Transportation Market Revenue Million Forecast, by Service Type 2020 & 2033
- Table 15: Global Staff Transportation Market Revenue Million Forecast, by Country 2020 & 2033
- Table 16: Germany Staff Transportation Market Revenue (Million) Forecast, by Application 2020 & 2033
- Table 17: United Kingdom Staff Transportation Market Revenue (Million) Forecast, by Application 2020 & 2033
- Table 18: France Staff Transportation Market Revenue (Million) Forecast, by Application 2020 & 2033
- Table 19: Rest of Europe Staff Transportation Market Revenue (Million) Forecast, by Application 2020 & 2033
- Table 20: Global Staff Transportation Market Revenue Million Forecast, by Ownership 2020 & 2033
- Table 21: Global Staff Transportation Market Revenue Million Forecast, by Passenger Vehicle Type 2020 & 2033
- Table 22: Global Staff Transportation Market Revenue Million Forecast, by Service Type 2020 & 2033
- Table 23: Global Staff Transportation Market Revenue Million Forecast, by Country 2020 & 2033
- Table 24: India Staff Transportation Market Revenue (Million) Forecast, by Application 2020 & 2033
- Table 25: China Staff Transportation Market Revenue (Million) Forecast, by Application 2020 & 2033
- Table 26: Japan Staff Transportation Market Revenue (Million) Forecast, by Application 2020 & 2033
- Table 27: Rest of Asia Pacific Staff Transportation Market Revenue (Million) Forecast, by Application 2020 & 2033
- Table 28: Global Staff Transportation Market Revenue Million Forecast, by Ownership 2020 & 2033
- Table 29: Global Staff Transportation Market Revenue Million Forecast, by Passenger Vehicle Type 2020 & 2033
- Table 30: Global Staff Transportation Market Revenue Million Forecast, by Service Type 2020 & 2033
- Table 31: Global Staff Transportation Market Revenue Million Forecast, by Country 2020 & 2033
- Table 32: Brazil Staff Transportation Market Revenue (Million) Forecast, by Application 2020 & 2033
- Table 33: Argentina Staff Transportation Market Revenue (Million) Forecast, by Application 2020 & 2033
- Table 34: Rest of the South America Staff Transportation Market Revenue (Million) Forecast, by Application 2020 & 2033
- Table 35: Global Staff Transportation Market Revenue Million Forecast, by Ownership 2020 & 2033
- Table 36: Global Staff Transportation Market Revenue Million Forecast, by Passenger Vehicle Type 2020 & 2033
- Table 37: Global Staff Transportation Market Revenue Million Forecast, by Service Type 2020 & 2033
- Table 38: Global Staff Transportation Market Revenue Million Forecast, by Country 2020 & 2033
- Table 39: United Arab Emirates Staff Transportation Market Revenue (Million) Forecast, by Application 2020 & 2033
- Table 40: Saudi Arabia Staff Transportation Market Revenue (Million) Forecast, by Application 2020 & 2033
- Table 41: Rest of the Middle East and Africa Staff Transportation Market Revenue (Million) Forecast, by Application 2020 & 2033
Frequently Asked Questions
1. What is the projected Compound Annual Growth Rate (CAGR) of the Staff Transportation Market?
The projected CAGR is approximately 5.34%.
2. Which companies are prominent players in the Staff Transportation Market?
Key companies in the market include Shuttl, Sun Telematic, Eco rent a car, Move-In-Sync, Transdev, Prairie Bus Line Limited, Janani Tours, Busbank (Global Charter Services Ltd ), First Class Tours.
3. What are the main segments of the Staff Transportation Market?
The market segments include Ownership, Passenger Vehicle Type, Service Type.
4. Can you provide details about the market size?
The market size is estimated to be USD 38.14 Million as of 2022.
5. What are some drivers contributing to market growth?
Stringent Emission Regulations are Fueling the Market Growth.
6. What are the notable trends driving market growth?
Increasing Internet Usage and Technological Advancements to Drive Demand in the Market.
7. Are there any restraints impacting market growth?
High Cost of Electric Commercial Vehicle May Hamper the Growth.
8. Can you provide examples of recent developments in the market?
June 2022: Switch Mobility, the electric vehicle division of Hinduja Group flagship Ashok Leyland, unveiled the EiV12 electric bus, aiming to capture a significant share of the electric vehicle market with a slew of customer-friendly features. The company intends to serve inter-city, and intra-city, staff transportation with this launch.
9. What pricing options are available for accessing the report?
Pricing options include single-user, multi-user, and enterprise licenses priced at USD 4750, USD 5250, and USD 8750 respectively.
10. Is the market size provided in terms of value or volume?
The market size is provided in terms of value, measured in Million.
11. Are there any specific market keywords associated with the report?
Yes, the market keyword associated with the report is "Staff Transportation Market," which aids in identifying and referencing the specific market segment covered.
12. How do I determine which pricing option suits my needs best?
The pricing options vary based on user requirements and access needs. Individual users may opt for single-user licenses, while businesses requiring broader access may choose multi-user or enterprise licenses for cost-effective access to the report.
13. Are there any additional resources or data provided in the Staff Transportation Market report?
While the report offers comprehensive insights, it's advisable to review the specific contents or supplementary materials provided to ascertain if additional resources or data are available.
14. How can I stay updated on further developments or reports in the Staff Transportation Market?
To stay informed about further developments, trends, and reports in the Staff Transportation Market, consider subscribing to industry newsletters, following relevant companies and organizations, or regularly checking reputable industry news sources and publications.
Methodology
Step 1 - Identification of Relevant Samples Size from Population Database


Step 2 - Approaches for Defining Global Market Size (Value, Volume* & Price*)

Note*: In applicable scenarios
Step 3 - Data Sources
Primary Research
- Web Analytics
- Survey Reports
- Research Institute
- Latest Research Reports
- Opinion Leaders
Secondary Research
- Annual Reports
- White Paper
- Latest Press Release
- Industry Association
- Paid Database
- Investor Presentations

Step 4 - Data Triangulation
Involves using different sources of information in order to increase the validity of a study
These sources are likely to be stakeholders in a program - participants, other researchers, program staff, other community members, and so on.
Then we put all data in single framework & apply various statistical tools to find out the dynamic on the market.
During the analysis stage, feedback from the stakeholder groups would be compared to determine areas of agreement as well as areas of divergence